. 2025 Aug 13;16(8):e0137525.
doi: 10.1128/mbio.01375-25. Epub 2025 Jul 8.

The miR-302 cluster-IRFs-IRF1AS axis regulates influenza A virus replication in a species-specific manner

Affiliations

The miR-302 cluster-IRFs-IRF1AS axis regulates influenza A virus replication in a species-specific manner

Lingcai Zhao et al. mBio. .

Abstract

Non-coding RNAs are crucial orchestrators in the intricate dance between viruses and host cells, among which the expression and function of enhancer RNAs (eRNAs) during influenza virus infection remain largely unexplored. This study utilized whole transcriptome high-throughput sequencing to investigate the molecular mechanisms underpinning the species-specific regulation of influenza virus replication by the miR-302 cluster-IRFs-IRF1AS axis both in vivo and in vitro. Mechanistically, the CTNNB1-induced miR-302 cluster targeted various interferon regulatory factors (mainly IRF1 and IRF2) with varying affinities and silencing efficiencies, except for miR-302e and miR-302f. Furthermore, miR-302 cluster-IRFs triggered the induction of interferon-induced hub genes and hub lncRNAs defined through weighted gene co-expression network analysis. Importantly, the intricate interplay between IRFs, direct targets of the miR-302 cluster, and IRF1AS, an indirect target, in terms of gene loci and transcriptional regulation reveals a crosstalk in the miR-302 cluster-IRFs-IRF1AS axis. That is, on the one hand, IRF1 and IRF7 bind to the promoter of IRF1AS to promote the transcription of eRNAs. On the other hand, IRF1AS functions as an enhancer cluster that orchestrates and cis-regulates the transcription of IRF1, thereby rapidly amplifying the antiviral immune response initiated by miR-302 cluster-IRFs. In conclusion, we have unveiled a novel regulatory network governed by the miR-302 cluster-IRFs-IRF1AS, offering fresh perspectives on immune regulatory mechanisms.

Importance: Non-coding RNAs play a crucial role in regulating the three-dimensional structure of chromatin. They influence gene expression through various mechanisms and thereby contribute to the onset and progression of influenza A virus pathogenicity. Our comprehensive whole transcriptome sequencing analysis reveals a novel finding: the species-specific regulation of influenza virus replication by the miR-302 cluster-IRFs-IRF1AS axis. Our findings indicate that the miR-302 cluster-IRFs axis facilitates the transcription of key hub genes and hub lncRNAs, most of which significantly inhibit influenza virus replication. Notably, the downstream IRF1AS assembles into an enhancer cluster, orchestrating and cis-regulating the transcription of IRF1 to activate the interferon system. This investigation enhances our understanding of the regulatory network underlying viral infections and offers novel insights into immune regulatory mechanisms.

Keywords: IRFs-IRF1AS; enhancer RNAs; enhancer cluster; influenza A virus; miR-302 cluster-IRFs.


Conflict of interest statement

The authors declare no conflict of interest.

Figures

Fig 1
Fig 1
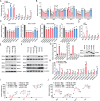
miR-302 cluster species differentially regulates influenza virus replication. (A) Schematic diagram illustrating the high-throughput sequencing utilized in this study. (B) A549, DF-1, or MLE12 cells were transfected with the indicated mimics. Cells were then infected with H1N1 or H9N2 at 24 h post-transfection (MOI = 0.01). Supernatants were collected at 12, 24, and 36 h post-infection, followed by plaque assay. (C) Similar to (B), except that other members of the miR-302 cluster were transfected into A549, DF-1, or MLE12 cells. The experiments were independently repeated three times, showing consistent outcomes. Data are presented as means ± standard deviations. Statistical differences between the overexpression group and the control group (NC mimics) are labeled according to two-way ANOVA with Dunnett’s multiple comparisons test. (a–f) indicated miR-302a-3p to miR-302f of the miR-302 cluster, respectively. ****, P < 0.0001; ns, no significance.
Fig 2
Fig 2
CTNNB1-induced miR-302 cluster targets IRF2, stimulating interferon-induced immune responses. (A) Genomic location of the miR-302 cluster on the Human genome (hg19/hg38). (B and C) A549 cells were either uninfected or infected with WSN/1933 (MOI = 1) and lysed at 12 and 24 h post-infection, followed by qPCR (B). Additionally, nuclear and cytoplasmic proteins were separately isolated for subsequent Western blot analysis (C). (D and E) A549 cells were transfected with the indicated siRNA for 48 h, followed by Western blot (D) or qPCR (E). (F) The indicated fragments were inserted into the pGL3-basic vector to generate reporter plasmids. A luciferase reporter assay was employed to measure promoter activity. The expression of MYC-tagged CTNNB1 was detected by Western blot. (G) A549 cells were transfected with the indicated siRNA and infected with WSN/1933 (MOI = 1) 24 h later. Subsequently, cells were lysed 24 h post-infection, followed by qPCR. (H) The target genes of miR-302-3p were predicted by integrating data from the miRDB, miRTarBase, and TargetScan databases with the differentially expressed genes (DEGs) from this study. A luciferase reporter assay was employed to measure miRNA target gene. (I and J) A549 cells were transfected with has-miR-302b-3p or NC mimics. At 24 h after transfection, cells were infected with WSN/1933 (MOI = 0.01), and then qPCR was performed to detect mRNA levels of IRF2 (I), IFNβ, or IL6 (J) at 0 and 12 h after infection. (K) A luciferase reporter assay was utilized to quantify the promoter activity of IFN-β, NF-κB, or ISRE element. The expression of MYC-tagged IRF2 was detected by Western blot. (L and M) A549 cells were transfected with siRNA targeting IRF2 or with scrambled siRNA (L); alternatively, cells were transfected with pCAGGS-IRF2-MYC or empty vectors for 24 h (M), followed by viral infection. After 12 h, the mRNA levels were evaluated via qPCR. Experiments were independently repeated three times, with similar results. The results are presented as means ± standard deviations. Statistical differences between designated groups are noted according to one-way ANOVA or two-way ANOVA with Dunnett’s multiple comparisons test. *, P < 0.05; **, P < 0.01; ****, P < 0.0001; ns, no significance.
Fig 3
Fig 3
The miR-302 cluster-IRFs regulates influenza virus-induced immune responses in a species-specific manner. (A) A549 cells were either untreated or infected with WSN/1933 (MOI = 0.1) and lysed at 12 h post-infection, followed by qPCR. (B) A549 cells were transfected with miR-302 cluster members or NC mimics. After 24 h of transfection, cells were infected with WSN/1933 (MOI = 0.1) and lysed at 12 h post-infection, followed by qPCR. (a–f) indicated miR-302a-3p to miR-302f of the miR-302 cluster, respectively. (C) Predicted binding sites of the miR-302 cluster in the 3′-UTR of IRFs mRNA were investigated. A luciferase reporter assay was employed to measure miRNA target gene. (D) A549 cells were infected with WSN (MOI = 1) for 12 h. Subsequently, the infected cells were harvested and lysed for immunoprecipitation using anti-AGO2 or anti-mouse IgG antibody. The relative enrichment of each transcript was determined via qPCR. (E) A549 cells were transfected with miR-302b-3p or NC mimics. At 24 h post-transfection, cells were infected with WSN/1933 (MOI = 0.1) and then lysed at 12 h post-infection, followed by Western blot analysis. (F) A549 cells were transfected with other miR-302 cluster members or NC mimics. At 24 h post-transfection, cells were lysed and subjected to Western blot analysis. (G) Similar to Fig. 2K, but IRF1-MYC, IRF5-MYC, IRF8-MYC, IRF9-MYC overexpression plasmids or empty vectors were co-transfected into HEK293T cells. The expression levels of MYC-tagged IRF1, IRF5, IRF8, and IRF9 were analyzed by Western blotting. (H) Similar to (E), but the mRNA levels of each IRF at 0 and 12 h after virus infection were assessed by qPCR. In addition, IRF2 expression was utilized as a control. (I and J) The specified miR-302 cluster members or NC mimics were transfected into DF-1 cells (I) or MLE12 cells (J). Subsequently, 24 h post-transfection, cells were infected with WSN/1933 (MOI = 0.1) and then lysed at 12 h post-infection, followed by qPCR. The experiments were repeated independently three times, yielding consistent results. The results are presented as means ± standard deviations. Statistical differences between groups were calculated according to one-way ANOVA or two-way ANOVA with Dunnett’s multiple comparisons test, using the NC mimics or empty vectors group as controls or as specified in other panels. *, P < 0.05; **, P < 0.01; ***, P < 0.001; ****, P < 0.0001; ns, no significance.
Fig 4
Fig 4
The miR-302 cluster-IRFs axis activates the transcription of hub genes and hub lncRNAs. (A) A549 cells were either uninfected or infected with A/WSN/1933 or CK/SH/49/19 at MOI = 0.1, and harvested at 12 and 24 h post-infection, followed by qPCR. A heat map was employed, with each row representing one gene, and the number in each rectangle indicating the log2FC value. (B) A549 cells were transfected with NC mimics or has-miR-302b-3p, or with the IRF2 siRNA. At 24 h post-transfection, cells were either uninfected or infected with WSN/1933 (MOI = 0.1), and harvested at 12 h post-infection, followed by qPCR. A heat map, similar to (A), was utilized for visualization. (C) A549 cells were transfected with the indicated siRNA for 24 h. Subsequently, the cells were either uninfected or infected with WSN/1933 (MOI = 0.1) and lysed after 12 h, followed by qPCR. (D) A549 cells were transfected with siRNA targeting specific non-coding genes or with scrambled siRNA for 24 hours, followed by infection with WSN/1933 (MOI = 0.01). Supernatants were collected at 12, 24, and 36 h post-infection, followed by plaque assay. (E) Similar to (D), but A549 cell lines overexpressing the specified non-coding RNAs constructed by the pMXs-IRES-Blasticidin retroviral vector. (F and G) Similar to (D), but A549 cells were transfected with empty pCAGGS or plasmids encoding the specified hub genes. In (D–G), statistical differences among groups were shown according to two-way ANOVA with Dunnett’s multiple comparisons test, using NC si, pMX-NC, or pCAGGS groups as controls. In addition, the statistical analysis results of (D–G) are indicated in brackets. ****, P < 0.0001; ns, no significance.
Fig 5
Fig 5
IRF1 AS forms an enhancer cluster, coordinates and cis-regulates the transcription of IRF1, and activates the interferon system. (A–C) A549-gNC, A549-g1, and A549-g2 cell lines were untreated (Mock) or infected with WSN/1933 (MOI = 0.1), and lysed after 12 h, followed by qPCR (A and B) or Western blot analysis (C), with color depth representing the log2FC (A). (D) Specific genomic fragments were individually amplified and cloned into the pGL3 vector (for detailed fragment information, see Table S2, eRNA analysis). A luciferase reporter assay was performed to assess enhancer activity in both uninfected and influenza virus WSN/1933-infected cells (MOI = 0.1). In the upper panel, E2–E10 correspond to enhancers 2 through 10, respectively. IRF1AS-P1 and IRF1-P1 denote the P1 fragments of the IRF1AS and IRF1 promoters, respectively, as shown in Fig. S6. (E) Following the procedure described in (A), the RNA levels of specific enhancer RNAs were assessed by qPCR. (F) The designated enhancer fragments were individually inserted upstream of the IRF1 promoter sequence (referred to as IRF1 P1 in Fig. S6D) and cloned into the pGL3 vector to construct a series of reporter plasmids, after which promoter activity was assessed. (G) HEK293T cells were co-transfected with either the pGL3 vector or the pGL3-IRF1AS p1-IRF1 p1 reporter plasmid, together with the pRL-TK plasmid and either specified gene expression plasmids or an empty vector. A luciferase reporter assay was performed to evaluate the impact of various factors on promoter activity. (H) Chromatin was isolated from A549 cells and subjected to immunoprecipitation with anti-RELA, anti-IRF7, anti-IRF1, or IgG antibodies, followed by ChIP. The enrichment of IRF1AS and IRF1 promoter regions was assessed using qPCR. (I and J) The upper panel illustrates that paired sgRNAs were designed to target different enhancer regions of IRF1AS, and knockout cell lines (A549g1 to A549g10) were subsequently generated using the CRISPR-Cas9 system. A549-gNC and the knockout cell lines were either left uninfected or infected with WSN/1933 (MOI = 0.1), lysed after 12 h, and subjected to Western blot analysis (I) or qPCR (J). In (J), the left panel displays the relative expression levels of hub genes, while the right panel shows the expression levels of hub lncRNAs. The mean change (log2FC) in each gene’s expression is depicted using a cloud plot, which combines features of a half-violin plot and a scatter plot and was generated using ggplot2. The results are presented as means ± standard deviations. In panels (D–G), statistical differences among groups were shown according to one-way ANOVA or two-way ANOVA with Dunnett’s multiple comparisons test, using Mock, pGL3-IRF1 p1, and empty vectors as control groups, respectively, and other figures were compared according to the indicated groups. *, P < 0.05; **, P < 0.01; ***, P < 0.001; ****, P < 0.0001; ns, no significance.
Fig 6
Fig 6
miR-302 cluster regulates replication of influenza A virus via IRFs-IRF1AS axis. (A) Schematic representation of the CRISPR-Cas9-mediated knockout of the IRF1AS enhancer cluster in A549 cell lines. Two pairs of sgRNAs were designed to target the IRF1AS promoter region (P1) and enhancer region (E9), thereby deleting the entire IRF1AS enhancer cluster locus. Polyclonal cell lines were selected using puromycin and validated by sequencing (see Table S3 for details). (B and C) A549-gNC and A549-gIRF1AS cells (IRF1AS enhancer cluster knockout cell line) were transfected with either NC siRNA or IRF2 siRNA and co-transfected with either NC mimic or miR-302b-3p. At 24 h post-transfection, the cells were infected with WSN/1933 at an MOI of 0.1, lysed after 12 h, and subjected to Western blot (B) or qPCR (C) analysis. (D) A549-gNC and A549-gIRF1AS cells were treated as described in (B) and (C), but were infected with either A/WSN/1933 (H1N1) or CK/SH/49/19 (H9N2) at an MOI of 0.01. Supernatants were collected at 12, 24, and 36 h post-infection and subjected to plaque assays. The experiments were independently repeated three times, yielding consistent results. Data are presented as means ± standard deviations. Statistical differences between specified groups were determined using two-way ANOVA with Dunnett’s multiple comparisons test. ns, not significant.
Fig 7
Fig 7
miR-302b-3p stimulates the transcription of interferon and hub genes, inhibiting influenza virus replication in mice. (A) Experimental design schematic for mouse studies. BALB/c mice were randomly assigned to four groups and administered miR-302b-3p agomir or NC mimics via tail vein injection for three consecutive days. (B) On the day of infection (Day 0), three mice from each group receiving either NC mimics or miR-302b-3p agomir were randomly selected for euthanasia. Lung tissue was collected, and the protein levels of IRFs were assessed by Western blot analysis. (C and D) Infection kinetics in the mice were determined by body weight loss (C) and the survival curve (D). (E–G) On the third day after infection, three mice in each group were randomly selected to be euthanized, and lung tissue was harvested. The viral loads in the lungs of mice infected with influenza virus were measured by plaque assay (E). Pathological sections of mouse lungs were stained with H&E. Scale bars, 50 µm (F). The expression levels of interferon and hub genes in lung tissue were detected by qPCR (G). The results are presented as means ± standard deviations. Statistical differences between designated groups are noted according to the two-tailed, unpaired t-test. ***, P < 0.001.
Fig 8
Fig 8
Schematic diagram of the miR-302 cluster-IRFs-IRF1AS axis regulating influenza virus replication. Influenza virus infection downregulates CTNNB1, thereby affecting the transcription of the miR-302 cluster. In turn, the miR-302 cluster targets various interferon regulatory factors (primarily IRF2, IRF1, and IRF9) with different affinities and silencing efficiencies and regulates cellular immune responses in a species-specific manner, leading to the activation of hub genes and hub lncRNAs as defined by WGCNA. Interestingly, IRF1 and IRF7 not only bind to the promoter region of IRF1AS to promote the transcription of numerous enhancer RNAs, but also, the IRF1AS locus forms an enhancer cluster that coordinates the cis-regulation of IRF1 transcription, thereby rapidly amplifying the antiviral immune response initiated by the miR-302 cluster-IRFs axis.

Similar articles

References

    1. Wu F, Zhao S, Yu B, Chen Y-M, Wang W, Song Z-G, Hu Y, Tao Z-W, Tian J-H, Pei Y-Y, Yuan M-L, Zhang Y-L, Dai F-H, Liu Y, Wang Q-M, Zheng J-J, Xu L, Holmes EC, Zhang Y-Z. 2020. A new coronavirus associated with human respiratory disease in China. Nature 579:265–269. doi: 10.1038/s41586-020-2008-3 - DOI - PMC - PubMed
    1. Zhou P, Yang X-L, Wang X-G, Hu B, Zhang L, Zhang W, Si H-R, Zhu Y, Li B, Huang C-L, et al. 2020. A pneumonia outbreak associated with a new coronavirus of probable bat origin. Nature 579:270–273. doi: 10.1038/s41586-020-2012-7 - DOI - PMC - PubMed
    1. Eisfeld AJ, Biswas A, Guan L, Gu C, Maemura T, Trifkovic S, Wang T, Babujee L, Dahn R, Halfmann PJ, Barnhardt T, Neumann G, Suzuki Y, Thompson A, Swinford AK, Dimitrov KM, Poulsen K, Kawaoka Y. 2024. Pathogenicity and transmissibility of bovine H5N1 influenza virus. Nature 633:426–432. doi: 10.1038/s41586-024-07766-6 - DOI - PMC - PubMed
    1. Guan L, Eisfeld AJ, Pattinson D, Gu C, Biswas A, Maemura T, Trifkovic S, Babujee L, Presler R Jr, Dahn R, Halfmann PJ, Barnhardt T, Neumann G, Thompson A, Swinford AK, Dimitrov KM, Poulsen K, Kawaoka Y. 2024. Cow's milk containing avian influenza A(H5N1) virus - heat inactivation and infectivity in mice. N Engl J Med 391:87–90. doi: 10.1056/NEJMc2405495 - DOI - PubMed
    1. Herfst S, Schrauwen EJA, Linster M, Chutinimitkul S, de Wit E, Munster VJ, Sorrell EM, Bestebroer TM, Burke DF, Smith DJ, Rimmelzwaan GF, Osterhaus A, Fouchier RAM. 2012. Airborne transmission of influenza A/H5N1 virus between ferrets. Science 336:1534–1541. doi: 10.1126/science.1213362 - DOI - PMC - PubMed

LinkOut - more resources