. 2025 Sep 1;224(9):e202504004.
doi: 10.1083/jcb.202504004. Epub 2025 Jul 8.

Optogenetic and chemical genetic tools for rapid repositioning of vimentin intermediate filaments

Affiliations

Optogenetic and chemical genetic tools for rapid repositioning of vimentin intermediate filaments

Milena Pasolli et al. J Cell Biol. .

Abstract

Intermediate filaments (IFs) are a key component of the cytoskeleton, essential for regulating cell mechanics, maintaining nuclear integrity, organelle positioning, and modulating cell signaling. Current insights into IF function primarily come from studies using long-term perturbations, such as protein depletion or mutation. Here, we present tools that allow rapid manipulation of vimentin IFs in the whole cytoplasm or within specific subcellular regions by inducibly coupling them to microtubule motors, either pharmacologically or using light. Rapid perinuclear clustering of vimentin had no major immediate effects on the actin or microtubule organization, cell spreading, or focal adhesion number, but it reduced cell stiffness. Mitochondria and endoplasmic reticulum (ER) sheets were reorganized due to vimentin clustering, whereas lysosomes were only briefly displaced and rapidly regained their normal distribution. Keratin moved along with vimentin in some cell lines but remained intact in others. Our tools help to study the immediate and local effects of vimentin perturbation and identify direct links of vimentin to other cellular structures.


Conflict of interest statement

Disclosures: The authors declare no competing interests exist.

Figures

None
Graphical abstract
Figure 1.
Figure 1.
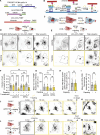
Repositioning of the vimentin network by rapalog-induced recruitment of kinesin motors. (A) A scheme of rapalog-induced heterodimerization constructs. A truncated motor domain of P. patens kinesin-14b (ppKin14, amino acids 861–1321) is fused to the FRB domain, along with a GCN4 leucine zipper for tetramerization and a BFP tag for detection. A fragment of human KIF5A (amino acids 1–560) is fused to an HA-tagged dimeric motor domain and the FRB domain. The FKBP domain and mCherry were fused to the C terminus of vimentin. Flexible glycine-serine linkers separate protein domains. (B and C) Schemes illustrating vimentin repositioning triggered by rapalog-induced recruitment of kinesins at the level of a single microtubule (B) and in whole cells (C). Without rapalog, Vim-mCh-FKBP does not interact with either FRB-BFP-GCN4-ppKin14 or HA-KIF5A-FRB. Upon rapalog addition, FRB and FKBP heterodimerize, triggering motor attachment to vimentin filaments and their movement along microtubules. Minus-end-directed kinesins trigger vimentin clustering around the MTOC, whereas plus end–directed kinesins cause the formation of small peripheral clusters and a large perinuclear one. (D and E) Representative fluorescence images of COS-7 cells co-transfected with Vim-mCh-FKBP and FRB fusions of the indicated motors, with or without 1 h of rapalog treatment. The top panels show untreated cells, whereas the bottom panels display rapalog-treated cells. Transfected cells are outlined with dashed lines, and non-transfected cells serve as controls. Anti-vimentin and anti-HA antibodies detect total vimentin and HA-KIF5A-FRB, respectively. (F) Quantifications of the fraction of the cell area occupied by vimentin in untransfected and transfected cells with either minus- or plus-end motor constructs, with and without rapalog treatment. (G–I) Mean fluorescence intensities of Vim-mCh-FKBP intensity (G), FRB-BFP-GCN4-ppKin14 (H), and HA-KIF5A-FRB, detected with anti-HA antibody (I) per cell, normalized to untransfected cells. In (F–I), n = 19–34 cells per condition across three independent experiments. Plots indicate mean ± SD, with individual cell measurements shown as dots. ns, not significant; ∗, P < 0.05; ∗∗∗∗, P < 0.0001. Statistical significance was assessed using the Mann–Whitney t test for (H) and (I), while the Kruskal–Wallis test followed by Dunn’s multiple comparisons test was applied for (F) and (G). (J andL) Live-cell imaging reveals the morphology of the vimentin network immediately before and at 10, 20, and 60 min after rapalog addition. Cells co-transfected with ppKin14 (J) or KIF5A constructs (L) show vimentin reorganization over time. (K and M) Cells shown in J and L, fixed and stained with antibodies against vimentin 60 min after rapalog treatment.
Figure S1.
Figure S1.
Motor recruitment to the filaments with the rapalog system and repositioning of the vimentin network in U2OS cells. (A) Fluorescence images of COS-7 cells expressing Vim-mCh-FKBP. The overexpressed vimentin is visualized by mCherry fluorescence, while total vimentin intensity is detected via anti-vimentin immunostaining. The dashed box indicates the region of the cell enlarged in the zoom image. Images were captured using Airyscan microscopy. (B and C) Fluorescence images of COS-7 cells co-transfected with Vim-mCh-FKBP and either FRB-GFP-GCN4-ppKin14 (B) or HA-KIF5A-FRB (C), with or without 5-min rapalog treatment. The top panels show untreated cells, while the bottom panels display rapalog-treated cells. FRB-GFP-GCN4-ppKin14 and HA-KIF5A-FRB are detected using anti-GFP and anti-HA antibodies respectively. Images were captured using Airyscan microscopy. (D and E) Representative fluorescence images of U2OS cells co-transfected with Vim-mCh-FKBP and FRB fusions of the indicated motors, with or without 1 h of rapalog treatment. Transfected cells are outlined with dashed lines, and non-transfected cells serve as controls. Anti-vimentin and anti-HA antibodies detect total vimentin and HA-KIF5A-FRB, respectively.
Figure 2.
Figure 2.
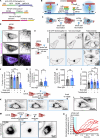
Reversible vimentin repositioning by optogenetic recruitment of kinesin motors to vimentin. (A) Schematic overview of optogenetic vimentin constructs. The constructs are similar to those shown in Fig. 1 A, except that FRB is substituted for iLID and FKBP for SSBmicro. GFP and mVenus are used as fluorescent markers in ppKin14 and KIF5A constructs, respectively. (B and C) Schematics illustrating the action of the optogenetic vimentin constructs. (B) Upon blue light activation, the iLID module changes conformation, uncaging an SsrA peptide, which binds to SspB. By tagging vimentin with SspB and ppKin14 and KIF5A with iLID, vimentin can be inducibly pulled toward microtubule minus or plus ends, respectively. (C) Transfection of cells with Vim-mCh-SspB combined with one of the two kinesin constructs and blue light activation results in vimentin pulling to microtubule minus or plus ends, causing vimentin clustering either at the MTOC (ppKin14) or both the cell periphery and MTOC (KIF5A). (D) U2OS cells expressing the Vim-mCh-SspB construct. The overexpressed vimentin network is visualized by mCherry fluorescence, while total vimentin intensity is detected via anti-vimentin immunostaining. Images were captured using scanning confocal microscopy. (E–I) U2OS cells co-transfected with Vim-mCh-SspB and iLID-GFP-GCN4-ppKin14 were either fixed in a dark room (DARK) or exposed to 45 min of blue light (LIT) prior to fixation and staining for vimentin (total vimentin). (E) Representative images, with transfected cells outlined with a dashed line. (F) Quantification of the fraction of the cell area occupied by vimentin. (G) Mean iLID-GFP-GCN4-ppKin14 fluorescence intensity per cell, normalized to untransfected cells. (H) Mean cell Vim-mCh-SspB fluorescence intensity. (I) Mean total cell area. (F–I)n = 23–29 cells per treatment analyzed over three experiments; bars show mean ± SD. ns, not significant; ∗∗∗∗, P < 0.0001 by Mann–Whitney test (G and H) or Kruskal–Wallis with Dunn’s test (F and I). (J–L) U2OS cells co-transfected with Vim-mCh-SspB and iLID-GFP-GCN4-ppKin14 were locally illuminated with 488-nm light pulses for 40 min before fixing and staining for vimentin. (J) Scheme of the experiment. (K) Stills with the region illuminated with blue light are indicated with a blue dashed box. (L) Vimentin staining in the cell shown in K was fixed after local illumination. (M and N) U2OS cells co-transfected with Vim-mCh-SspB and iLID-GFP-GCN4-ppKin14 were exposed to whole-cell 488-nm light pulses for 30 min to cluster vimentin, and then 488-nm pulses were stopped to allow cells to recover over 4 h. (M) Representative cell directly before light pulses (−30 min), after 30 min of 488-nm light pulsing (0 min), and after 4 h of recovery without blue light activation (4 h). (N) Quantification of Vim-mCh-SspB mean intensity at an ROI at the cell periphery over time; plot shows a line for every individual cell, n = 9 cells analyzed over three independent experiments.
Figure S2.
Figure S2.
Optogenetic minus end–directed motor recruitment and vimentin pulling by plus end–directed kinesin. (A) U2OS cells co-transfected with Vim-mCh-SspB and iLID-GFP-GCN4-ppKin14 were either fixed in a dark room (DARK) or exposed to 5 min of blue light (LIT) prior to fixation and staining for anti-GFP. Dashed box shows the region of the cell enlarged in the zoom panel. Images were captured using Airyscan confocal microscopy. (B) U2OS cells co-transfected with Vim-mCh-SspB and iLID-GFP-GCN4-ppKin14 and imaged live using spinning disc confocal microscopy. Cells were pulsed with 488 nm light for 30 min over the entire cell and then allowed to recover their vimentin distribution in the absence of blue light stimulation for 4 h. The graph shows quantification of construct expression levels based on fluorescence at the first frame, with background subtracted. Cells were categorized either as having no vimentin clustering (red square), vimentin pulling with recovery of vimentin spreading after 4 h (blue circle), or vimentin pulling without complete recovery of vimentin spreading after 4 h (green triangle). (C and D) Schematic overview of constructs for optogenetic plus end–directed vimentin pulling. (E) U2OS cells co-transfected with Vim-mCh-SspB and KIF5A-mVenus-iLID show vimentin relocalization to clusters in the cell periphery and at the cell center upon blue light activation. Live-cell imaging stills are shown before blue light activation (0 min) and 10 and 30 min after 488-nm pulsing.
Figure 3.
Figure 3.
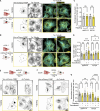
Effects of vimentin repositioning on the microtubule cytoskeleton. (A and B) COS-7 cells were co-transfected with Vim-mCh-FKBP and either FRB-BFP-GCN4-ppKin14 (A) or HA-KIF5A-FRB (B), with non-transfected cells as controls. Transfected cells are outlined with a dashed line. After 1 h of treatment with or without rapalog, cells were fixed for analysis. Representative fluorescent images display the microtubule network, labeled with antibodies against tyrosinated α-tubulin (Tyr-tubulin). Microtubules are further color-coded to indicate radial (cyan) and non-radial (yellow) orientations. (C) Quantification of tyrosinated α-tubulin intensity in cells expressing Vim-mCh-FKBP along with either FRB-BFP-GCN4-ppKin14 or HA-KIF5A-FRB, normalized to non-transfected cells, with or without rapalog treatment. n = 21–23 cells analyzed across two independent experiments. (D) Quantification of the ratio of non-radial to radial tyrosinated microtubules in non-transfected cells and cells expressing Vim-mCh-FKBP with either FRB-BFP-GCN4-ppKin14 or HA-KIF5A-FRB, with or without rapalog treatment. n = 20–22 cells were analyzed across two independent experiments. (E and F) Representative images of U2OS cells stained for acetylated microtubules (Ac-tubulin), showing either untransfected cells or cells co-expressing Vim-mCh-FKBP with either FRB-BFP-GCN4-ppKin14 (E) or HA-KIF5A-FRB (F). Transfected cells are outlined with a dashed line. After 1 h of treatment with or without rapalog, cells were fixed for analysis. (G) Quantification of normalized acetylated microtubule intensity in untransfected U2OS cells and cells co-expressing Vim-mCh-FKBP with either FRB-BFP-GCN4-ppKin14 or HA-KIF5A-FRB, in the presence and absence of rapalog. n = 37–49 cells were analyzed across three independent experiments. Plots indicate mean ± SD, with individual cell measurements shown as dots. ns, not significant; ∗, P < 0.05; ∗∗, P < 0.01; ∗∗∗, P < 0.001; ∗∗∗∗, P < 0.0001 as assessed by Kruskal–Wallis test.
Figure S3.
Figure S3.
KIF5A overexpression diminishes the abundance of acetylated microtubules. (A) Representative images of U2OS cells, either untransfected or transfected with HA-KIF5A-FRB, stained for acetylated microtubules (Ac-tubulin). The transfected cell is outlined with a dashed line. (B) Quantification of normalized acetylated microtubule intensity in untransfected U2OS cells and HA-KIF5A-FRB–expressing cells. A total of 31–32 cells were analyzed across three independent experiments. Data are presented as mean ± SD, with individual cell measurements shown as dots. ****, P < 0.0001 based on Mann–Whitney statistical analysis.
Figure 4.
Figure 4.
Effects of vimentin repositioning on the actin cytoskeleton, cell spreading, and focal adhesions. (A–F) COS-7 (A–C) or U2OS (D–F) cells were co-transfected with Vim-mCh-FKBP and FRB-BFP-GCN4-ppKin14, while non-transfected cells served as controls. Transfected cells are outlined with a dashed line. (A and D) After 1 h of treatment with or without rapalog, the cells were fixed and stained for total vimentin, paxillin, and actin using phalloidin. (B and E) Quantification of the total cell area based on the phalloidin staining in transfected (T) and untransfected (U) cells, with and without rapalog treatment. Dashed boxes show regions enlarged in the zoom panels. (C and F) Quantification of the total focal adhesion number based on paxillin staining, normalized to cell area as determined by phalloidin staining in both transfected and untransfected cells, with or without rapalog treatment. Measurements were collected from n = 28–31 cells in B and C and from n = 27–29 cells in E and F across three independent experiments. The plots display the mean ± SD, with individual cell measurements represented as dots. ns, not significant, determined by Kruskal–Wallis analysis.
Figure S4.
Figure S4.
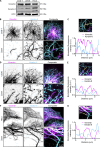
Endogenous vimentin and keratin-8 filament networks in COS-7, U2OS, and HeLa cells. (A) Expression levels of vimentin and keratin-8 in COS-7, U2OS, and HeLa cells were analyzed by western blotting. (B–G) Airyscan high-resolution images of vimentin and keratin-8 networks in COS-7 (B), U2OS (D), and HeLa cells (F), detected by staining with anti-vimentin and anti–keratin-8 antibodies, respectively. Zoomed-in views (5 × 5 µm), highlighted by the dashed box, showing the region of the cell enlarged in the zoom panel and intensity profiles for vimentin and keratin-8 along the indicated lines in COS-7 (C), U2OS (E), and HeLa (G) cells. Source data are available for this figure: SourceData FS4.
Figure 5.
Figure 5.
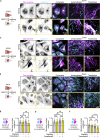
Effects of vimentin clustering on the keratin-8 network across cell lines. (A, C, and E) Indicated cell lines were co-transfected with Vim-mCh-FKBP and FRB-BFP-GCN4-ppKin14 constructs (transfected cells are outlined), while non-transfected cells served as controls. After 1 h of treatment with or without rapalog, the cells were fixed for analysis. Total vimentin and keratin-8 network intensities were measured after staining with anti-vimentin and anti–keratin-8 antibodies, respectively. The white dashed box indicates the region of the cell enlarged in zoom images. Images were obtained with Airyscan microscopy. (B, D, and F) Colocalization analysis in COS-7 (B), U2OS (D), and HeLa (F) cells. The graphs represent Manders’ coefficients of thresholded images, measured from 50.2 × 50.2-µm ROIs per COS-7 cell (B), 45.11 × 45.11-µm ROIs per U2OS cell (D), and 35.03 × 35.03-µm ROIs per HeLa cell (F). Graphs show mean ± SD, with individual cell measurements represented by dots. In B, data were collected from n = 25–29 cells; in D, n = 27–29 cells; and in F, n = 27–34 cells across three independent experiments. ns, not significant; ∗, P < 0.05; ∗∗, P < 0.01; ∗∗∗∗, P < 0.0001 based on Kruskal–Wallis statistical analysis.
Figure 6.
Figure 6.
Effects of vimentin repositioning on cell stiffness. (A and B) Schematic depiction of a control and a rapalog-treated U2OS cell co-transfected with Vim-mCh-FKBP and FRB-BFP-GCN4-ppKin14, before and during indentation in the perinuclear region using a spherical tip of 3.5-µm radius. Each cell was indented at three separate locations in the perinuclear region. (C) The graph presents the Young’s modulus of cells co-transfected with Vim-mCh-FKBP and FRB-BFP-GCN4-ppKin14 constructs, with and without rapalog treatment. Data were collected from n = 19–22 cells across two independent experiments. A total of 56 measurements were obtained from 19 cells without rapalog, and 63 measurements from 22 cells treated with rapalog. The plots display the mean ± SD, with each dot representing an individual cell measurement. ****, P < 0.0001 via Mann–Whitney test.
Figure S5.
Figure S5.
A force–distance curve for cell stiffness measurements. An example force curve used to determine the Young’s modulus of the cells. The raw data are shown in blue, and the Hertz model fit is the red line. Fitting was restricted to the first 1.5 µm of indentation, as shown in the figure.
Figure 7.
Figure 7.
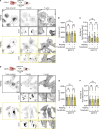
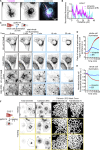
Effects of vimentin repositioning on ER morphology. (A and B) Representative image of a COS-7 cell stained for endogenous calnexin (ER) and vimentin, and (B) intensity profile along the indicated line. Images were collected using STED microscopy. (C–E) U2OS cells co-transfected with Vim-mCh-SspB, iLID-GFP-GCN4-ppKin14, and Halo-KDEL were first imaged for 5 min without 488-nm pulsing (−5 min, 0 min), then imaged for 25 min with whole-cell 488-nm pulsing to induce optogenetic vimentin clustering (5, 10, 25 min). (C) Spinning disc confocal images from the experiment, with black dashed boxes indicating the region of the cell enlarged in the zoom panels. (D) Plot showing ratio of perinuclear fluorescence intensity to intensity at the cell periphery. (E) Plot showing loss of total fluorescence signal over time. (F) Images of COS-7 cells expressing Vim-mCh-FKBP and FRB-BFP-GCN4-ppKin14. Transfected cells are outlined with dashed lines. After 1 h of treatment with or without rapalog, cells were fixed and stained for vimentin and calnexin. The images show the distribution of the ER network, visualized by calnexin staining, in both transfected (T) and untransfected (U) cells, in the presence and absence of rapalog. Dashed boxes show the regions that have been enlarged and shown as masks in the zoom images.
Figure 8.
Figure 8.
Localized optogenetic vimentin repositioning displaces dense ER matrices independent of RNF26. (A–C) U2OS WT (A) and RNF26 knockout (KO) (B) cells co-transfected with Vim-mCh-SspB, iLID-GFP-GCN4-ppKin14, and Halo-KDEL were pulsed with 488-nm light inside an ROI at the cell periphery (blue dashed box) for 20 min to locally displace vimentin. (A and B) Example images shown before blue light pulsing (0 min) and 5, 10, and 20 min after localized blue light application. The lack dashed box indicates the region of the cell enlarged in the zoom images. (C) Mean fluorescence intensity of Vim-mCh-SspB and Halo-KDEL (ER) inside the ROI pulsed with blue light was quantified over time and normalized to the first time point after subtracting background. Graph shows mean ± SD, n = 8–9 cells analyzed per group over three independent experiments.
Figure 9.
Figure 9.
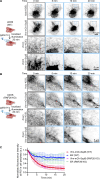
Effects of vimentin clustering on the distribution of mitochondria and lysosomes. (A and D) U2OS cell, co-transfected with Vim-mCh-SspB, iLID-GFP-GCN4-ppKin14, and Halo-MitoTag to label mitochondria (A) or LAMP1-Halo to label lysosomes (D), locally illuminated with 488-nm pulses inside an ROI (blue dashed box) for 10 min (A) or with global illumination for 20 min (D). The cell is shown before application of blue light (0 min) and at the indicated time points after blue light pulsing. (B and E) Imaging of U2OS cells transfected with Vim-mCh-FKBP and FRB-BFP-GCN4-ppKin14 constructs. After 1 h of treatment with or without rapalog, cells were subjected to immunostaining for total vimentin and cytochrome C to label mitochondria (B) or LAMTOR4 to label lysosomes (E). Transfected cells are indicated by a dotted outline. Images were acquired with Airyscan mode. (C and F) The distribution of mitochondria (C) or lysosomes (F) relative to the MTOC. Organelles were detected using the ComDet plugin, and their distance from the MTOC was calculated using a radius plugin. The graph shows the percentage of mitochondria or lysosomes located in the peripheral region, which was defined as an area beyond a 13.81-μm radius from the MTOC, with each dot representing data from an individual cell. Measurements were collected from n = 20–29 cells in C and from n = 20–22 cells in F across three independent experiments. The plots display the mean ± SD, with individual cell measurements represented as dots. ns, not significant; ∗∗, P < 0.01 by Mann–Whitney test.

References

    1. Andreu-Carbó, M., Egoldt C., Velluz M.-C., Aumeier C., Andreu-Carbó M., Egoldt C., Velluz M.-C., and Aumeier C.. 2024. Microtubule damage shapes the acetylation gradient. Nat. Commun. 15:2029. 10.1038/s41467-024-46379-5 - DOI - PMC - PubMed
    1. Aufderhorst-Roberts, A., and Koenderink G.H.. 2019. Stiffening and inelastic fluidization in vimentin intermediate filament networks. Soft Matter. 15:7127–7136. 10.1039/C9SM00590K - DOI - PubMed
    1. Bargagna-Mohan, P., Hamza A., Kim Y.E., Khuan Abby Ho Y., Mor-Vaknin N., Wendschlag N., Liu J., Evans R.M., Markovitz D.M., Zhan C.-G., et al. 2007. The tumor inhibitor and antiangiogenic agent withaferin A targets the intermediate filament protein vimentin. Chem. Biol. 14:623–634. 10.1016/j.chembiol.2007.04.010 - DOI - PMC - PubMed
    1. Bhattacharya, R., Gonzalez A.M., Debiase P.J., Trejo H.E., Goldman R.D., Flitney F.W., and Jones J.C.R.. 2009. Recruitment of vimentin to the cell surface by β3 integrin and plectin mediates adhesion strength. J. Cell Sci. 122:1390–1400. 10.1242/jcs.043042 - DOI - PMC - PubMed
    1. Bolte, S., and Cordelières F.P.. 2006. A guided tour into subcellular colocalization analysis in light microscopy. J. Microsc. 224:213–232. 10.1111/j.1365-2818.2006.01706.x - DOI - PubMed