Clinical Trial
. 2025 Jul 8;135(18):e185423.
doi: 10.1172/JCI185423. eCollection 2025 Sep 16.

NOTCH1 reverses immune suppression in small cell lung cancer through reactivation of STING

Affiliations
Clinical Trial

NOTCH1 reverses immune suppression in small cell lung cancer through reactivation of STING

Yoo Sun Kim et al. J Clin Invest. .

Abstract

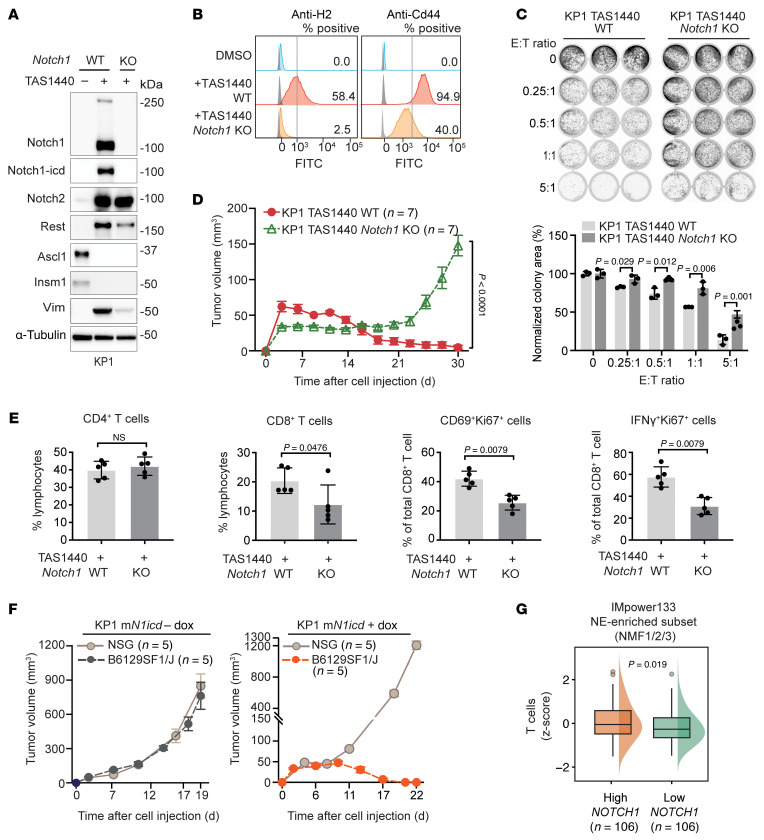
Downregulation of antigen presentation and lack of immune infiltration are defining features of small cell lung cancer (SCLC), limiting response to immune checkpoint blockade (ICB). While a high-MHC class I, immune-inflamed subset benefits from ICB, underlying mechanisms of immune response in SCLC have yet to be elucidated. Here we show that in the IMpower133 clinical trial, high, but not low, NOTCH1 expression was significantly associated with longer survival with the addition of ICB to chemotherapy among approximately 80% of SCLC patients with NE-enriched tumors (ASCL1-enriched, HR 0.39, P = 0.0012; NEUROD1-enriched, HR 0.44, P = 0.024). Overexpression or pharmacologic activation of NOTCH1 in ASCL1 and NEUROD1 SCLC cell lines dramatically upregulated MHC class I through epigenetic reactivation of STING. In syngeneic mouse models, Notch1 activation reprogrammed SCLC tumors from immune-excluded to immune-inflamed, facilitating durable, complete responses with ICB combined with a STING agonist. STING1 expression was significantly enriched in high- compared with low-NOTCH1-expressing tumors in IMpower133, validating our proposed mechanism. Our data reveal a previously undiscovered role for NOTCH1 as a critical driver of SCLC immunogenicity and a potential predictive biomarker for ICB in SCLC. NOTCH1 activation may be a therapeutic strategy to unleash antitumor immune responses in SCLC and other neuroendocrine cancers in which NOTCH1 is typically suppressed.

Keywords: Antigen; Biomarkers; Cancer immunotherapy; Cell biology; Immunology; Oncology.


Figures

Figure 1
Figure 1. High NOTCH1 expression is significantly associated with longer OS with the addition of atezolizumab (anti–PD-L1 inhibitor) to first-line chemotherapy among NE subsets of patients with extensive-stage SCLC in the IMpower133 clinical trial.
(A) Unbiased generalized random forest OS analysis comparing atezolizumab with placebo using the 32 genes of the Hallmark Notch signaling gene set within the NE-enriched (NMF1/2/3) subset of the IMpower133 clinical trial. Kaplan-Meier estimates of OS among the atezolizumab and placebo treatment groups of (B) NE-enriched, (C) non-NE-enriched (NMF4), (D) ASCL1-enriched (NMF2/3), and (E) NEUROD1-enriched (NMF1) IMpower133 subsets stratified by high (greater than or equal to median) and low (less than median) NOTCH1 expression. (F) Summary of OS hazard ratios, comparing atezolizumab with placebo based on high NOTCH1 expression among the main IMpower133 subsets. Vertical lines in survival graphs represent censored patients. P values were calculated using a log-rank test. P values were unadjusted, and values less than 0.05 were considered significant. Atezo, atezolizumab; HR, hazard ratio.
Figure 2
Figure 2. High NOTCH1 expression is significantly associated with longer OS with the addition of atezolizumab to first-line chemotherapy among all extensive-stage SCLC patients in the IMpower133 clinical trial, except those with high-POU2F3-expressing tumors.
(A) NOTCH1 expression and (B) MYC expression among IMpower133 subsets defined by Gay et al. (16). (C) MYC expression among high- and low- NOTCH1-expressing tumors in IMpower133, excluding only POU2F3-expressing tumors. (D) Kaplan-Meier estimates of OS stratified by NOTCH1 expression among the atezolizumab and placebo treatment groups of the IMpower133 trial, excluding only POU2F3-expressing tumors. P values were calculated using a log-rank test. P values were unadjusted, and values less than 0.05 were considered significant.
Figure 3
Figure 3. NOTCH1 exhibits a regulatory and expression pattern distinct from those of NOTCH2 and REST.
(A) Volcano plot showing Notch signaling, NE, and MYC genes differentially expressed between NE-enriched and non-NE-enriched tumors in IMpower133. (B) Stacked box plots showing fraction of patients with high and low NOTCH1 or NOTCH2 tumors among NE-enriched and non-NE-enriched subsets in IMpower133. (C) Reanalysis of RNA-Seq data from Ireland et al. (29) showing expression of Notch1, Notch2, and Rest at multiple time points in RPM cells grown in culture. RPM cells were derived from a Myc-driven SCLC mouse model (Rb1fl/fl;Trp53fl/fl; Lox-Stop-Lox [LSL]-MycT58A). (D) Volcano plot highlighting Notch1 and Notch2 with KP1 Rest overexpression; data from Shue et al. (25).
Figure 4
Figure 4. NOTCH1 reverses silencing of MHC class I and antigen presentation in SCLC.
(A) Gene set enrichment analysis of high- compared with low-NOTCH1-expressing tumors in the NE-enriched subset of IMpower133. (BE) N1ICD overexpression time course (0 to ≤56 days) in H82 cells with or without REST KO. (B) EMT signature (z scored) at the indicated time points as determined by RNA-Seq. (C) Flow cytometry histograms assessing cell-surface MHC class I expression at the indicated time points. (D) Immunoblot analysis of the indicated proteins. Three single-cell KO clones are shown. (E) Quantification of cell-surface MHC class I expression (data representative of n = 3 independent experiments). (F and G) Long-term (56 days) N1ICD and REST overexpression in H524 cells. (F) Immunoblot analysis of the indicated proteins. (G) Quantification of cell-surface MHC class I expression (data representative of n = 3 independent experiments). (H and I) Long-term (>56 days) overexpression of N1ICD in H69 cells. (H) Immunoblot analysis of the indicated proteins. (I) Flow cytometry assessing cell-surface MHC class I expression (data representative of n = 3 independent experiments). (J and K) Short-term (7 days) and/or long-term (28 days) treatment of COR-L88 cells with DMSO, TAS1440, and TAS1440 plus GSI (BMS-708163, 2 μM) as indicated (data representative of n > 3 independent experiments). (J) Immunoblot analysis of the indicated proteins. (K) Flow cytometry assessing cell-surface MHC class I expression. (L) AXL expression and (M) MHC class I signature (HLA-A, HLA-B, HLA-C, B2M, TAP1, TAP2, TAPBP) stratified by NOTCH1 expression among the NE-enriched subset of IMpower133. (N) Immunoblot analysis of the indicated proteins in H446 suspension, adherent, and H446 adherent N1ICD-overexpressed cells (56 days). (O) Flow cytometry assessing cell-surface MHC class I expression. For flow cytometry graphs, shaded gray histograms represent unstained controls for each condition. Positive cells are shifted to the right of the gray vertical line. P values were calculated using an unpaired 2-tailed Student’s t test. P values less than 0.05 were considered significant.
Figure 5
Figure 5. Notch signaling reprograms SCLC tumors from immune-excluded to immune-inflamed through increased T cell infiltration and activation.
(A) Schematic of in vitro and in vivo experiments. (B) Percentage lysis and IFN-γ concentration in supernatants of KP1 cells cocultured with OT-I T cells for 3 days after pulsing with OVA peptide. E, effector (OT-I T cells); T, target (KP1 cells) (data representative of n = 3 independent experiments). (C) Tumor growth curves and survival of KP1 allografts in B6129SF1/J immunocompetent and NSG immunocompromised mice (data representative of n = 2 independent experiments). (DF) Tumor microenvironment analysis of KP1 allograft tumors in B6129SF1/J immunocompetent mice 11 days after subcutaneous inoculation. (D) Flow cytometry assessing tumor T cells. (E) CD3+ and CD8+ T cell IHC. Arrowheads point to T cell clusters. Scale bars: 100 μm. (F) Spatial heatmap of CD3+ T cells analyzed by CODEX. (G) Tumor growth curves of KP1 TAS1440 allografts in B6129SF1/J immunocompetent mice with T cell depletion (upper panel). Isotype, CD4+, and CD8+ T cell depletion (n = 1 independent experiment). Combined CD4+ and CD8+ T cell depletion (n = 2 independent experiments). Flow cytometric analysis confirming T cell depletion in splenocytes (lower panel). P values were calculated using an unpaired 2-tailed Student’s t test or using a log-rank test. P values less than 0.05 were considered significant. Error bars in tumor growth curves (C and G) represent SEM.
Figure 6
Figure 6. Notch1 is the critical driver of the immunogenicity of SCLC.
(AE) KP1 SCLC mouse cells with or without Notch1 KO treated long-term (>28 days) with TAS1440. (A) Immunoblot analysis of Notch signaling, NE, and EMT proteins. (B) Flow cytometry histograms assessing cell-surface H2 and Cd44 expression. Shaded gray histograms represent unstained controls for each condition. Positive cells have an H2 or Cd44 signal higher than the referenced gray vertical line. Data representative of n = 3 independent experiments. (C) T cell–mediated killing assay showing remaining tumor cells assessed by crystal violet staining after coculture of KP1 cells with OT-I T cells for 3 days following OVA peptide pulsing. E, effector (OT-I T cells); T, target (KP1 cells). Colony area for each E:T condition was quantified and normalized to the no–T cell control (E:T = 0) within each group. (D) Tumor growth curves of KP1 TAS1440 allografts in B6129SF1/J immunocompetent mice and (E) flow cytometry T cell analysis 11 days after subcutaneous inoculation. (F) Notch1-icd overexpression in KP1 cells treated with doxycycline ex vivo long-term (>28 days) before subcutaneous inoculation into mice. Tumor growth curves of KP1 mN1icd allografts in immunocompetent and immunocompromised mice. (G) T cells signature stratified by NOTCH1 expression among NE-enriched tumors in IMpower133. Error bars in tumor growth curves (D and F) represent SEM. P values were calculated using an unpaired 2-tailed Student’s t test. P values less than 0.05 were considered significant.
Figure 7
Figure 7. NOTCH1 reverses silencing of antigen presentation in SCLC through reactivation of STING.
(A) Immunoblot analysis in COR-L88 cells treated either short-term (7 days) or long-term (28 days) with DMSO, TAS1440, and TAS1440 plus GSI (BMS-708163, 2 μM). (B) RNA-Seq expression of STING1 at the indicated time points in H82 cells overexpressing N1ICD. Immunoblot analysis showing Sting expression in (C) H446 cells overexpressing N1ICD and (D) mouse KP1 SCLC cells treated long-term with TAS1440, with or without Notch1 KO. (E) RNA-Seq expression of Sting1 in WT, Notch1-KO, and Notch2-KO tumors from the Hong et al. (47) dataset. (F) Immunoblot analysis of the indicated proteins in COR-L88 cells after NOTCH1-ICD or human NOTCH2-ICD overexpression. (G) STING1 expression stratified by NOTCH1 expression among NE-enriched tumors in IMpower133. (H) Visualization of H3K27ac peaks across the 5′ STING1 locus in H82 cells overexpressing N1ICD and COR-L88 cells treated with DMSO, TAS1440, and TAS1440 plus GSI (BMS-708163, 2 μM). Normalized total reads are shown in top left of each condition shown (data representative of n = 2 independent experiments). (I) RNA-Seq expression of APM genes in H82 cells overexpressing N1ICD and COR-L88 cells treated with DMSO, TAS1440, and TAS1440 plus GSI (BMS-708163, 2 μM) with or without STING1 KO. (J and K) COR-L88 and/or KP1 cells treated long-term (≥28 days) with DMSO, TAS1440, and TAS1440 plus GSI (COR-L88: BMS-708163, 2 μM; KP1: DBZ, 10 μM). Data are representative of n = 3 independent experiments. (J) Immunoblot analysis of STING pathway proteins with STING agonist treatment conditions as shown (COR-L88: diABZi, 500 nM for 4 hours; KP1: MSA-2, 30 μM for 1.5 hours). (K) CXCL10 quantification in cell supernatants by ELISA. P values were calculated using an unpaired 2-tailed Student’s t test. P values less than 0.05 were considered significant.
Figure 8
Figure 8. STING agonism combined with anti–PD-L1 therapy induces durable, complete antitumor immune responses in Notch-driven SCLC.
(A) Schematic of in vivo experiment. (B) Tumor growth curves of KP1 allografts treated in vivo with control (Ctrl; black), anti–PD-L1 (brown), MSA-2 (green), or anti–PD-L1 + MSA-2 (pink). Each line represents an individual mouse within a given experiment. The number of mice with complete responses within each cohort is shown in parentheses. (C) Tumor growth curves of KP1 allografts inoculated with KP1 TAS1440 Sting1-KO cells treated in vivo with MSA-2. Each line represents an individual mouse within a given experiment. The number of mice with complete tumor regressions within the overall cohort size is shown in parentheses above the curves. (D) Tumor growth curves of KP1 TAS1440 allografted mice with complete responses to anti–PD-L1 + MSA-2 combination treatment rechallenged with KP1 TAS1440 cells. Error bars in growth curves represent SEM.
Figure 9
Figure 9. NOTCH1 signaling is active in SCLC.
(A) NOTCH1 expression by RNA-Seq and NOTCH1-ICD by IHC in 6 SCLC PDXs. Percentage of positive NOTCH1-ICD tumor cells (1%, 5%, 10%, or 80%) and defined subset (ASCL1 or NEUROD1) are shown. (B) The percentage of NOTCH1-ICD IHC-positive samples in a cohort of 193 SCLC human tumors. IHC images were taken at ×40 and show tumors with variable percentages of positive NOTCH1-ICD tumor cells.

References

    1. Yang K, et al. Antigen presentation in cancer - mechanisms and clinical implications for immunotherapy. Nat Rev Clin Oncol. 2023;20(9):604–623. doi: 10.1038/s41571-023-00789-4. - DOI - PubMed
    1. Doyle A, et al. Markedly decreased expression of class I histocompatibility antigens, protein, and mRNA in human small-cell lung cancer. J Exp Med. 1985;161(5):1135–1151. doi: 10.1084/jem.161.5.1135. - DOI - PMC - PubMed
    1. Restifo NP, et al. Identification of human cancers deficient in antigen processing. J Exp Med. 1993;177(2):265–272. doi: 10.1084/jem.177.2.265. - DOI - PMC - PubMed
    1. Chen Y, et al. Infiltrating T lymphocytes in the tumor microenvironment of small cell lung cancer: a state of knowledge review. J Cancer Res Clin Oncol. 2022;148(4):881–895. doi: 10.1007/s00432-021-03895-x. - DOI - PMC - PubMed
    1. Muppa P, et al. Immune cell infiltration may be a key determinant of long-term survival in small cell lung cancer. J Thorac Oncol. 2019;14(7):1286–1295. doi: 10.1016/j.jtho.2019.03.028. - DOI - PubMed

Publication types

MeSH terms