. 2025 Jul 8;135(18):e172198.
doi: 10.1172/JCI172198. eCollection 2025 Sep 16.

Caloric restriction promotes resolution of atherosclerosis in obese mice, while weight regain accelerates its progression

Affiliations

Caloric restriction promotes resolution of atherosclerosis in obese mice, while weight regain accelerates its progression

Bianca Scolaro et al. J Clin Invest. .

Abstract

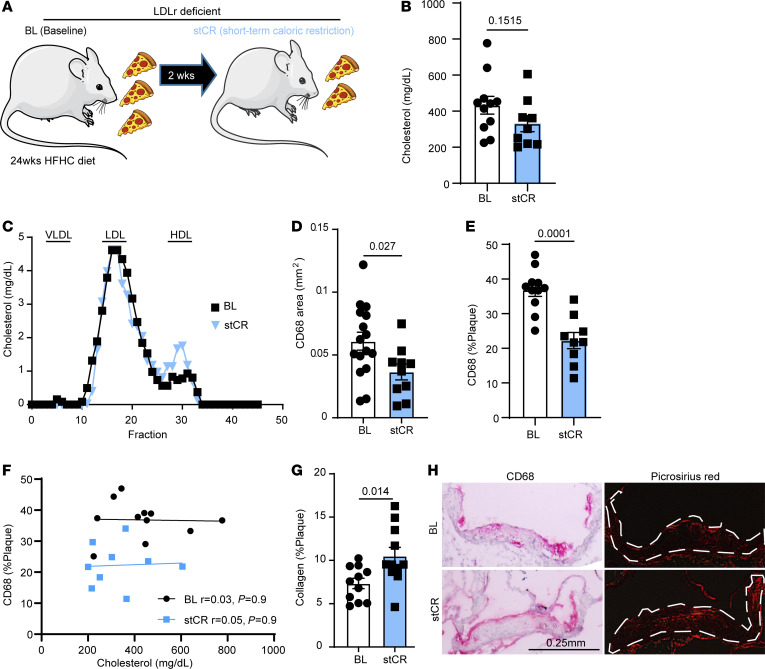
While weight loss is highly recommended for those with obesity, >60% regain their lost weight. This weight cycling is associated with an elevated risk of cardiovascular disease, relative to never having lost weight. How weight loss and regain directly influence atherosclerotic inflammation is unknown. Thus, we studied short-term caloric restriction (stCR) in obese hypercholesterolemic mice, without confounding effects from changes in diet composition. Weight loss promoted atherosclerosis resolution independent of plasma cholesterol. Single-cell RNA sequencing and subsequent mechanistic studies indicated that this can be partly attributed to a unique subset of macrophages accumulating with stCR in epididymal white adipose tissue (eWAT) and atherosclerotic plaques. These macrophages, distinguished by high expression of Fc γ receptor 4 (Fcgr4), helped to clear necrotic cores in atherosclerotic plaques. Conversely, weight regain (WR) following stCR accelerated atherosclerosis progression with disappearance of Fcgr4+ macrophages from eWAT and plaques. Furthermore, WR caused reprogramming of immune progenitors, sustaining hyperinflammatory responsiveness. In summary, we have developed a model to investigate the inflammatory effects of weight cycling on atherosclerosis and the interplay between adipose tissue, bone marrow, and plaques. The findings suggest potential approaches to promote atherosclerosis resolution in obesity and weight cycling through induction of Fcgr4+ macrophages and inhibition of immune progenitor reprogramming.

Keywords: Adipose tissue; Atherosclerosis; Cardiology; Inflammation; Innate immunity; Metabolism.


Conflict of interest statement

Conflict of interest: The authors have declared that no conflict of interest exists.

Figures

Figure 1
Figure 1. stCR induces atherosclerosis resolution.
(A) Experimental design. WT mice were fed a HFHC diet and treated with LDLr antisense oligonucleotide for 24 weeks to induce obesity and atherosclerosis (BL group). Mice were then calorically restricted for 2 weeks by reducing food intake by 30% (n = 12–14; stCR group). (B) Plasma cholesterol levels and (C) lipoprotein profile at the end of the experiment. Quantification in (C) was performed on pooled plasma from 3 mice/group. (D and E) Plaque macrophage content quantified through CD68 staining. (F) Simple linear regression showing lack of correlation between cholesterol levels and CD68 content in plaques. (G) Collagen quantification in plaques assessed through picrosirius red staining. (H) Representative aortic root images. Scale bar: 0.25 mm. Data are shown as the mean ± SEM. P values were determined via 2-tailed Student’s t test.
Figure 2
Figure 2. The immune landscape in plaque and eWAT changes with stCR.
(A) Unbiased clustering of scRNA-Seq dataset represented in an UMAP (uniform manifold approximation and projection). (B) Proportion of each cell cluster identified in the scRNA-Seq analysis. (C) Genes (columns) differentially expressed in stCR5compared with BL are plotted per cluster (rows) in eWAT (top) and plaques (bottom). Genes that are upregulated in BL and stCR are in blue and red, respectively, or those unchanged are in gray. All DEGs have adjusted P value < 0.1. Bias to stCR in eWAT indicates log2(stCR/BL) > 0; bias to BL in eWAT indicates log2(stCR/BL) < 0; bias to stCR in plaque indicates log2(stCR/BL) > 1; bias to BL in plaque indicates log2(stCR/BL) < –1. (D) Hierarchical clustering of DEGs in all macrophage clusters of the scRNA-Seq dataset and their associated enriched pathways. Values in the heatmap show row z scores of log2(stCR/BL) in plaque.
Figure 3
Figure 3. FCGR4+ macrophages accumulate with weight loss and promote a pro-reparative phenotype and increased efferocytosis.
(A) Fold change in the proportion of Fcgr4+ macrophages in stCR mice, compared with BL, in plaque and eWAT, quantified from the scRNA-Seq data. Dotted line indicates the BL levels, and P values (on top of bars) for the differences from BL were determined using false discovery rate. (B) Images and quantification of FCGR4 and macrophage staining in eWAT and aortic roots (n = 3–5). (C and D) Human Fcgr3a mRNA, or a scrambled sequence as control, was introduced to BMDMs. After 24 hours, macrophages were exposed to fluorescently labeled apoptotic macrophages. Efferocytotic events were determined as macrophages having an attached or engulfed red label. Scale bar: 100 μm. (EG) Plaque necrotic core quantification in root sections of BL and stCR mice presented in Figure 1 (n = 11–12). Scale bar: 0.25 mm. (HJ) In situ efferocytosis assay of aortic root sections in which (I) apoptotic cells were labeled by TUNEL (white), macrophages by anti-CD68 (green), and FCGR4 (red) and nuclei by DAPI (blue). White arrowheads indicate macrophage-associated TUNEL, purple arrowheads mark free TUNEL, and red arrowheads point to Fcgr4+ macrophages associated with TUNEL. Efferocytosis was calculated as (H) total efferocytes (TUNEL+ macrophages) and as (J) FCGR4+ and TUNEL+ macrophages. (K) Gene expression of inflammatory (Nos2, Il6, and Tnfa) and anti-inflammatory (Mrc1 and Arg1) markers following LPS or IL-4 stimulation, respectively, of control or Fcgr3a-overexpressing macrophages (n = 4). (L) Volcano plot showing DEGs in FCGR4+ compared with FCGR macrophages from eWAT following stCR. P values were determined by 2-tailed Student’s t test. Data are shown as the mean ± SEM.
Figure 4
Figure 4. eWAT-derived Fcgr4+ macrophages reduce plaque necrotic core.
(A) Schematic of adipose tissue transplantation experiment (n = 7–12). (B) Presence of FCGR4+ macrophages derived from donor adipose tissue in plaques of recipient mice, determined by flow cytometry (n = 5–6). (C and D) Plaque necrotic core quantification in root sections of eWAT recipients, according to donor’s group treatment, with (E) representative images. Scale bar: 0.25 mm. (F) Experimental design of knockdown of Fcgr4 in eWAT macrophages during stCR (n = 7–10). Flow cytometry analysis after injection of control or Fcgr4 siRNA particles of (G) FCGR4 surface expression in eWAT macrophages and (H) FCGR4+ macrophages as percent of total eWAT macrophages. (I and J) Plaque necrotic core quantification in root sections, with (K) representative images. Scale bar: 0.25 mm. (L) Simple linear regression showing correlation between Fcgr4+ macrophages and necrotic core. P values were determined via (B and H) 2-tailed Student’s t test, (C, D, G, I, and J) 1-way ANOVA with Tukey’s multiple-comparison test, and (L) simple linear regression analysis. Data are shown as the mean ± SEM.
Figure 5
Figure 5. WR reverts Fcgr4+ macrophage levels to obese proportions and accelerates atherosclerosis progression.
(A) Schematic of WR experiment. WR was induced by allowing ad libitum access to HFHC diet after a 2-week weight loss period achieved by stCR. Mice in the PR group were allowed to continue to eat ad libitum after the BL time point. (BG) Rates of change in plaque (B and C) macrophages, (D and E) necrotic core, and (F and G) collagen areas in weight cycling versus non–weight cycling. Data are expressed as (B, D, and F) absolute area and (C, E, and G) change from respective BL (BL for PR and stCR for WR) (n = 11–15). (H) Representative aortic root images. Scale bars: 0.5 mm (top), 0.25 mm (bottom). (I) Flow cytometry analysis of FCGR4+ macrophages in eWAT and plaques (n = 6). (J) Simple linear regression showing correlation between Fcgr4+ macrophages from eWAT and plaques with plaque necrotic core. P values were determined via (BG and J) simple linear regression and (I) 1-way ANOVA with Tukey’s multiple-comparison test. Data are shown as the mean ± SEM.
Figure 6
Figure 6. WR induces long-term pro-atherogenic reprogramming of hematopoietic progenitors.
(A) Frequencies of bone marrow hematopoietic stem and progenitor cells (n = 6–9) and (B) circulating white blood cells (n = 13–17) in weight loss and regain mice (from Figure 5). (C) Cytokines produced by bone marrow cells treated ex vivo with LPS for 16 hours. (D) Schematic of bone marrow transplantation experiment (n = 10–14). (E) Plaque macrophage content expressed as total area and (F) percent of plaque area assessed by CD68 staining in aortic roots after 14 weeks of HFHC diet. (G and H) Plaque necrotic core and (I and J) collagen quantifications in root sections, with (K) representative images. Scale bars: 0.5 mm (top), 0.25 mm (bottom). (L) Cytokines secreted by bone marrow cells isolated from bone marrow recipient mice and treated ex vivo with LPS for 16 hours. P values were determined via (A and B) 2-way ANOVA and (CL) 1-way ANOVA with Tukey’s multiple-comparison test. Data are shown as the mean ± SEM.

References

    1. Khafagy R, Dash S. Obesity and cardiovascular disease: the emerging role of inflammation. Front Cardiovasc Med. 2021;8:768119. doi: 10.3389/fcvm.2021.768119. - DOI - PMC - PubMed
    1. Wang Z, Nakayama T. Inflammation, a link between obesity and cardiovascular disease. Mediators Inflamm. 2010;2010:535918. doi: 10.1155/2010/535918. - DOI - PMC - PubMed
    1. Chait A, den Hartigh LJ. Adipose tissue distribution, inflammation and its metabolic consequences, including diabetes and cardiovascular disease. Front Cardiovasc Med. 2020;7:22. doi: 10.3389/fcvm.2020.00022. - DOI - PMC - PubMed
    1. Nagareddy PR, et al. Adipose tissue macrophages promote myelopoiesis and monocytosis in obesity. Cell Metab. 2014;19(5):821–835. doi: 10.1016/j.cmet.2014.03.029. - DOI - PMC - PubMed
    1. Doumouras AG, et al. Bariatric surgery and cardiovascular outcomes in patients with obesity and cardiovascular disease: a population-based retrospective cohort study. Circulation. 2021;143(15):1468–1480. doi: 10.1161/CIRCULATIONAHA.120.052386. - DOI - PubMed

MeSH terms