. 2025 Aug 7;112(8):1792-1804.
doi: 10.1016/j.ajhg.2025.06.007. Epub 2025 Jul 7.

Exclusion-based exome sequencing in critically ill adults 18-40 years old has a 24% diagnostic rate and finds racial disparities in access to genetic testing

Collaborators, Affiliations

Exclusion-based exome sequencing in critically ill adults 18-40 years old has a 24% diagnostic rate and finds racial disparities in access to genetic testing

Jessica I Gold et al. Am J Hum Genet. .

Abstract

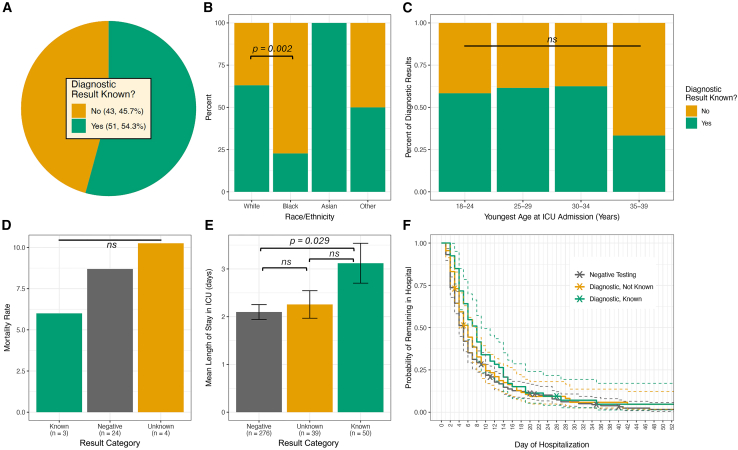
Despite the well-documented benefits of genome sequencing in critically ill pediatric patients, genomic testing is rarely utilized in critically ill adults, and data on its diagnostic yield and clinical implications in this population are lacking. We retrospectively analyzed whole-exome sequencing (WES) data from 365 adults ages 18-40 years with intensive care unit (ICU) admissions at the University of Pennsylvania Health System. For each participant, two medical genetics- and internal medicine-trained clinicians reviewed WES reports and patient charts for variant classification, result interpretation, and identification of genetic diagnoses related to their critical illness. We identified a diagnostic genetic variant in 24.4% of patients, with nearly half of these being unknown to patients and their care teams at the time of ICU admission. Of these genetic diagnoses, 76.6% conferred specific care-altering medical management recommendations. Importantly, diagnostic yield did not decrease with increasing patient age, and patients with undocumented diagnoses trended toward higher mortality rates compared to either patients with known diagnoses or patients with negative exomes. Significant disparities were seen by electronic health record-reported race, with genetic diagnoses known/documented for 63.1% of White patients at the time of ICU admission but only for 22.7% of Black patients. Altogether, the results of this study of broad, exclusion-based genetic testing in the critically ill adult population suggest that the broad implementation of genetic testing in critically ill adults has the potential to improve patient care and dismantle disparities in healthcare delivery.

Keywords: adult genetics; critical illness; disparities; exome; genetics.


Conflict of interest statement

Declaration of interests The authors declare no competing interests.

Figures

None
Graphical abstract
Figure 1
Figure 1
Cohort definition and variant interpretation (A) The overall workflow for cohort definition, report generation, and chart review is shown. Starting with the 43,731 PMBB participants with WES data, WES variant call format (VCF) files for each participant were subjected to quality control (QC), leaving 43,612 samples. We then considered only the subset of individuals who had ever been admitted to any UPHS ICU before the age of 40 years with any International Statistical Classification of Diseases (ICD)-9/10 admission diagnosis code other than those falling under the category of “injury, poisoning, and certain other consequences of external causes” or “external causes of morbidity and mortality,” leaving 365 (0.8% of the total PMBB exome-sequenced population) individuals in our cohort. For each patient, QCed VCF files and EHR-derived HPO phenotype terms were supplied as inputs to Exomiser v.13.2.1 and CLAMMS v.1.3 to generate Exomiser and copy-number variant (CNV) reports, which were subsequently reviewed by two clinical geneticists, each dual-board certified in internal medicine and medical genetics, with concurrent review of the patient chart. (B) The workflow and result of variant identification and interpretation is shown. Of the 365 participants, 146 had one or more suspicious variants identified on either/both the Exomiser or CNV report. We classified the 187 total variants identified by their associated inheritance pattern and by ClinVar classification if available. 143 of these 188 variants (76.5%) were found to affect genes implicated in autosomal dominant (AD) disease, 41 (21.9%) were found to affect genes implicated in autosomal recessive (AR) disease, and three (1.6%) were found to affect genes implicated in X-linked (XL) disease. 109 (58.0%) variants had previously been annotated in ClinVar as pathogenic or likely pathogenic (P/LP), 27 (14.4%) as variants of uncertain significance (VUSs), and 48 (25.5%) had not been previously annotated in ClinVar (NA). For all variants not annotated in ClinVar as P/LP, we classified variants using the American College of Medical Genetics and Genomics (ACMG) guidelines for clinical sequence interpretation. We reclassified six of the 27 VUSs (22.2%) as P/LP. We classified 20 of the 48 variants lacking ClinVar annotations (41.7%) as P/LP, while the remaining 28 (58.3%) were classified as VUSs. The resulting variants were subsequently classified as either diagnostic, incidental, or VUS, as described in the subjects, material, and methods section.
Figure 2
Figure 2
Demographics of the study cohort Overall demographics of the 365 participants included in our study. (A) The percentage of the study population falling into each of four age groups at the time of earliest ICU admission. 48 patients (13.2%) were aged 18–25 years, 92 (25.2%) were aged 25–29, 116 (31.8%) were aged 30–34, and 109 (29.9%) were aged 35–40 at the time of first ICU admission. (B) The percentage of participants by EHR-reported patient sex is shown. 200 patients (54.8%) identified as female and 165 (45.2%) identified as male. (C) The percentage of participants by EHR-reported race and ethnicity is shown; the percentages of participants in each category are calculated separately for race and ethnicity. 232 participants (63.6%) identified as White, 103 (28.2%) as Black, eight (2.2%) as Asian, and 22 (6.0%) as other race. 343 (94.0%) participants identified as non-Hispanic/Latino and 22 (6.0%) identified as Hispanic or Latino. (D) The percentage of participants by patient status (deceased or alive) at the time of chart review is shown. 31 patients (8.5%) had died during or after their hospital admission. (E) The percentage of participants by reason for ICU admission, broadly divided into 15 indication groups, is shown. The most common diagnostic categories for ICU admission were cardiac indications (n = 76, 20.8%), cancer-related indications (n = 71, 19.5%), neurologic-related indications (n = 46, 12.6%), vascular indications (n = 44, 12.1%), and infectious indications (n = 24, 6.6%).
Figure 3
Figure 3
Results of WES in critically ill adults age 18–40 years (A) Overall diagnostic rate of exome sequencing in the complete cohort of 365 participants, along with the rate of VUS identification and incidental diagnosis identification, is shown. In this figure, each participant is counted only once, only for the highest order finding discovered on exome sequencing, with diagnostic results being evaluated first, VUSs second, and incidental findings last. Green bars indicate the proportion within each diagnostic category of results identified in genes with clearly defined management recommendations in GeneReviews. (B) Overall diagnostic rate of exome sequencing as in (A) but stratified by EHR-reported race. No significant differences in the rate of diagnostic or VUS findings were observed between any racial group by logistic regression (p = 0.57, odds ratio [OR]: 1.38 [0.48–5.02]). (C) Overall diagnostic rate of exome sequencing as in (A) but stratified by patient age at first ICU admission. No significant correlation was found between patient age and diagnostic rate or VUS rate by logistic regression (p = 0.56, OR: 0.99 [0.95–1.03]). (D) Percentage of patients that would gain a new genetic variant/diagnosis not already documented in the EHR, stratified by diagnostic category, across all 365 patients included in the study. Green bars indicate the proportion within each diagnostic category that would specifically gain a variant/diagnosis in a gene with clearly defined management recommendations in GeneReviews. (E) Overall diagnostic rate of exome sequencing as in (A) but stratified by reason for ICU admission as in Figure 2E. (A–E) Results of statistical testing are shown if performed; ns, not significant.
Figure 4
Figure 4
Racial disparities in documentation of genetic diagnoses and implications for clinical outcomes (A) The percentage of all 94 diagnostic results identified on exome sequencing that were known and documented in patient charts prior to ICU admission is shown. (B) Percentage of diagnostic exome results known and documented as in (A) but stratified by EHR-recorded race. Black patients are significantly less likely to have a documented genetic diagnosis compared to White patients by logistic regression (p = 0.002, OR: 0.17 [0.05–0.50]). (C) Percentage of diagnostic exome results known and documented as in (A) but stratified by patient age. No significant correlation was found between patient age and documentation of genetic diagnosis by logistic regression (p = 0.23, OR: 0.95 [0.87–1.03]). (D) Mortality rate for all 365 patients included in our study stratified by result of exome sequencing (diagnostic vs. negative) and by documentation of results in the patient chart. Patients with documented diagnostic results were less likely to die compared to patients with negative exome results, who were less likely to die compared to patients with undocumented diagnostic results, although these differences were not statistically significant by logistic regression (known vs. negative, p = 0.82, OR: 1.28 [0.22–24.11]; known vs. unknown, p = 0.86, OR: 1.29 [0.05–33.32]). (E) Mean ICU length of stay for each patient included in the study, stratified as in (D). Patients in the “known” diagnosis group had significantly longer lengths of stay in the ICU compared to the "negative" group by ANOVA (Tukey post hoc p = 0.029, mean difference of 1.01 [0.08–1.94]). Error bars represent mean ± standard error. (F) Kaplan-Meier curve illustrating the likelihood of remaining in the hospital by day of hospitalization, stratified by the same three groups as in (D). There were no significant differences between the three groups by log rank test (p = 0.17). Solid lines represent survival estimates for each group, and dashed lines indicate 95% confidence intervals. (A–F) Results of statistical testing are shown if performed; ns, not significant.
Figure 5
Figure 5
Distribution of genes identified by exome sequencing across different result categories (A) Proportion of exome sequencing results colored by the diagnostic category of the involved gene. Results are stratified by diagnostic, VUS, and incidental results. (B) Occurrences of genes implicated in diagnostic findings. Genes identified only once within this dataset are collectively labeled as “genes appearing only once.” The remaining genes, which appear two or more times across all diagnostic results, are displayed. Color coding corresponds to the categories defined in (A). (C) Occurrences of genes implicated in incidental findings. Genes identified only once within this dataset are collectively labeled as “genes appearing only once.” The remaining genes, which appear two or more times across all incidental results, are displayed. Color coding corresponds to the categories defined in (A). (D) Percentage of genes identified as incidental findings in our study contained in the ACMG “Recommendations for Reporting of Secondary Findings in Clinical Exome and Genome Sequencing” list.

References

    1. Biesecker L.G., Green R.C. Diagnostic clinical genome and exome sequencing. N. Engl. J. Med. 2014;370:2418–2425. doi: 10.1056/NEJMra1312543. - DOI - PubMed
    1. Krantz I.D., Medne L., Weatherly J.M., Wild K.T., Biswas S., Devkota B., Hartman T., Brunelli L., Fishler K.P., et al. NICUSeq Study Group Effect of Whole-Genome Sequencing on the Clinical Management of Acutely Ill Infants With Suspected Genetic Disease: A Randomized Clinical Trial. JAMA Pediatr. 2021;175:1218–1226. doi: 10.1001/jamapediatrics.2021.3496. - DOI - PMC - PubMed
    1. Dimmock D., Caylor S., Waldman B., Benson W., Ashburner C., Carmichael J.L., Carroll J., Cham E., Chowdhury S., Cleary J., et al. Project Baby Bear: Rapid precision care incorporating rWGS in 5 California children’s hospitals demonstrates improved clinical outcomes and reduced costs of care. Am. J. Hum. Genet. 2021;108:1231–1238. doi: 10.1016/j.ajhg.2021.05.008. - DOI - PMC - PubMed
    1. Olde Keizer R.A.C.M., Marouane A., Kerstjens-Frederikse W.S., Deden A.C., Lichtenbelt K.D., Jonckers T., Vervoorn M., Vreeburg M., Henneman L., de Vries L.S., et al. Rapid exome sequencing as a first-tier test in neonates with suspected genetic disorder: results of a prospective multicenter clinical utility study in the Netherlands. Eur. J. Pediatr. 2023;182:2683–2692. doi: 10.1007/s00431-023-04909-1. - DOI - PMC - PubMed
    1. Lunke S., Eggers S., Wilson M., Patel C., Barnett C.P., Pinner J., Sandaradura S.A., Buckley M.F., Krzesinski E.I., et al. Australian Genomics Health Alliance Acute Care Flagship Feasibility of Ultra-Rapid Exome Sequencing in Critically Ill Infants and Children With Suspected Monogenic Conditions in the Australian Public Health Care System. JAMA. 2020;323:2503–2511. doi: 10.1001/jama.2020.7671. - DOI - PMC - PubMed

LinkOut - more resources