. 2025 Jul;292(2050):20250970.
doi: 10.1098/rspb.2025.0970. Epub 2025 Jul 9.

Species' traits modulate rapid changes in flight time in high-Arctic muscid flies under climate change

Affiliations

Species' traits modulate rapid changes in flight time in high-Arctic muscid flies under climate change

Hannah Sørine Gerlich et al. Proc Biol Sci. 2025 Jul.

Abstract

Insects are experiencing notable phenological shifts owing to climate change, with substantial interspecific variability. However, our understanding is limited by a shortage of long-term studies, beyond Lepidoptera. This study presents a hierarchical modelling framework to analyse the phenological distribution of 11 muscid fly species across three vegetation types over 18 years (1996-2014) in Zackenberg, Northeast Greenland. We examined species-specific changes in phenology and assessed ecological traits for explaining interspecific variation. Additionally, we investigated the associations between phenological shifts and timing of snowmelt and temperature. We found consistent trends of earlier flight activity and interspecific variation in responses, with smaller species shifting their end-of-the-season activity at faster rates than larger species. Flight activity was strongly associated with the timing of snowmelt, while warming was linked to an earlier end-of-the-season activity. Late-active species exhibited more pronounced shifts in response to climate variations than early-active species. This study highlights that the species-specific climate sensitivity of high-Arctic muscid flies potentially has demographic effects if temporal overlap among interacting species changes. We advocate for prioritizing species-specific insect population studies, ideally analysed within the context of interacting species, to understand better and address disparities in responses to climate change.

Keywords: Arctic; climate change; insects; long-term monitoring; phenology; species traits.


Conflict of interest statement

We declare we have no competing interests.

Figures

Temporal trends (1996 - 2014) in (A) onset, (B) peak and (C) end of the flight activity of muscid species across three vegetation types
Figure 1.
Temporal trends (1996–2014) in (A) onset, (B) peak and (C) end of the flight activity of muscid species across three vegetation types (wet fen, arid heath and mesic heath) at Zackenberg, NE Greenland. Error bars represent credibility intervals at the 95% level.
Temporal phenological shifts (days/decade) in onset, peak, end of flight activity for muscid fly species based on (a-c) body size
Figure 2.
Temporal phenological shifts (days/decade) in onset, peak, end of flight activity for muscid fly species based on (A–B) body size (wing length, mm), (D–F) anthophilous behaviour and (G–I) phenological niche (average annual flight activity across all years). Positive values represent delayed phenology, negative values earlier phenology. Border colour indicates confidence level: light grey (95%), dark grey (90%) and black borders (non-significant). Species with <5 years of data (Spilogona deflorata, D. groenlandica in mesic heath, S. dorsata in arid heath) were excluded due to insufficient data. A significant positive trend in end of the flight season shifts with body size suggests smaller species advanced their flight season at greater rates than larger species over the 18 year study period.
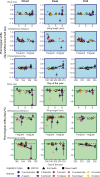
Phenological shifts in response to timing of snowmelt (blue panels) and air temperature 30 days prior to a mean phenological event minus 1 s.d. (green panels)
Figure 3.
Phenological shifts in response to timing of snowmelt (blue panels) and air temperature 30 days prior to a mean phenological event minus 1 s.d. (green panels). Columns show onset, peak and end of flight activity across gradients of body size (wing length, mm), anthophilous behaviour and phenological niche (average annual flight activity across all years). Border colour indicates confidence level: light grey (95%), dark grey (90%) and black borders (non-significant). A strong trend was observed between phenological shifts and phenological niche (indicated by regression line).

References

    1. Walther GR, Post E, Convey P, Menzel A, Parmesan C, Beebee TJC, Fromentin JM, Hoegh-Guldberg O, Bairlein F. 2002. Ecological responses to recent climate change. Nature. 416, 389–395. ( 10.1038/416389a) - DOI - PubMed
    1. Visser ME, Both C. 2005. Shifts in phenology due to global climate change: the need for a yardstick. Proc. R Soc. B 272, 2561–2569. ( 10.1098/rspb.2005.3356) - DOI - PMC - PubMed
    1. Cohen JM, Lajeunesse MJ, Rohr JR. 2018. A global synthesis of animal phenological responses to climate change. Nat. Clim. Chang. 8, 224–228. ( 10.1038/s41558-018-0067-3) - DOI
    1. Thackeray SJ, et al. 2016. Phenological sensitivity to climate across taxa and trophic levels. Nature. 535, 241–245. ( 10.1038/nature18608) - DOI - PubMed
    1. Gallinat AS, Primack RB, Wagner DL. 2015. Autumn, the neglected season in climate change research. Trends Ecol. Evol. 30, 169–176. ( 10.1016/j.tree.2015.01.004) - DOI - PubMed

Grants and funding

LinkOut - more resources