. 2025 Jul 9;10(1):217.
doi: 10.1038/s41392-025-02298-5.

A novel peptide 66CTG stabilizes Myc proto-oncogene protein to promote triple-negative breast cancer growth

Affiliations

A novel peptide 66CTG stabilizes Myc proto-oncogene protein to promote triple-negative breast cancer growth

Huichun Liang et al. Signal Transduct Target Ther. .

Abstract

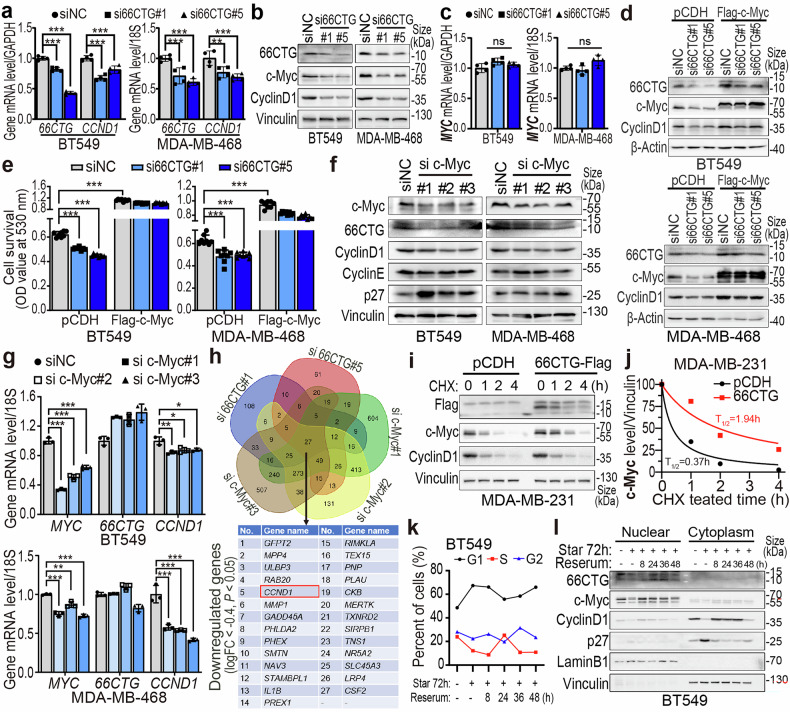
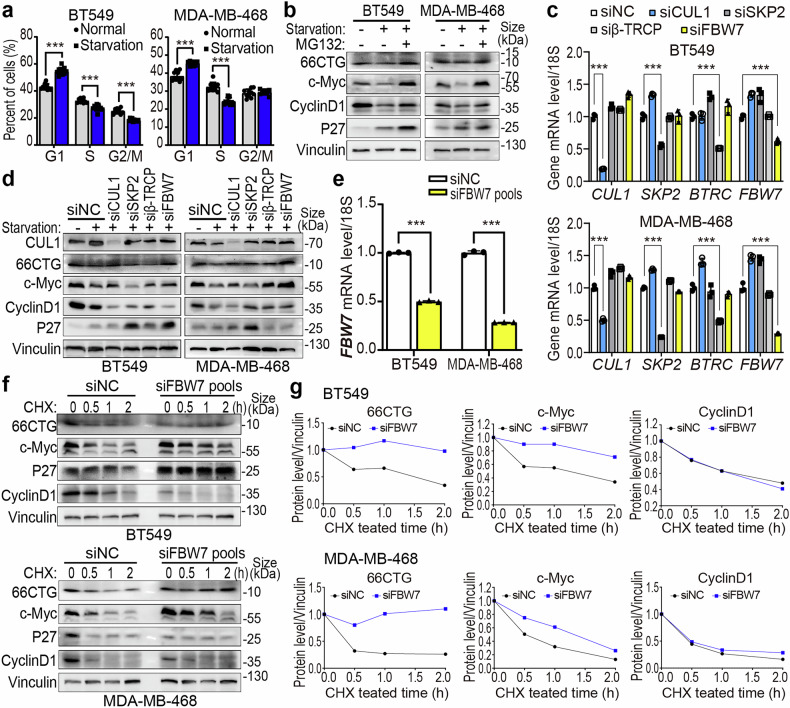
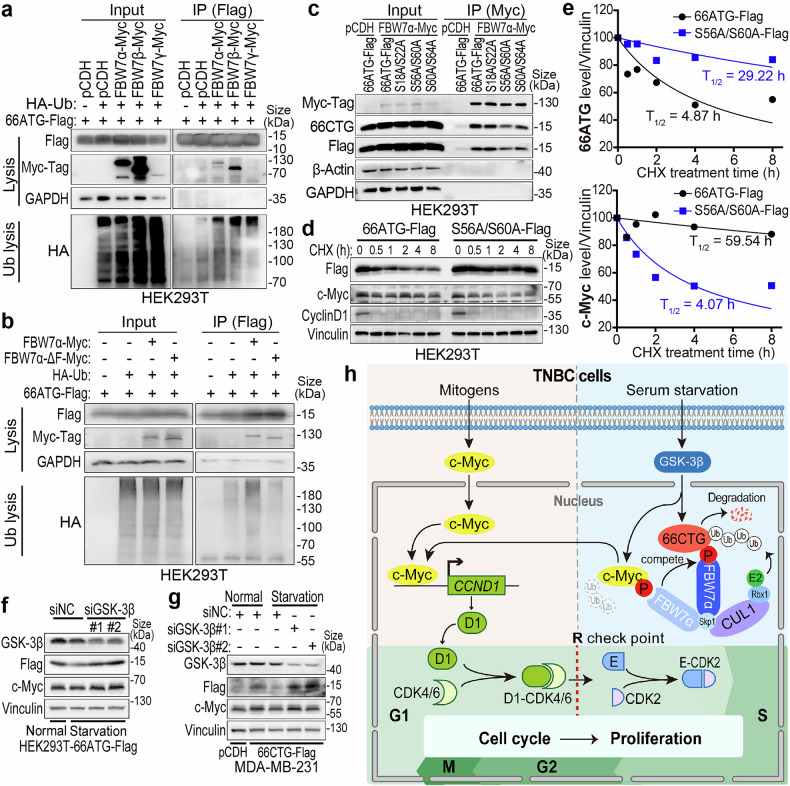
Triple-negative breast cancer (TNBC) is the most malignant subtype of breast cancer that lacks reliable targets for diagnosis and therapy. Non-coding RNA (ncRNA)-encoded products hold promise for addressing this unmet need. By analyzing the reported ribosomal RNA sequencing data, combined with the TCGA, ORFfinder, SmProt databases, we identified CDKN2B-AS1, a TNBC-upregulated lncRNA encoding a 66-amino-acid peptide via CUG-initiated translation. CRISPR-Cas9 gene editing and mass spectrometry confirmed endogenous expression of this peptide, designated 66CTG, in TNBC cells. Functionally independently of its host RNA, 66CTG promoted the proliferation of TNBC cells and the tumor growth of TNBC xenograft by stabilizing c-Myc protein and enhancing Cyclin D1 transcription. Immunohistochemistry of 89 clinical TNBC paraffin samples revealed positive correlations among 66CTG, c-Myc, and Cyclin D1 expression levels. Mechanistically, co-immunoprecipitation and ubiquitination assays revealed that 66CTG stabilized c-Myc by competitively interacting with FBW7α, an E3 ligase responsible for recognizing 66CTG CPDS56/S60 motif which phosphorylated by GSK-3β during the late G1 phase. In conclusion, our findings suggest 66CTG has potential to be developed as a target for TNBC diagnosis and therapy. Furthermore, it unveils a regulatory axis wherein 66CTG stabilizes c-Myc by interacting with FBW7α, offering a new mechanistic explanation for c-Myc overexpression in TNBC. Patients co-overexpressing 66CTG, c-Myc, and Cyclin D1 may benefit from therapies targeting this axis.


Conflict of interest statement

Competing interests: The authors declare no competing interests.

Figures

Fig. 1
Fig. 1
66CTG encoded by CDKN2B-AS1 promotes TNBC cell proliferation. a CDKN2B-AS1 expression levels in non-TNBC (n = 578) and TNBC (n = 87) clinical samples from the TCGA database were analyzed using bc-GenExMiner v5.0. b Illustration of the screen process of ORF1 obtained from ORFfinder and SmProt, as well as the localization of ORF1 on CDKN2B-AS1. c Overexpression of 66CTG-3×Flag was detected in MDA-MB-231 cells via Western blotting. d SRB assays assessed the effect of 66CTG-3×Flag overexpression on the proliferation of MDA-MB-231 cells (n = 10). Error bars show the mean ± SD, ***P < 0.001 by two-way ANOVA. e The images of the colony formation of MDA-MB-231 cells with 66CTG-3×Flag overexpression. f Statistical results of colony formation assay of (e) (n = 3). Error bars show the mean ± SD, **P < 0.01 by two-tailed Student’s t-test. g Schematic representation of the insertion of a 3xHA tag sequence at the C-terminus of the 66CTG gene via CRISPR-Cas9-mediated homologous recombination. h WB was employed to detect HA expression, which was knocked in at the C-terminus of 66CTG in the HEK293T clonal cell line using CRISPR-Cas9. The anti-HA-tag antibodies used in this experiment included anti-HA-tag (Abclonal, Cat#AE008), anti-HA-tag (Affinity Biosciences, Cat#T0008). i Schematic representation of the insertion of a 3xHA tag sequence at the N-terminus of the 66CTG gene via homologous recombination using CRISPR-Cas9, along with the mutation of the start codon from CTG to CCG. j Western blotting was employed to detect the expression of HA, which was inserted at the N-terminal of 66CTG, along with the mutation from CTG to CCG via CRISPR-Cas9 in BT549 clonal cell lines. The anti-HA-tag antibody used in this experiment was obtained from Abways (Cat#AB0004). k Cell morphology images were obtained for BT549 parental and the two clonal cell lines: BT549-N-3×HA-66CTG#24 and BT549-N-3×HA-66CCG#15. l The SRB assay assessed the proliferation of BT549-parental, BT549-N-3×HA-66CTG#24 and BT549-N-3×HA-66CCG#15 (n = 12). Error bars show the mean ± SD, **P < 0.01, ***P < 0.001 compared to BT549-N-3×HA-66CCG#15, and ###P < 0.001 compared to each other by two-way ANOVA. m The images of the colony formation of BT549-parental, BT549-N-3×HA-66CTG#24 and BT549-N-3×HA-66CCG#15. n Statistical results of colony formation assay of (m) (n = 6). Error bars show the mean ± SD, **P < 0.01, ***P < 0.001 by two-tailed Student’s t-test. o Mass spectrometry analysis of endogenous 66CTG expression in BT549 cells
Fig. 2
Fig. 2
66CTG promotes TNBC cell proliferation by upregulating Cyclin D1. a qPCR detects the knockdown of 66CTG in BT549 (n = 3) and MDA-MB-468 (n = 4) cell lines. Error bars show the mean ± SD, “ns” means no significant, ***P < 0.001 by two-way ANOVA followed by Dunnett’s tests. b Using SRB assays to detect the proliferation of BT549 and MDA-MB-468 cells when 66CTG is knocked down (n = 10). Error bars show the mean ± SD, ***P < 0.001 by one-way ANOVA followed by Dunnett’s tests. c Statistical results of cell cycle of BT549 (n = 9) and MDA-MB-468 (n = 6) when 66CTG is knocked down. Error bars show the mean ± SD, *P < 0.05, **P < 0.01, ***P < 0.001 by two-way ANOVA followed by Dunnett’s tests. d WB analysis of G1 phase-related regulatory proteins in BT549 and MDA-MB-468 cells with 66CTG knocking down. e WB analysis of Cyclin D1 in MDA-MB-231 and HCC1806 cells with 66CTG-3×Flag overexpressing, followed by serum starvation for 36 h. The red arrow and “oe” indicate the position of 66CTG-3×Flag, and the blue arrow and “en” indicate the endogenous 66CTG. f Statistical results of cell cycle of MDA-MB-231 and HCC1806 cells with 66CTG-3×Flag overexpression followed by serum starvation for 36 h (n = 4). Error bars show the mean ± SD, *P < 0.05, ***P < 0.001 by two-way ANOVA followed by Dunnett’s tests
Fig. 3
Fig. 3
66CTG upregulates Cyclin D1 by stabilizing the protein level of c-Myc. a qPCR detection of transcription levels of 66CTG and Cyclin D1 in BT549 and MDA-MB-468 cells with 66CTG knocking down (n = 4). Error bars show the mean ± SD, **P < 0.01, ***P < 0.001 by two-way ANOVA followed by Dunnett’s tests. b WB analysis of c-Myc and Cyclin D1 in BT549 and MDA-MB-468 cells with 66CTG knocking down. c qPCR detection of transcription level of c-Myc in BT549 and MDA-MB-468 cells with 66CTG knocking down (n = 4). Error bars show the mean ± SD, “ns” means no significant by two-way ANOVA followed by Dunnett’s tests. d WB analysis of Cyclin D1 in BT549 and MDA-MB-468 cells with 3×Flag-c-Myc overexpression, followed by 66CTG knocking down. e Using SRB assays to detect the proliferation of BT549 and MDA-MB-468 cells with 3×Flag-c-Myc overexpressing followed by 66CTG knocking down (n = 8). Error bars show the mean ± SD, ***P < 0.001 by one-way ANOVA followed by Dunnett’s tests. f WB analysis of 66CTG and Cyclin D1 in BT549 and MDA-MB-468 cells with c-Myc knocking down. g qPCR detection of transcription level of c-Myc, 66CTG, and Cyclin D1 in BT549 and MDA-MB-468 cells with c-Myc knocking down (n = 3). Error bars show the mean ± SD, *P < 0.05, **P < 0.01, ***P < 0.001 by two-way ANOVA followed by Dunnett’s tests. h Downregulated genes were identified by RNA sequencing in BT549 cells of 66CTG or c-Myc knockdown, in which 27 co-downregulated genes were showed (logFC < −0.4, and P < 0.05). The venn diagram was generated by Draw Venn Diagram. i WB analysis of c-Myc protein expression levels in MDA-MB-231 cells after overexpressing 66CTG-3×Flag and subsequent treatment with CHX (50 μg/ml) for 0, 1, 2, 4 h. j The grayscale values of c-Myc protein levels and the fitting results of the half-life curve of (i). k Cell cycle analysis of BT549 cells subjected to serum starvation for 72 h, followed by reserum treatment for 8, 24, 36, and 48 h. “Star” means starvation. l After subjecting BT549 cells to serum starvation for 72 h, followed by reserum treatment for 8, 24, 36, and 48 h, the distribution and expression of 66CTG, c-Myc, and Cyclin D1 proteins in the nucleus and cytoplasm were analyzed using Western blotting. “Star” means serum starvation
Fig. 4
Fig. 4
66CTG promotes TNBC tumor growth by upregulating the c-Myc/Cyclin D1 axis. a In vivo images of the orthotopic breast tumor model in nude mice established using MDA-MB-231-Luc-pCDH, MDA-MB-231-Luc-66CTG-3×Flag, and MDA-MB-231-Luc-66ATG-3×Flag cells. The original images could be found in Supplementary Dataset 9. b Statistical results of tumor luminescence radiance (n = 10). Error bars show the mean ± SD, *P < 0.05, **P < 0.01 by one-way ANOVA followed by Dunnett’s tests. c Statistical analysis of grayscale values for c-Myc and Cyclin D1 protein levels in (Supplementary Fig. 4e) (n = 10). Error bars show the mean ± SD, “ns” means no significant, **P < 0.01, ***P < 0.001 by two-way ANOVA followed by Dunnett’s tests. (d) Image of MDA-MB-468 xenograft with stable 66CTG knockdown. e Tumor weight of MDA-MB-468 xenograft with stable 66CTG knockdown (n = 12). Error bars show the mean ± SD, ***P < 0.001 by one-way ANOVA followed by Dunnett’s tests. f Statistical results of tumor volumes in MDA-MB-468 xenografts with 66CTG knockdown measured at different time points (n = 12). Error bars show the mean ± SD, **P < 0.01, ***P < 0.001 by two-way ANOVA followed by Dunnett’s tests. g Images of 66CTG, c-Myc, and Cyclin D1 expression in clinical TNBC paraffin-embedded continuous slicing samples using IHC. Scale bar: 200 μm. The original images could be found in Supplementary Dataset 10. h Pathological scoring results of 66CTG, c-Myc, and Cyclin D1 in 89 clinical TNBC paraffin samples. i Pearson correlation analysis of the expression levels of 66CTG, c-Myc, and Cyclin D1 in 89 clinical TNBC paraffin samples
Fig. 5
Fig. 5
FBW7 mediates the degradation of c-Myc and 66CTG. a Statistical results of cell cycle of BT549 and MDA-MB-468 cells with serum starvation for 36 h (n = 10). Error bars show the mean ± SD, ***P < 0.001 by two-way ANOVA followed by Dunnett’s tests. b WB analysis of 66CTG and c-Myc in BT549 and MDA-MB-468 cells with serum starvation for 36 h, followed by treatment with MG132 (20 μM) for 6 h. c qPCR detection of the knockdown of CUL1, SKP2, β-TRCP, and FBW7 in BT549 and MDA-MB-468 cells (n = 3). Error bars show the mean ± SD, ***P < 0.001 by two-way ANOVA followed by Dunnett’s tests. d WB analysis of 66CTG and c-Myc in BT549 and MDA-MB-468 cells with knockdown of CUL1, SKP2, β-TRCP, and FBW7 followed by serum starvation for 36 h. e qPCR detection of the knockdown of FBW7 by using siRNA pools (siFBW7#1 and siFBW7#2) in BT549 and MDA-MB-468 cells (n = 3). Error bars show the mean ± SD, ***P < 0.001 by two-tailed Student’s t-test. f WB analysis of the protein expression levels of 66CTG, c-Myc, and Cyclin D1 in BT549 and MDA-MB-468 cells with FBW7 knockdown, followed by treatment with CHX (50 μg/ml) for 0, 0.5, 1, 2 h. g The grayscale values of 66CTG, c-Myc, and Cyclin D1 protein levels and the protein degradation half-life curve of (f)
Fig. 6
Fig. 6
66CTG stabilizes c-Myc via interacting with FBW7α. a WB analysis of 66CTG in HEK293T-66ATG-3×Flag cells transfected with pCDH-FBW7α-Myc(tag), pCDH-FBW7β-Myc(tag), and pCDH-FBW7γ-Myc(tag) at serial doses of 0, 200, 400, and 800 ng. b WB analysis of c-Myc in HEK293T-3×Flag-c-Myc cells transfected with pCDH-FBW7α-Myc(tag), pCDH-FBW7β-Myc(tag), and pCDH-FBW7γ-Myc(tag) at serial doses of 0, 200, 400, and 800 ng. c IP and WB analyses of the interaction between 66CTG and three isoforms of FBW7 in HEK293T cells under MG132 (20 μM) treatment for 6 h. d IP and WB analyses of the interaction between c-Myc and three isoforms of FBW7 in HEK293T cells treated with MG132 (20 μM) for 6 h. e After the nuclear-cytoplasmic fractionation assay, the distribution of c-Myc and 66CTG protein in the nucleus and cytoplasm was analyzed using Western blot. “WCL” means whole cell lysate. f WB analysis of c-Myc expression levels in HEK293T-c-Myc (no tag) cells transfected with pCDH-FBW7α-Myc(tag) and varying doses of pCDH-66ATG-3×Flag (0, 100, 200, 400, and 800 ng). g IP and WB analyses of the interaction between c-Myc (notag) and FBW7α-Myc in HEK293T cells with or without 66CTG-3×Flag overexpression, treated with MG132 (20 μM) for 6 h. h IP and WB analyses of the interaction between 66CTG-3×Flag and FBW7α-Myc in HEK293T cells with or without c-Myc (notag) overexpression, treated with MG132 (20 μM) for 6 h. i IP and WB analyses of the ubiquitination level of c-Myc mediated by FBW7α in HEK293T-3×Flag-c-Myc cells with or without 66CTG overexpression
Fig. 7
Fig. 7
FBW7α mediates the ubiquitination and degradation of 66CTG through recognizing its CPDS56/S60 motif. a IP and WB analyses of the ubiquitination level of 66ATG-3×Flag mediated by three isoforms of FBW7 in HEK293T cells treated with MG132 (20 μM) for 6 h. b IP and WB analyses of the ubiquitination level of 66ATG-3×Flag mediated by FBW7α and FBW7α-ΔF-box in HEK293T cells treated with MG132 (20 μM) for 6 h. c IP and WB analyses of the interaction between FBW7α and 66CTG in HEK293T cells co-transfected with pCDH-FBW7α-Myc(tag) and pCDH-66ATG-3×Flag or its three CPD motif mutants. d WB analysis of 66CTG and c-Myc protein levels in HEK293T cells transfected with pCDH-66ATG-3×Flag or pCDH-66ATGS56A/S60A-3×Flag, followed by treatment with CHX (50 μg/ml) for 0, 0.5, 1, 2, 4, 8 h. e The grayscale values of 66CTG and c-Myc protein levels and the fitting results of the half-life curve of (d). f WB analysis of 66CTG and c-Myc protein levels in HEK293T-66ATG-3×Flag cells transfected with GSK-3β siRNAs, followed by serum starvation for 36 h. g WB analysis of 66CTG and c-Myc protein levels in MDA-MB-231-66CTG-3×Flag cells transfected with GSK-3β siRNAs, followed by serum starvation for 36 h. h The working model of this study was drawn by ourselves using Adobe Illustrator CS6. 66CTG stabilizes c-Myc by competitively interacting with FBW7α, thereby promoting the proliferation of TNBC cells. “D1” means Cyclin D1, and “E” means Cyclin E

References

    1. Allison, K. H. et al. Estrogen and progesterone receptor testing in breast cancer: ASCO/CAP guideline update. J. Clin. Oncol.38, 1346–1366 (2020). - PubMed
    1. Wolff, A. C. et al. Human epidermal growth factor receptor 2 testing in breast cancer: ASCO-College of American Pathologists guideline update. J. Clin. Oncol.41, 3867–3872 (2023). - PubMed
    1. Guo, L. et al. Breast cancer heterogeneity and its implication in personalized precision therapy. Exp. Hematol. Oncol.12, 3 (2023). - PMC - PubMed
    1. Foulkes, W. D., Smith, I. E. & Reis-Filho, J. S. Triple-negative breast cancer. N. Engl. J. Med.363, 1938–1948 (2010). - PubMed
    1. Burstein, H. J. et al. Customizing local and systemic therapies for women with early breast cancer: the St. Gallen International Consensus Guidelines for treatment of early breast cancer 2021. Ann. Oncol.32, 1216–1235 (2021). - PMC - PubMed

MeSH terms

LinkOut - more resources