. 2025 Jul 8;16(1):6299.
doi: 10.1038/s41467-025-61297-w.

The PARP inhibitor talazoparib synergizes with reovirus to induce cancer killing and tumour control in vivo in mouse models

Affiliations

The PARP inhibitor talazoparib synergizes with reovirus to induce cancer killing and tumour control in vivo in mouse models

Joan Kyula-Currie et al. Nat Commun. .

Abstract

Reovirus type 3 Dearing (RT3D) is an oncolytic, double-stranded RNA virus. To identify potential RT3D drug-viral sensitizer, here we use a high-throughput screen of therapeutic agents and find a PARP-1 inhibitor, talazoparib, as a top hit. RT3D interacts with retinoic acid-induced gene-1 (RIG-I) and activates PARP-1, with consequent PARylation of components of the extrinsic apoptosis pathway. Pharmacological or genetic inhibition of PARP-1 abrogates this PARylation and enhances extrinsic apoptosis, NF-kB signalling and pro-inflammatory cell death. Interaction between PARP-1 and RIG-I induced by treating RT3D-infected cells with talazoparib activates downstream IFN-β and TNF/TRAIL production to amplify the therapeutic effect through positive feedback. Furthermore, the effect of RT3D-talazoparib combination is phenocopied by non-viral ds-RNA therapy and RIG-I agonism. In vivo, mouse tumour model results show that RT3D/talazoparib combination regimen induces complete control of inoculated tumour as well as protection from subsequent tumour rechallenge with the, with accompanied innate and adaptive immune activation.


Conflict of interest statement

Competing interests: The authors declare no competing interests.

Figures
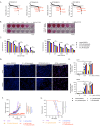
Fig. 1
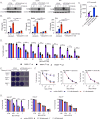
Fig. 1. RT3D combination with talazoparib exerts a synergistic effect.
A Results from a high-throughput screen experimental set up in the A375 melanoma cell line showing the RT3D multiplicity of infection [MOI] (ranging from 0.10 to 5) and a range of different drug inhibitors [ranging from 0.0005 ⌠M-1 ⌠M]. Cells were analysed 72 h post-infection using the Cell Titer Glo (CTG) Assay. The z score (DE effect z score = virus effect z score) is plotted on the Interestingly, although axis and was obtained from the standardised value from (i) the median of triplicate samples normalised to virus only versus untreated (ii) the mean of virus only versus untreated and (iii) the median absolute deviation between (i) and (ii) - also known as Z-MAD. The z score plots are shown for talazoparib in the presence of RT3D at MOI of 0.1, 0.5, 1 and 5 (highlighted in red dots) as displayed in the waterfall plots. B Cell survival was measured using the SRB assays following treatment with 0.05 ⌠M of talazoparib and increasing doses of RT3D [0.01, 0.1, 0.25, 0.5 and 1] at 72 h post-infection. C A375 and MeWo cells were treated with increasing doses of talazoparib [0.005 ⌠M, 0.05 ⌠M or 0.5 ⌠M] and thereafter infected with increasing doses of RT3D [MOI of 0.1, 0.25, 0.5 and 1]. Cell survival was assessed by MTT at 72 h post-infection. Data presented are mean values ± SD, n = 3 biologically independent experiments. P values were determined by two-way ANOVA corrected for multiple comparisons. D A cell death assay was used to measure the uptake of propidium iodide (PI) following RT3D [MOI of 0.1] and talazoparib (0.1 ⌠M) treatment at 48 h post-infection in A375 and MeWo cells. Representative pictures of cell death assay where dead cells are shown for PI uptake (red) and nuclear staining by Hoechst (blue). E Propidium iodide (PI) uptake following RT3D [MOI of 0.01 and 0.1] and talazoparib (0.01 ⌠M, 0.1 ⌠M or 1 ⌠M) treatment at 48 h. Data presented are mean values ± SD, n = 3 biologically independent experiments. P values were determined by two-way ANOVA corrected for multiple comparisons. F CD1 nude mice carrying A375 tumour xenografts were treated with oral administration of vehicle (10% DMAc, 6% Solutol and 84% PBS) or 0.1 mg/kg talazoparib from Day 1–5. RT3D was injected intratumorally on Day 3 at 1 × 106 pfu, or sham injection (PBS). Sizes of tumours were measured for each treatment cohort. Data presented are mean values ± SEM and p values were determined by one-way ANOVA corrected for multiple comparisons. G Kaplan–Meier curve was evaluated for each treatment group to assess the median survival rate. There was significant prolongation of survival in the combination of RT3D and talazoparib compared to either agent alone (***p = 0.0003 using a Log rank [Mantel.Cox] test). For (F and G), vehicle n = 10, RT3D n = 10, talazoparib n = 10 and combination n = 10 animals per group. P values were derived where * = p value, **= p value < 0.01 and *** = p value < 0.001. Source data are provided as a source data file.
Fig. 2
Fig. 2. RT3D-induced PARylation is inhibited by talazoparib.
A A375, MeWo and D04 melanoma cells were pre-treated with 0.1 ⌠M talazoparib and thereafter infected with RT3D [MOI of 0.1 and 1]. Cells were harvested, and the lysates collected at 48 h post-infection. Poly ADP ribosylation (PAR) was assessed by immunoblotting. B PAR was also assessed by ELISA. Data presented are mean values ± SD, n = 2 biologically independent experiments. P values were determined by two-way ANOVA corrected for multiple comparisons. C CD1 nude mice bearing A375 tumour xenografts were treated with oral administration of vehicle (10% DMAc, 6% Solutol and 84% PBS) or 0.1 mg/kg talazoparib from Day 1–5. RT3D was injected intratumorally on Day 3 at 1 × 106 pfu, or vehicle (10% DMAc, 6% Solutol and 84% PBS). Following the last treatment on day 5, tumours were harvested and assessed for PAR by ELISA. Data presented are mean values ± SD, n = 2 mice. P values were determined by one-way ANOVA corrected for multiple comparisons. D RT3D sensitivity was assessed in HeLa PARP-1 paired cells: PARP-1+/+ (wild type) and PARP-1−/− (clones G3 and G9), where cytotoxicity was measured by MTT assay 72 h post-infection. Data presented are mean values ± SD, n = 2 biologically independent experiments. P values were determined by two-way ANOVA corrected for multiple comparisons. E Cell viability assays were carried out to assess RT3D plus talazoparib in HeLa PARP-1 paired models (PARP-1+/+ and PARP-1−/−) as shown by crystal violet assays. F SRB cell viability assay to assess RT3D plus talazoparib in HeLa PARP-1 paired models at 72 h post-infection. Data presented are mean values ± SD, n = 3 biologically independent experiments. G SRB cell viability assay to assess RT3D plus talazoparib in HeLa PARP-1 mutant models (A7 & F7) versus wild type. Data presented are mean values ± SD, n = 3 biologically independent experiments. P values were determined by two-way ANOVA corrected for multiple comparisons. P values were derived where * = p value, **= p value < 0.01 and *** = p value < 0.001. Source data are provided as a source data file.
Fig. 3
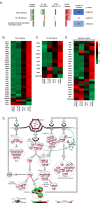
Fig. 3. Proteins were clustered into expression profiles across our treatment cohort groups: vehicle, 0.1 ⌠M talazoparib, RT3D [MOI of 0.1] or combination (RT3D/talazoparib) and then pathway enrichment analysis was carried out on each cluster.
Three key pathways: RIG-I, NF-∣B and apoptotic proteins (associated with death domains) were found to be enriched in the cluster where highest expression was with combination treatment (RT3D/talazoparib) compared to 0.1 ⌠M talazoparib or RT3D [MOI of 0.1] which showed higher expression than vehicle (A). The proteins expressed in the key pathways are summarised as heatmaps with the RIG-I pathway (B), NF-∣B pathway (C) and apoptotic proteins [associated with death domains] (D). Graphical abstract summarising the relevant proteins involved in the recognition, signalling and execution of RT3D infection and talazoparib treatment following STRING analysis (E). Each protein is represented by a circle divided in four parts: vehicle, 0.1 ⌠M talazoparib, RT3D [MOI of 0.1] or combination (RT3D/talazoparib). These levels are color-coded from green (low expression) to white (identical expression) to red (high expression) and represent their value normalised to vehicle. In addition, cytokines that were analysed by ELISA are summarised (as detailed in Fig. 5B and Supp Fig. 8). RIGI-PARP1 interaction studies are summarised later in the paper (Fig. 6E and Supp Fig. 11E). Source data are provided as a source data file.
Fig. 4
Fig. 4. RT3D plus talazoparib enhances death inducing signalling complex (DISC) mediated apoptosis.
A A375 or MeWo cells were treated with RT3D [MOI of 0.1] plus 0.1 ⌠M talazoparib in the presence of either pan-Caspase, or individual Caspase- inhibitors (all at 1 mM) and thereafter measured for cell survival using MTT. Data presented are mean values ± SD, n = 2 biologically independent experiments. P values were determined by one-way ANOVA corrected for multiple comparisons. B A375, MeWo and D04 cells were treated with 0.1 ⌠M talazoparib and thereafter infected with RT3D [MOI of 0.1] for 48 h. Western analysis was carried out to assess Caspase-8, Caspase-3 and PARP cleavage. Equal loading of proteins was assessed by probing for 〈-tubulin. C CD1 nude mice bearing A375 tumour xenografts were treated with oral administration of vehicle (10% DMAc, 6% Solutol and 84% PBS) or 0.1 mg/kg talazoparib from Day 1–5. RT3D was injected intratumorally on Day 3 at 1 × 106 pfu, or sham injection (PBS). Western analysis was carried out in A375 xenograft tumours for PAR, Caspase-8, Caspase-3 and PARP cleavage. Equal loading was measured by probing for a-tubulin. D Western analysis was carried out in HeLa PARP-1 paired models. PARP-1+/+ (wild type), and PARP-1−/− (clones G3 and G9) were infected with RT3D [MOI of 0.1 and 1.0] and immunoblotted for PAR, Casapse-8 and Caspase-3 cleavage. Equal loading was measured by probing for 〈-tubulin. E Western analysis was carried out to assess PAR expression and cleavage of Caspase-3 and PARP, following treatment of talazoparib (0.1⌠M) in HeLa PARP-1+/+ and PARP-1−/− (clone G9) cells. RT3D was then infected in the cells at MOI of 0.1 (PARP-1−/− (clone G9) and MOI of 1.0 (PARP-1+/ +). Equal loading was measured by probing for a-tubulin. F&G. A375 cells were transfected with scramble control (SC) or siRNA targeting RIPK-1, Caspase-8 or FADD (all at 50 nM) and subsequently treated with 0.1 ⌠M talazoparib and RT3D [MOI of 0.1] for 48 h and assessed by SRB cell viability assay. Data presented in (G) are mean values ± SD, n = 2 biologically independent experiments. P values were determined by two-way ANOVA corrected for multiple comparisons. H Western blot analysis was carried out in A375 cells transfected with scramble control (SC) or siRNA targeting Caspase-8, FADD, or RIPKI all at 50 nM and subsequently treated with talazoparib and RT3D [MOI of 0.1] for 48 h. Lysates were immunoblotted for PAR, cleaved PARP-1, Caspase-8, FADD or RIPK1 to confirm siRNA target effect. I A375 cells were pre-treated with 0.1 ⌠M talazoparib and infected with RT3D at an MOI of 0.1 and immunoprecipitation (IP) assay with PAR antibody was carried out after 36 h. Western analysis was carried out to assess the interaction between PARylated proteins and the DISC components (Caspase-8, FADD, TRADD, RIPK1 and DR5). The input (lysate) was carried out to confirm RT3D induced PARylation (refer to supplementary Fig. 7A). J Caspase-8 immunoprecipitation was performed in A375 cells. Z-VAD (10 mM) was added in all samples prior to any treatment to prevent destabilisation of complexes with Caspase-8. Cells were then treated with RT3D [MOI of 0.1] and talazoparib (0.1 μM) at 0, 24 and 36 h. Western analysis was carried out for PAR, RIPK1 and FADD antibodies. The input (lysate) was carried out to confirm expected RT3D induced PARylation and Caspase-8 cleavage. Equal loading was measured by probing for α-tubulin (supplementary Fig. 7B). P values were derived where * = p value, **= p value < 0.01 and *** = p value < 0.001. Source data are provided as a source data file.
Fig. 5
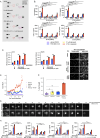
Fig. 5. NF-κB activity and pro-inflammatory cytokine production is enhanced following RT3D and talazoparib treatment.
A A human cytokine array was used to assess cytokine secretion in A375 following RT3D [MOI of 0.1] and 0.1 μM talazoparib 48 h post-treatment. B A375 cells were transfected with scrambled control (SC), RIPK1, Caspase-8 and FADD siRNA at 50 nM prior to treatment with 0.1 μM talazoparib and RT3D [MOI of 0.1]. Supernatants were collected and assessed for CCL5/RANTES, CXCL8/IL8, CXCL1/GRO and CXCL10/IP10 cytokines by ELISA at 48 h post-infection. Data presented are mean values ± SD, n = 2 biologically independent experiments. P values were determined by two-way ANOVA corrected for multiple comparisons. C A375 and MeWo cell nuclear extracts were used to assess DNA binding activity of the NF-κB transcription factor RELA (p65) in nuclear extracts following exposure to RT3D [MOI of 0.1] and 0.1 μM talazoparib at 48 h post-treatment. Data presented are mean values ± SD, n = 2 biologically independent experiments. P values were determined by two-way ANOVA corrected for multiple comparisons. D Representative images of PCNA-Scarlet (nuclear marker) and Rel-A GFP tagged A375 cells with RT3D [MOI of 10] and 1 μM talazoparib treatment. E Rel-A GFP tagged A375 cells were treated with RT3D [MOI of 10] and 1 μM talazoparib over a 48-h time-period. Cells were imaged by confocal microscopy and single cells tracked using automated imaging analysis Nuclear RELA was calculated as the total intensity in the nuclus region divided by the nucleus area. Data show the mean tracks of RELA over time. F Average percentage of single cell tracks corresponding to dying cells at 48 h post treatment. G Representative images of an A375 cell showing high nuclear RELA localisation eventually undergoing cell death following treatment with RT3D [MOI of 10] and 1 μM talazoparib over a 48-h time-period. RELA-GFP translocates to the nucleus between 34 and 36 h post treatment and cell death is apparent from 44 h post treatment. H A375 cells were pre-incubated with the IκB phosphorylation inhibitor, BAY 11-7082 (5 μM) and then treated with RT3D [MOI of 0.1] plus talazoparib (0.1 μM). Supernatants were collected and assessed for CCL5/RANTES, CXCL8/IL8, CXCL1/GRO and CXCL10/IP10 cytokines by ELISA at 48 h post-infection. Data presented are mean values ± SD, n = 2 biologically independent experiments. P values were determined by two-way ANOVA corrected for multiple comparisons. P values were derived where * = p value, **= p value < 0.01 and *** = p value < 0.001. Source data are provided as a source data file.
Fig. 6
Fig. 6. Talazoparib enhances RT3D-induced interferon signalling through RIG-I.
A A375 cells were treated with talazoparib at 0.1 ⌠M and infected with RT3D [MOI of 0.1]. Western analysis was carried out to assess RIG-1, pSTAT-1, pIRF3, STAT1 and IRF3, Equal loading was of proteins was assessed by probing for 〈-tubulin. B A375 cells were transfected with non-targeting scrambled control (SC) siRNA or siRNA targeting RIG-I (50 nM) and thereafter treated with 0.1 ⌠M and RT3D [MOI of 0.1] for 48 h and assessed for cell viability as shown by crystal violet staining. C Western analysis was carried out on lysates from A375 cells and probed for RIG-I and cleaved PARP, while (D) IFN-® production was assessed by ELISA. Data presented are mean values ± SD, n = 2 biologically independent experiments. P values were determined by two-way ANOVA corrected for multiple comparisons. E A375 cells were treated with talazoparib at 0.1 ⌠M and RT3D [MOI of 0.1]. PARP-trap agarose IP was performed on the lysates and Western analysis carried out to assess interaction between PARP-1 and RIG-I. P values were derived where * = p value, **= p value < 0.01 and *** = p value < 0.001. Source data are provided as a source data file.
Fig. 7
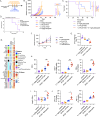
Fig. 7. RT3D plus talazoparib enhances anti-tumour efficacy which correlates with an increase in immune response.
A Treatment schedule, black/6 mice carrying 4434 tumours were treated with oral administration of 0.1 mg/kg talazoparib or vehicle from Day 1–5. RT3D was injected intratumorally on Day 3 at 1 × 106 pfu or sham injection. B Size of tumours were measured for each treatment cohort consisting of vehicle (10% DMAc, 6% Solutol and 84% PBS), 0.1 mg/kg talazoparib, 1 × 106 pfu RT3D or combination. Each bar represents mean SEM ± for each treatment group. C Kaplan–Meier curve was evaluated for each treatment group to assess the median survival rate. For (B and C), vehicle n = 6, RT3D n = 6, talazoparib n = 6 and combination n = 6 animals per group. D Mice cured at day 90 following talazoparib alone (2/6), RT3D alone (2/6) or RT3D plus talazoparib (6/6) were rechallenged on the other flank and compared with naïve mice injected with 4434 tumours (both implanted at 4 × 106 cells) and tumor growth assessed. Control n = 6, RT3D n = 2, talazoparib n = 2 and combination n = 6 animals per group. E Deconvolution of immune cells in 4434 tumours following RT3D and talazoparib treatment. Tumours were dissected on day 8 (3 mice per group) after treatment, total RNA was isolated and gene expression analysis performed using the mouse Immunology Profiling panel from NanoString Technologies. F Tumour volumes of mice used to profile the immune infiltrate by FACS analysis were measured up to Day 12 (n of 5). G Tumour weights of mice used to profile the immune infiltrate by FACS analysis at time of harvest were measured. H FACS analysis of in vivo tumour samples. Data show cell counts of CD3+, CD8+ and CD4+ cells gated from viable cells. I Cell counts of foxp3+ cells gated from viable cells. J Cell counts of PD-L1+ and PD-1+ cells gated from viable cells. For data sets (FJ), data presented are mean values ± SEM from 1 biologically independent experiment. vehicle n = 5, RT3D n = 5, talazoparib n = 5 and combination n = 5 animals per group. P values were derived where * = p value, **= p value < 0.01 and *** = p value < 0.001. Source data are provided as a source data file.

References

    1. Kim, S. G. et al. Phase II trial of pexa-vec (pexastimogene devacirepvec; JX-594), an oncolytic and immunotherapeutic vaccinia virus, in patients with metastatic, refractory renal cell carcinoma (RCC). J. Clin. Oncol.36 (2018). Meeting Abstract: 2013 ASCO Annual Meeting.
    1. Cui, C. L. et al. OrienX010 oncolytic viral therapy in phase Ic trial of intralesional injection in liver metastases among patients with stage IV melanoma after standard treatment. J. Clin. Oncol.35, e21013 (2017).
    1. Andtbacka, R. H. et al. Talimogene laherparepvec improves durable response rate in patients with advanced melanoma. J. Clin. Oncol.33, 2780–2788 10.1200/JCO.2017.35.15_suppl.e21013 (2015). - PubMed
    1. Gollamudi, R. et al. Intravenous administration of Reolysin, a live replication competent RNA virus is safe in patients with advanced solid tumors. Invest. N. Drugs28, 641–649 (2010). - PMC - PubMed
    1. Pecora, A. L. et al. Phase I trial of intravenous administration of PV701, an oncolytic virus, in patients with advanced solid cancers. J. Clin. Oncol.20, 2251–2266 (2002). - PubMed

MeSH terms