. 2025 Jul 8;16(1):6302.
doi: 10.1038/s41467-025-61614-3.

Chronic cerebral hypoperfusion induces venous dysfunction via EPAS1 regulation in mice

Affiliations

Chronic cerebral hypoperfusion induces venous dysfunction via EPAS1 regulation in mice

Vanessa Kristina Wazny et al. Nat Commun. .

Abstract

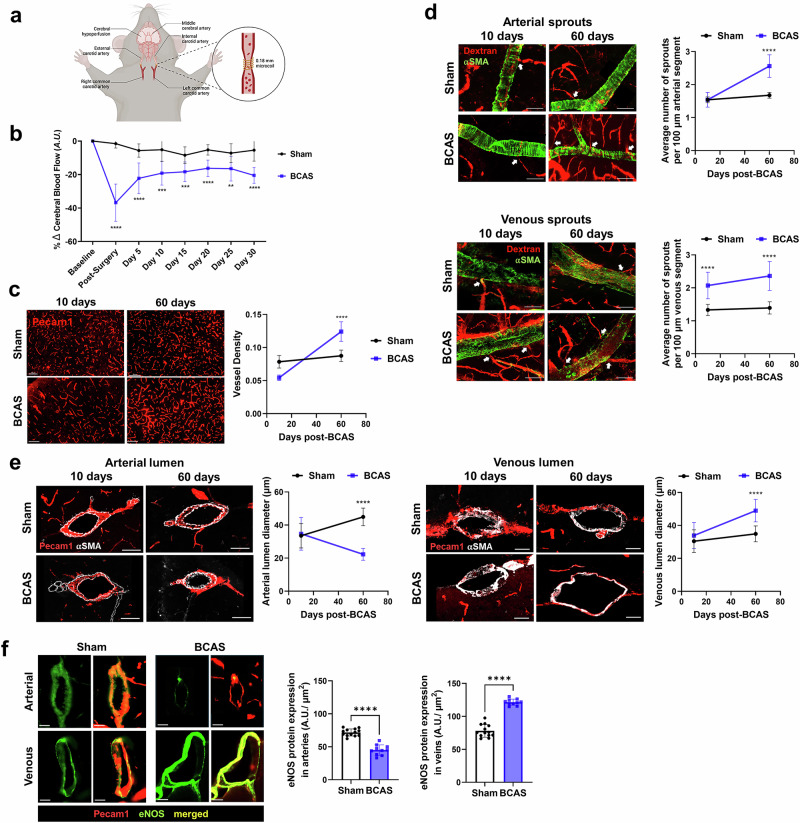
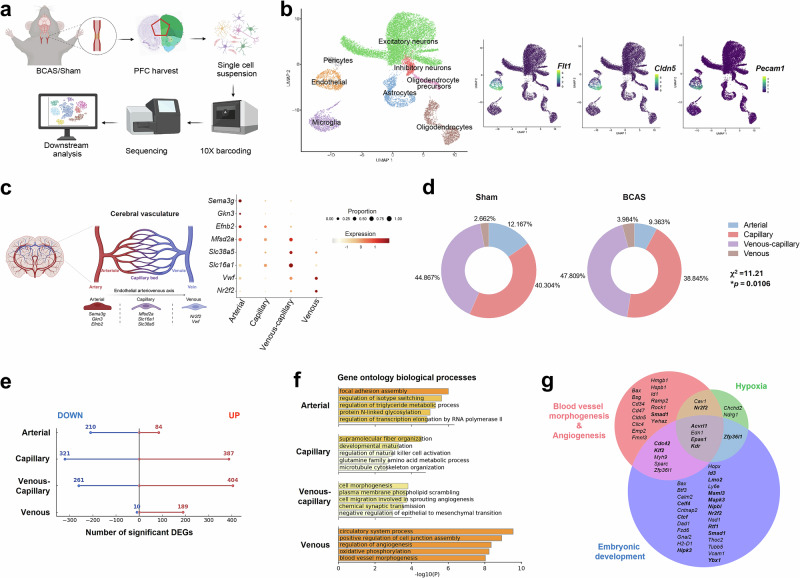
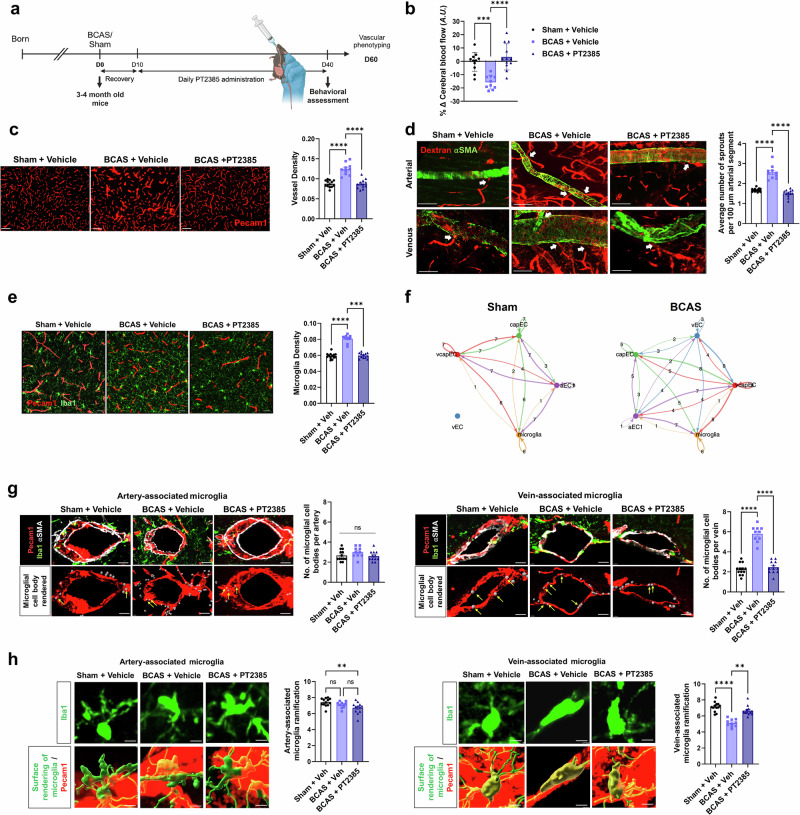
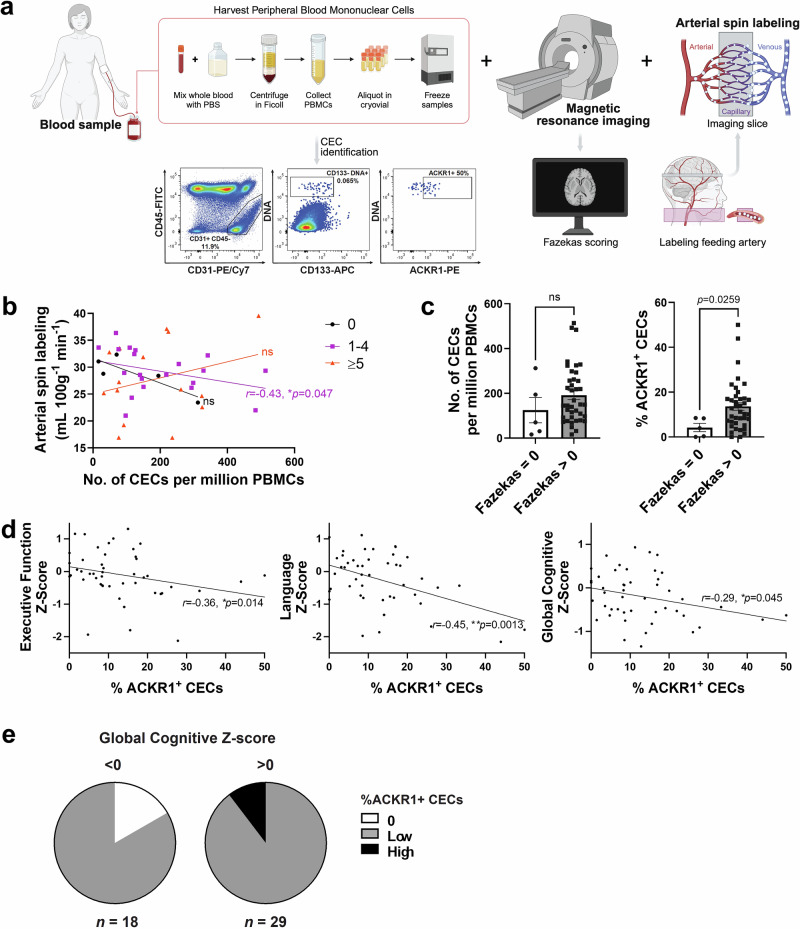
Vascular dementia is the second most common form of dementia. Yet, the mechanisms by which cerebrovascular damage progresses are insufficiently understood. Here, we create bilateral common carotid artery stenosis in mice, which effectively impairs blood flow to the brain, a major cause of the disease. Through imaging and single-cell transcriptomics of the mouse cortex, we uncover that blood vessel venous cells undergo maladaptive structural changes associated with increased Epas1 expression and activation of developmental angiogenic pathways. In a human cell model comparing arterial and venous cells, we observe that low-oxygen condition leads to sustained EPAS1 signaling specifically in venous cells. EPAS1 inhibition reduces cerebrovascular abnormalities, microglial activation, and improves markers of cerebral perfusion in vivo. In human subjects, levels of damaged endothelial cells from venous vessels are correlated with white matter injury in the brain and poorer cognitive functions. Together, these findings indicate EPAS1 as a potential therapeutic target to restore cerebrovascular integrity and mitigate neuroinflammation.


Conflict of interest statement

Competing interests: The authors declare no competing interests.

Figures

Fig. 1
Fig. 1. Phenotyping of vessel subtype-specific response to cerebral hypoperfusion.
a Schematic of BCAS performed on a mouse. Created in BioRender. Wazny, V. (2025) https://BioRender.com/ujauv4d. b A time course of percentage of cerebral blood flow changes relative to their respective baseline values of individual mice (n = 11 sham, n = 10 BCAS). Statistical significances reflect differences of sham versus BCAS. c Representative immunofluorescence images of Pecam1-positive cerebral vessels (red) acquired 10 days or 60 days post-BCAS surgery. Statistical significances reflect differences of day 10 versus day 60 post-BCAS. Scale bars, 100 µm. d Three-dimensional images of cerebral vasculatures injected with 500 kDa FITC-conjugated dextran (green). Alpha-smooth muscle actin (αSMA, green) was used to distinguish arterial (striated) from venous (discontinuous αSMA) vessels. Quantitative analysis of the number of sprouts per 100 μm of vessel length was determined. White arrows indicate angiogenic sprouts. Statistical significances reflect differences of sham versus BCAS. Scale bars, 30 µm. e Representative immunofluorescence images of arterial and venous vessels stained with Pecam1 (red) and αSMA (white) at 10 days and 60 days post-BCAS. Quantitative analysis of the lumen diameter measured by the shortest length across every vessel cross-section. Statistical significances reflect differences of sham versus BCAS. Scale bars, 20 µm. f Representative immunofluorescence images of eNOS (green) protein expression on Pecam1-positive cerebral vessels (red). Protein expression of eNOS was quantified by eNOS signal intensity per area of the vessel. Statistical significances reflect differences of sham versus BCAS. Scale bars, 20 µm. bf Data points represent individual animals in mean ± s.d.; unpaired t-test or Mann-Whitney test comparing two groups (two-sided). cf Sample size: 10 days [n = 12 sham (6 females, 6 males), n = 10 BCAS (5 females, 5 males)] or 60 days [n = 13 sham (6 females, 7 males), n = 10 BCAS (5 females, 5 males)]. Source data are provided as a Source Data file.
Fig. 2
Fig. 2. Profiling endothelial cell transcriptomes in response to cerebral hypoperfusion.
a Schematic of the single-cell RNA-sequencing workflow on mouse prefrontal cortex. Created in BioRender. Wazny, V. (2025) https://BioRender.com/g3sc0se. b UMAP visualization of single-cell transcriptomes from BCAS (n = 4, 2 males, 2 females) and sham (n = 4, 2 males, 2 females) mouse brains. Expression patterns of endothelial marker genes (Flt1, Cldn5, Pecam1) in dataset have been highlighted on UMAP plots. c Endothelial subtypes identified based on gene expression patterns of published curated dataset. Dot plot showing expression and proportion of cells per endothelial subtypes expressing their respective marker genes. Created in BioRender. Wazny, V. (2025) https://BioRender.com/m5oc7qp. d Proportions of endothelial subtypes obtained from sham versus BCAS groups. Chi-squared goodness-of-fit test (two-sided) was performed to assess the difference in frequencies between the groups. e Numbers of significantly upregulated (red lines) and downregulated (blue lines) differentially expressed genes (DEGs) for each endothelial subtype in response to BCAS (adjusted p value < 0.05, Benjamini-Hochberg method). f Bar graphs of top 5 enriched gene ontology biological process clusters, based on differentially upregulated genes for each endothelial subtype, sorted by p value. Terms with a p value < 0.01, a minimum count of 3, and an enrichment factor > 1.5 (the enrichment factor is the ratio between the observed counts and the counts expected by chance) are collected and grouped into clusters based on their membership similarities. More specifically, p values are calculated based on the cumulative hypergeometric distribution, and q values are calculated using the Benjamini-Hochberg procedure to account for multiple testings. Kappa scores are used as the similarity metric when performing hierarchical clustering on the enriched terms, and sub-trees with a similarity of > 0.3 are considered a cluster. The most statistically significant term within a cluster is chosen to represent the cluster. g Venn diagram showing the overlap of significantly upregulated DEGs (adjusted p value < 0.05, Benjamini-Hochberg method) related to various biological processes in BCAS venous endothelial cells. Bolded genes refer to transcription factors.
Fig. 3
Fig. 3. Differential responses of human arterial and venous endothelial cells to 1% oxygen.
a Schematic of the endothelial differentiation system. Human pluripotent stem cells were differentiated into primitive streak, then dorsal lateral mesoderm, and subsequently into arterial and venous endothelial cells. b Heatmap showing the expression profile of upregulated genes associated with angiogenesis, blood vessel morphogenesis and hypoxia in BCAS venous cells, and mapped onto the single-cell transcriptomics of human pluripotent stem cells, primitive streak, lateral mesoderm, pre-vein, and venous endothelial cell populations. The color intensity indicates the expression level. c Time course of relative ID1 gene expressions comparing arterial and venous endothelial cells under 1% oxygen conditions (n = 3 biological replicates). d Representative immunofluorescence images of arterial and venous endothelial cells stained for EPAS1 (purple) and nuclei (DAPI, blue) in normoxia and after 4 h of 1% oxygen exposure. Scale bar, 50 µm. e Quantification of the fold change of % EPAS1 colocalization with the nuclei over time comparing arterial and venous cells (n = 3 biological replicates, n = 3 field of view per replicate). f Venous endothelial tube formation assay under 21% and 1% oxygen conditions, both untreated and treated with PT2385. Quantification was based on the number of endothelial tube-like structures (n = 3 biological replicates). Scale bar, 400 µm. c, e, f Data points represent mean ± s.d.; unpaired t-test comparing two independent groups (two-sided), one-way ANOVA for multiple comparisons (two-sided). Source data are provided as a Source Data file.
Fig. 4
Fig. 4. Venous remodeling in response to cerebral hypoperfusion is pharmacologically reversible.
a Timeline for BCAS/ sham surgery, drug administration, and cerebrovascular phenotyping. Created in BioRender. Wazny, V. (2025) https://BioRender.com/vrn0741. b Percentage of cerebral blood flow changes relative to their respective baseline values of individual mice comparing sham + vehicle (n = 11), BCAS + vehicle (n = 10), and PT2385-treated BCAS (n = 12) mice at 40 days post-BCAS. c Representative immunofluorescence images of Pecam1-positive cerebral vessels (red) acquired 60 days post-BCAS surgery. Scale bar, 100 µm. d Three-dimensional images of cerebral vasculatures injected with 500 kDa FITC-conjugated dextran (green). Alpha-smooth muscle actin (αSMA, green) was used to distinguish arterial (striated) from venous (discontinuous αSMA) vessels. Quantitative analysis of the number of sprouts per 100 μm of vessel length was determined. White arrows indicate angiogenic sprouts. Scale bars, 30 µm. e Representative immunofluorescence images of microglia stained with Iba1 (green) against Pecam1-positive vessels. Scale bars, 20 µm. f Circle plot showing the number of ligand-receptor (L-R) interactions between pairwise cell populations among the endothelial cell subtypes and microglial populations in sham and BCAS groups. aEC arterial, capEC capillary, vcapEC venous capillary, vEC venous endothelial cells. g Representative immunofluorescence images of Iba1-positive microglia juxtaposed on arterial or venous structures. The average number of microglial cell bodies per vessel (three independent vessels) was measured in every animal, with at least 80% of each rendered spot of microglial cell body colocalizing with the vessels. Yellow arrows indicate examples of vessel-associated microglia. Scale bars, 20 µm. h Ramification index of vein- and artery-associated microglia to characterize microglia activation state. Scale bars, 5 µm. ce, g, h Data points represent individual animals in mean ± s.d.; one-way ANOVA or Kruskal-Wallis test for multiple comparisons (two-sided). Sample size at 60 days post-BCAS: n = 13 sham + vehicle (6 females, 7 males), n = 10 BCAS + vehicle (5 females, 5 males) and n = 12 BCAS (7 females, 5 males). Source data are provided as a Source Data file.
Fig. 5
Fig. 5. Circulating venous endothelial cell levels are elevated in human subjects with cerebrovascular disease burden.
a Schematic of study workflow. Human subjects underwent blood sample collection, magnetic resonance imaging and arterial spin labeling. Flow cytometry analysis on peripheral blood mononuclear cells (PBMCs) was used to identify circulating endothelial cells (CECs) based on the immunophenotypic markers of CD45 /CD31 +/CD133 /DNA+, followed by characterization with brain venous marker, ACKR1. Created in BioRender. Wazny, V. (2025) https://BioRender.com/9ypd05j. b Spearman’s correlation analysis between cerebral tissue perfusion, measured by arterial spin labeling, with the number of CECs per million PBMCs. Subjects were grouped by Fazekas scores. Spearman’s correlation coefficient r and p values (two-tailed test) are indicated. c Quantification of the number of CECs per million PBMCs (left), and percentage of ACKR1+ CECs (right) in subjects grouped by presence (Fazekas >0, n = 39 individual participants) or absence (Fazekas = 0, n = 5 individual participants) of cerebrovascular disease burden. Data points represent mean ± s.e.m.; Mann-Whitney test (two-sided); *p < 0.05 and ns non-significant. d Correlation analysis between the percentage of ACKR1+ CECs and Z-scores of various cognitive functions. Spearman’s correlation coefficient r and p values (two-tailed test) are indicated for executive function Z-scores. Pearson’s correlation coefficient r and p values (two-tailed) are indicated for language and global cognitive Z-scores e Proportional analysis of zero (0), low ( < 95th percentile), and high ( > 95th percentile) percentages of ACKR1+ CECs in subjects grouped by negative and positive global cognitive Z-scores. Source data are provided as a Source Data file.

References

    1. Wiesmann, M., Kiliaan, A. J. & Claassen, J. A. Vascular aspects of cognitive impairment and dementia. J. Cereb. Blood Flow. Metab.33, 1696–1706 (2013). - PMC - PubMed
    1. Brown, W. R., Moody, D. M., Challa, V. R., Thore, C. R. & Anstrom, J. A. Venous collagenosis and arteriolar tortuosity in leukoaraiosis. J. Neurol. Sci.203-204, 159–163 (2002). - PubMed
    1. Quick, S., Moss, J., Rajani, R. M. & Williams, A. A vessel for change: endothelial dysfunction in cerebral small vessel disease. Trends Neurosci.44, 289–305 (2021). - PubMed
    1. Vanlandewijck et al. A molecular atlas of cell types and zonation in the brain vasculature. Nature554, 475–480 (2018). - PubMed
    1. Fischer, A., Zalvide, J., Faurobert, E., Albiges-Rizo, C. & Tournier-Lasserve, E. Cerebral cavernous malformations: from CCM genes to endothelial cell homeostasis. Trends Mol. Med.19, 302–308 (2013). - PubMed

MeSH terms

Substances

LinkOut - more resources