. 2025 Jul 8;15(1):24480.
doi: 10.1038/s41598-025-07934-2.

Pex3 promotes formation of peroxisome-peroxisome and peroxisome-lipid droplet contact sites

Affiliations

Pex3 promotes formation of peroxisome-peroxisome and peroxisome-lipid droplet contact sites

Lucía Amado et al. Sci Rep. .

Abstract

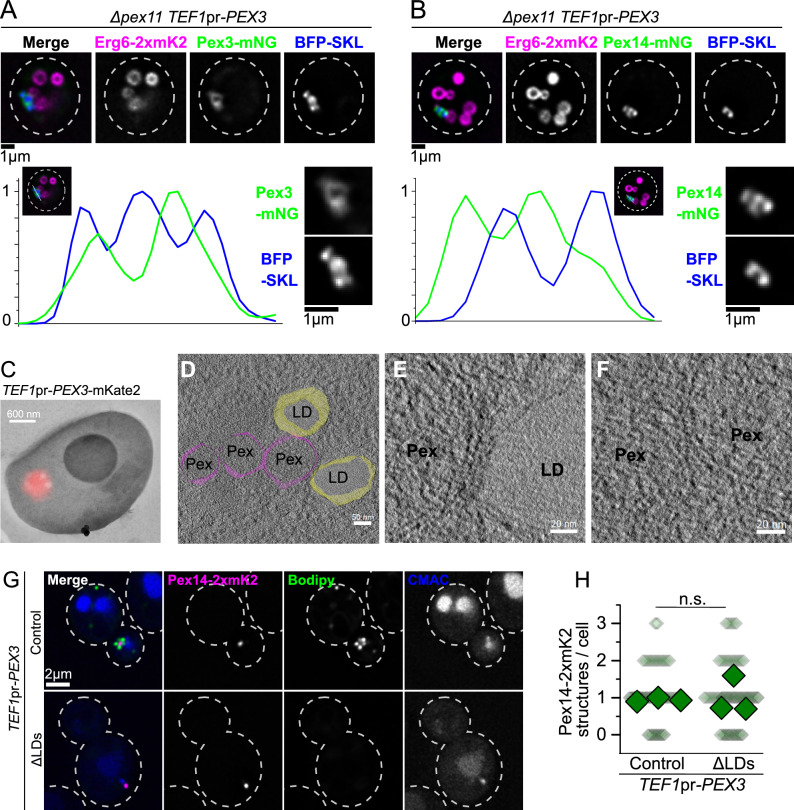
Peroxisomes are ubiquitous organelles that mediate central metabolic functions, such as fatty acid β-oxidation, as well as diverse tissue- and organism-specific processes. Membrane contact sites, regions of close apposition with other organelles for direct communication, are central to several aspects of their life cycle. Pex3 is a conserved multifunctional peroxisomal transmembrane protein that is involved in the insertion of peroxisomal membrane proteins, in pexophagy, and in the formation of membrane contact sites. Here, we show that high Pex3 levels in Saccharomyces cerevisiae induce the formation of peroxisome clusters surrounded by lipid droplets, mediated by peroxisome-peroxisome and peroxisome-lipid droplet contact sites. This clustering occurs independently of Pex3 partners in other processes Pex19, Inp1, and Atg36. The cytosolic domain of Pex3 binds peroxisomes, suggesting a direct role in homotypic contact site formation. Lipid droplet-peroxisome contact sites require the lipid droplet-localized triacylglycerol lipase Tgl4, which is enriched at this interface along with other lipases. Pex3 overexpression in Drosophila melanogaster similarly alters peroxisome and lipid droplet morphology and promotes contact site formation. Together, our results offer novel molecular insights into homotypic peroxisome contact sites and peroxisome-lipid droplet contact sites across species.


Conflict of interest statement

Declarations. Competing interests: The authors declare no competing interests.

Figures

Fig. 1
Fig. 1
Overexpression of Pex3 causes the formation of a single peroxisomal structure surrounded by lipid droplets. (A–B) Overexpression of Pex3 produces the collapse of all peroxisomal signal into one structure. Panel A shows representative pictures of a strain expressing mCherry-SKL construct to visualize the lumen of the peroxisomes, either with Pex3 at endogenous levels (Control) or overexpressed (TEF1pr-PEX3) and the vacuolar lumen stained with CMAC. Cell outlines are shown as white dashed lines. Scale bar: 2 μm. Panel B shows the quantification of the amount of peroxisomal structures per cell. Three independent experiments were performed and 30 cells were analyzed for each experiment and condition. Small diamonds correspond to individual cells, bigger diamonds correspond to the average of independent experiments. The different strains were compared using an unpaired two-tailed Student’s t-test. *** P < 0.001. (C) Turbo ID of overexpressed Pex3-TurboID enriches peroxisomal and lipid droplets proteins. Volcano plot showing relative protein intensity in a pull-down of biotinylated proteins between a strain overexpressing Pex3 tagged c-terminally with the TurboID protein (TEF1pr-PEX3-TID) and a wild type control strain (wt). Peroxisomal proteins are marked in magenta and lipid droplets proteins in green. GO term enrichment analysis of the group of proteins significantly enriched in the Pex3-TID pull-down showed an enrichment of the GO Terms “peroxisomes” and “lipid droplets”. (D) The formed peroxisomal structure is surrounded by lipid droplets. Representative pictures of a strain expressing mCherry-SKL construct to visualize the lumen of the peroxisomes, either with Pex3 at endogenous levels (Control) or overexpressed (TEF1pr-PEX3), the vacuolar lumen stained with CMAC and lipid droplets stained with Bodipy. Scale bar: 2 μm. The zoomed in region shows a peroxisomal structure surrounded by lipid droplets with a scale bar of 1 μm. Cell outlines are shown as white dashed lines.
Fig. 2
Fig. 2
Overexpression of Pex3 induces an accumulation of peroxisomes surrounded by LDs that contains Pex-Pex and Pex-LD contact sites. (A–B) Enlarged peroxisomes and LDs reveal that the structures contain several maxima for peroxisome lumen signal, with peroxisomal membrane between them. Representative pictures of a strain with overexpressed Pex3 (TEF1pr-PEX3), expressing the BFP-SKL construct to visualize the lumen of the peroxisomes, Erg6-2xmKate2 marking the lipid droplet monolayer, and either Pex3 (A) or Pex14 (B) tagged with mNeonGreen as markers of the peroxisomal membrane. To produce enlarged peroxisomes and lipid droplets, the cells contain a deletion of PEX11, and were grown with oleate as the sole carbon source for 20hs. Cell outlines are shown as white dashed lines. Scale bars: 1 μm. Each graph shows the signal of BFP-SKL and the corresponding peroxisomal membrane protein over a line across the structure, depicted in the merged image. (C–F) On-section CLEM tomography confirms that the structure involves Pex-Pex and Pex-LD contact sites. Panel C shows a representative image of on-section CLEM done on a strain with overexpressed Pex3 (TEF1pr-PEX3) and tagged with 2xmKate2. Scale bar: 600 nm. Panel D shows a tomography image of the same section overlayed with the 3D model recreated from the images, showing peroxisomes in magenta and lipid droplets in yellow. Scale bar: 50 nm. Panels E and F show zoomed in regions of the tomogram as examples of the peroxisome-lipid droplet (E) and peroxisome-peroxisome (F) contact sites. Scale bars: 20 nm. (G–H) LDs are not necessary for the formation of the cluster of peroxisomes. Panel G shows representative pictures of strains with overexpressed Pex3 (TEF1pr-PEX3) in control cells and in strains that cannot produce lipid droplets (ΔLDs), expressing Pex14-2xmKate2 to visualize the peroxisomes, lipid droplets were stained with Bodipy and the vacuolar lumen was stained with CMAC. Cell outlines are shown as white dashed lines. Scale bar: 2 μm. Panel H shows the quantification of the amount of peroxisomal structures per cell. Three independent experiments were performed and 30 cells were analyzed for each experiment and condition. Small diamonds correspond to individual cells, bigger diamonds correspond to the average of independent experiments. The different strains were compared using an unpaired two-tailed Student’s t-test. n.s., not significant.
Fig. 3
Fig. 3
The cytosolic domain of Pex3 binds peroxisomes and is able to tether them to another organelle. (A–C) The cytosolic domain of Pex3 binds to peroxisomes. Panel A shows a diagram of the GFP-Pex3(CD) construct. This construct contains the cytosolic domain of Pex3 (aa40-441) fused to GFP tag at the N-terminus instead of the transmembrane domain as in the full length Pex3. Panel B shows representative pictures of the colocalization experiment of GFP-Pex3(CD) with peroxisomes (Pex14-HaloTag) and lipid droplets (Erg6-2xmKate2). Cell outlines are shown as white dashed lines. Scale bar: 2 μm and 0.8 μm. Panel C shows the co-localization analysis of the experiment in B using Mander´s coefficients M1 and M2 for the overlap of: Pex14-HaloTag and GFP-Pex3(CD) (cyan diamonds), Erg6-2xmKate2 and GFP-Pex3(CD) (green diamonds) or Pex14-HaloTag and Erg6-2xmKate2 (black diamonds). Three independent experiments were performed and 30 cells were analyzed for each experiment. Each small diamond represents a single cell, and the bigger ones represent the average of each of three independent experiments. (D) Diagram of the strategy used to recruit the cytosolic domain of Pex3 to mitochondria artificially. The outer mitochondrial membrane protein Tom70 was tagged in the C-terminus with a Nanobody that recognizes the AlfaTag (Tom70-NB-Alfa). The cytosolic domain of Pex3 was tagged with an AlfaTag and an mKate2 fluorescent protein in the N-terminus (AlfaTag-mKate2-Pex3(CD) construct). This causes the recruitment of AlfaTag-mKate2-Pex3(CD) to mitochondria. (E–F) Targeting the cytosolic domain of Pex3 to mitochondria tethers peroxisomes to this organelle. Panel E shows representative images of the localization of peroxisomes (GFP-SKL) and mitochondria (Cit1-HaloTag) in the presence or absence of AlfaTag-Pex3(CD), with Tom70 fused to Alfa Nanobody in the background. A maximum intensity projection of the Z-stacks is shown for each image. Cell outlines are shown as white dashed lines. Scale bar: 2 μm. Panel F shows the measurements of distances between peroxisomes (GFP-SKL) and mitochondria (Cit1-HaloTag) in the presence or absence of the AlfaTag-Pex3(CD) construct as described. Three independent experiments were performed and 30 cells were analyzed for each experiment. Each small diamond represents a single peroxisome, and the bigger ones represent the average of each of three independent experiments. The distribution of distances to mitochondria between the two strains was compared using a Kolmogorov-Smirnoff test, **** P < 0.0001. Comparison of the means of each experiment with a two-tailed unpaired Student´s t-test results in a P value < 0.05.
Fig. 4
Fig. 4
Formation of the structure is independent of known interactors of Pex3. (A) Diagram of Pex3 known interactors and their functions. (B, E) Representative images of strains overexpressing Pex3 (TEF1pr-PEX3) in control cells and strains lacking Inp1 (B) or Atg36 (E). All strains express Pex14 fused to 2xmKate2 to visualize the peroxisomes, lipid droplets were stained with Bodipy and the vacuolar lumen was stained with CMAC. Cell outlines are shown as white dashed lines. Scale bars: 2 μm. (C, F) Quantification of the number of peroxisomal structures per cell in the microscopy experiments described before. Small diamonds correspond to individual cells, bigger diamonds correspond to the average of independent experiments. Three independent experiments were performed and 30 cells were analyzed for each experiment and condition. The different strains were compared using an unpaired two-tailed Student’s t-test. n.s., not significant. (D, G) Quantification of the fraction of peroxisomal structures with accumulations of lipid droplets next to them in the microscopy experiments described above. Three independent experiments were performed and 30 cells were analyzed for each experiment and condition. The different strains were compared using an unpaired two-tailed Student’s t-test. n.s., not significant. (H) Pex3 overexpression does not induce pexophagy. Whole cell lysates of strains expressing Pex14-GFP with or without Pex3 overexpression were analyzed by Western blot. The cells were either grown in media containing glucose to logarithmic phase (L.P.G) or grown in media containing oleate and shifted to nitrogen starvation medium to induce pexophagy (P.I.C). The presence of a free GFP band is indicative of vacuolar degradation of peroxisomes. The whole Western blot membrane as well as a loading control is shown in Supplemental Fig. 3 A. (I) The amino acids involved in hsPex3 interaction with hsPex19 are conserved in yeast. To the left, the structure obtained for Homo sapiens Pex3 (cyan) interacting with a peptide of hsPex19 (dark blue)17. Amino acids W104 and L107 of hsPex3 are involved in the interaction with hsPex19. To the right, the structure predicted by AlphaFold for Saccharomyces cerevisiae Pex3 (light blue) shows that it contains a structurally conserved W and L in the same positions (W128 and L131 in scPex3). (J) Pex3(W128K, L131K) cannot interact with Pex19. Affinity purification of msGFP2-Pex19 co-purifies Pex3-mKate2-AlfaTag but not Pex3(W128K, L131K)-mKate2-AlfaTag. The complete Western blot membranes are shown in Supplemental Fig. 3 B and C. (K) Pex3(W128K, L131K) does not support BFP-SKL import into peroxisomes. In a strain that expresses BFP-SKL, endogenous Pex3 was deleted and either Pex3wt or Pex3(W128K, L128K) were re-introduced in a plasmid. Quantification of the number of BFP-SKL puncta per cell is shown to the right. (L–N) Overexpression of Pex3(W128K, L131K), which cannot interact with Pex19, still causes aggregation of peroxisomes and recruitment of lipid droplets. Panel K shows representative images of strains overexpressing Pex3 from a plasmid (TEF1pr-PEX3-mKate2) containing either Pex3 wt or Pex3 mutant. Lipid droplets were stained with Bodipy and the vacuolar lumen was stained with CMAC. The strain contains Pex3 wt in the background, expressed from its genomic locus, in order to have normal peroxisomes. Cell outlines are shown as white dashed lines. Scale bars: 2 μm. Panel L shows the quantification of the number of peroxisomal structures per cell in the microscopy experiments described before. Small diamonds correspond to individual cells, bigger diamonds correspond to the average of independent experiments. Panel M shows the quantification of the proportion of peroxisomal structures with accumulations of lipid droplets next to them in the microscopy experiments described above. Three independent experiments were performed and 30 cells were analyzed for each experiment and condition. The different strains were compared using an unpaired two-tailed Student’s t-test. n.s., not significant.
Fig. 5
Fig. 5
A genome-wide microscopy-based screen identifies that deletion of Tgl4 interferes with the targeting of LDs to the peroxisomal structure. (A) A microscopy-based screen for deletions that disrupt the Pex3 overexpression phenotype. Establishment of a deletion library with the overexpression of Pex3 (TEF1pr-PEX3) by SGA and subsequent automated high-content microscopy-based screen. Deletion of TGL4 was identified to disrupt the phenotype. (B–C) Deletion of TGL4 disrupts Per-LD CSs, and this effect is specific for this lipase. Panel B shows representative images of strains overexpressing Pex3 (TEF1pr-PEX3) in control cells and strains lacking either Tgl3, Tgl4 or Tgl5. All strains express mCherry-SKL construct to visualize the lumen of the peroxisomes, lipid droplets were stained with Bodipy and the vacuolar lumen was stained with CMAC. Cell outlines are shown as white dashed lines. Scale bars: 2 μm. Panel C shows the quantification of the proportion of peroxisomal structures with accumulations of lipid droplets next to them in the microscopy experiments described above. Three independent experiments were performed and 30 cells were analyzed for each experiment and condition. The different strains were compared by ANOVA and a post-hoc Tukey test. n.s., not significant, *** P < 0.001. (D–E) The role of Tgl4 in establishing this contact site is independent from its lipase activity. Panel E shows representative images of strains overexpressing Pex3 (TEF1pr-PEX3) in control cells and in a strain with Tgl4 (S315G) punctual mutant in the background. Strains express BFP-SKL construct to visualize the lumen of the peroxisomes and Erg6 fused to 2xmKate2 to visualize the lipid droplets. Cell outlines are shown as white dashed lines. Scale bars: 2 μm. Panel D shows the quantification of the proportion of peroxisomal structures with accumulations of lipid droplets next to them. Three independent experiments were performed and 30 cells were analyzed for each experiment and condition. The two different strains were compared using an unpaired two-tailed Student’s t-test. n.s., not significant. (F–G) Enlarged peroxisomes and LDs reveal that Tgl3, Tlg4 and Tgl5 are enriched at the interfaces at Per-LD CSs to different degrees. Representative pictures of a strain with overexpressed Pex3 (TEF1pr-PEX3), expressing the BFP-SKL construct to visualize the lumen of the peroxisomes, Erg6-2xmKate2 marking the lipid droplet monolayer, and each of the Tgl proteins tagged with mGFP. To produce enlarged peroxisomes and lipid droplets, the cells contain a deletion of PEX11, and were grown with oleate as the sole carbon source for 20hs. Cell outlines are shown as white dashed lines. Scale bars: 2 μm. The panels in G, show average line profiles of the BFP-SKL, Erg6-2xmKate and TglX-GFP signal around lipid droplets. The lines started at the opposite end of the peroxisome contact site, and aligned using the maxima of the BFP-SKL signal. 10 Cells were averaged for each strain. The final panel shows an overlay of the average line profiles of the different Tgl lipases, to compare the relative intensities.
Fig. 6
Fig. 6
Overexpression of Pex3 leads to morphological changes in lipid droplets and peroxisomes in Drosophila melanogaster. (A, E) Diagrams of the cuts from Drosophila melanogaster that were analyzed. Larval midgut (A) and midgut from adult flies (B) were analyzed. (B–D) Representative images of control cells and strains overexpressing Pex3 in larval gut. Control cells express the GFP-SKL construct to visualize the lumen of the peroxisomes, while cells with overexpressed Pex3 also contain a GFP tag. Lipid droplets were stained with Bodipy and the nucleus with DAPI. Scale bars: 20 μm. Panels C and D show the quantification of the number of LDs (C) and peroxisomes (D). (F–H) Representative images of cells from the adult midgut from control flies and flies overexpressing Pex3. Control cells express the GFP-SKL construct to visualize the lumen of the peroxisomes, while cells with overexpressed Pex3 also contain a GFP tag. Lipid droplets were stained with Bodipy and the nucleus with DAPI. Scale bars: 20 μm. Panels G and H show the quantification of the number of LDs (C) and peroxisomes (D). (I) Representative Images of cells from adult flies midgut overexpressing Pex3-HA. Cells also express YFP-SKL to label the lumen of peroxisomes and lipid droplets were labeled with Bodipy. The enlarged organelles are observed in close proximity, with complementary morphological changes, suggesting the formation of membrane contact sites.

References

    1. Wanders, R. J. A., Baes, M., Ribeiro, D., Ferdinandusse, S. & Waterham, H. R. The physiological functions of human peroxisomes. Physiol. Rev.103, 957–1024 (2023). - PubMed
    1. Scorrano, L. et al. Coming together to define membrane contact sites. Nat. Commun.10, 1–11 (2019). - PMC - PubMed
    1. Eisenberg-Bord, M., Shai, N., Schuldiner, M. & Bohnert, M. A tether is a tether is a tether: Tethering at membrane contact sites. Dev. Cell39, 395–409 (2016). - PubMed
    1. Prinz, W. A., Toulmay, A. & Balla, T. The functional universe of membrane contact sites. Nat. Rev. Mol. Cell Biol.21, 7–24 (2020). - PMC - PubMed
    1. Valm, A. M. et al. Applying systems-level spectral imaging and analysis to reveal the organelle interactome. Nature546, 162–167 (2017). - PMC - PubMed

MeSH terms

LinkOut - more resources