. 2025 Jul 8;5(1):281.
doi: 10.1038/s43856-025-00984-7.

Integrated multi-omics of feces, plasma and urine can describe and differentiate pediatric active Crohn's Disease from remission

Affiliations

Integrated multi-omics of feces, plasma and urine can describe and differentiate pediatric active Crohn's Disease from remission

Nienke Koopman et al. Commun Med (Lond). .

Abstract

Background: This study aimed to obtain a holistic view of remission in pediatric Crohn's Disease (CD) by integrating six omics datasets from three anatomical compartments.

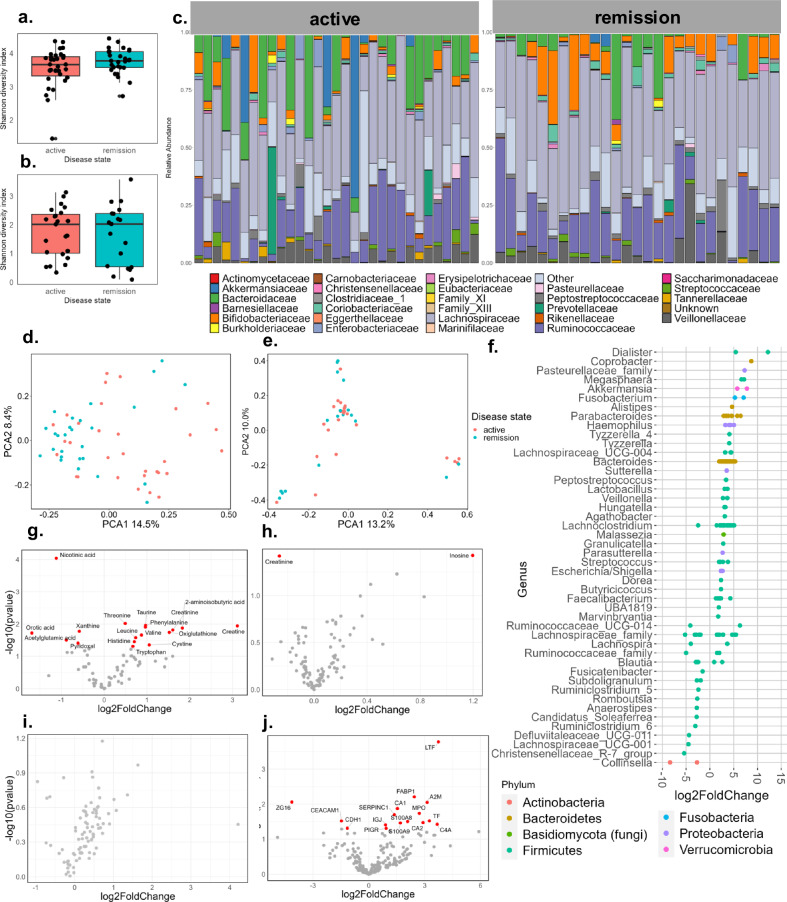
Methods: Patients with fecal calprotectin below 250 mg/kg were considered in remission (n = 27), above 250 mg/kg as having active disease (n = 31). Proteome and microbiomes (fungi and bacteria) were analyzed in feces. Metabolomes in feces, urine, and plasma. Datasets were integrated into a multi-omics model.

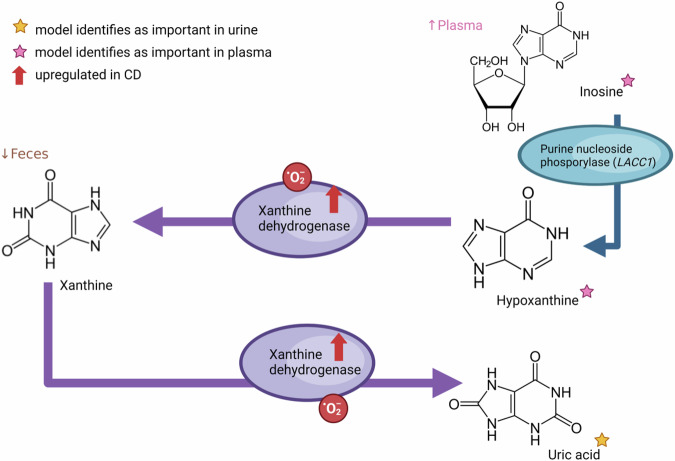
Results: The use of individual datasets shows multiple differences between remission and active disease. Integration yielded a good model (AUC of 0.8) predicting remission. The most important features in this model are fecal bacteria (40%), fecal metabolites (22%), fecal proteins (16%), plasma metabolites (12%), fecal fungi (6%), and urine metabolites (4%). The interactome reveals Ruminococcaceae and Faecalibacterium as key players, with a correlation between antifungal urine hydroxyphenyllactic acid and fecal fungi. Pathway analysis shows an association of purine metabolism with remission, independent of thiopurine use. Changes in purine metabolism are confirmed in a pediatric CD public dataset.

Conclusion: The pathways and correlations identified as playing a role in remission may remain undetectable if individual omics datasets or single anatomical compartments are used, highlighting the need for a holistic approach that integrates multiple datasets from multiple anatomical compartments.

Plain language summary

Crohn’s disease is a severe inflammation of the intestine, characterized by periods of remission and active disease. Intestinal bacteria and fungi, and compounds produced by these organisms and the patient, all play a role in the development of Crohn’s disease. Because patients were able to submit feces, blood, and urine, we could determine how these factors interact and are different between patients with active disease and in remission. This was the first time all these different factors could be measured in the same patient, allowing a holistic and molecular look at patients with Crohn’s disease. We identified key bacteria and pathways that are important in the remission of Crohn’s disease. Our research may point at new directions for the treatment of this severe disease.


Figures

Fig. 1
Fig. 1. Multi-omics in Crohn’s disease patients with active disease and remission.
a Alpha diversity for bacteria (Shannon Diversity index) does not show a significant difference. b Alpha diversity for fungi by the Shannon Diversity index does not show a significant difference. c Relative abundance at family level, left panel patients with active disease, and right panel patients in remission. d Principal coordinates analysis (PCoA) on 16S species level Bray-Curtis dissimilarity shows a significant dissimilarity (P = 0.029). e PCoA on ITS species level Bray-Curtis dissimilarity does not show two distinct groups. f Significant bacterial and fungal ASVs/OTUs with corresponding Log2Fold change, positive values correlate with an increase in active disease while negative values correlate with an increase in remission. Volcano plot (g) fecal metabolomics, h plasma metabolomics, i urine metabolomics and j proteomics: a positive log2FoldChange corresponds with an increase in active disease while negative values correspond with an increase in remission. Non-adjusted p-values are shown, with red colored dots for significant non-adjusted p-values. For all plots n = 27 for the remission group and n = 31 for the active group.
Fig. 2
Fig. 2. Machine learning model for integration of—omics datasets reveals inter- and intra-compartmental correlations.
a Pie-chart showing that from the top 50 features, 40% belong to the bacteria, 22% to the fecal metabolites, 16% to the proteome, 12% to the plasma metabolites, 6% to the fungi, and 4% to the metabolites in urine. b Average receiver operating characteristic (ROC) curve of the machine learning model (AUC = 0.80). Interactome plots depicting (c) inter and intra compartmental correlations between top 10 features of each dataset (d) inter compartmental correlations between top 10 features of each dataset (e) inter and intra compartmental correlations between top 50 features of all data (f) inter compartmental correlations between top 50 features of all data. Correlations are based on Spearman correlation coefficients with the thickness of the lines representing the strength of the correlation and the color the direction of the correlation (blue for positive and red for negative). The node color resembles the dataset and the sizes the importance of the feature for differentiating between active disease and remission.
Fig. 3
Fig. 3. Overview of alterations in the purine pathway during active Crohn’s Disease as observed in this study.
Inosine is converted to hypoxanthine by purine nucleoside phosphorylase (PNP), hypoxanthine is converted to xanthine, and xanthine is converted to uric acid by xanthine oxidase (XO), which is encoded by the xanthine dehydrogenase (XDH) gene, generating oxidative stress. XDH is upregulated in CD patients compared to healthy controls. We measured increased inosine in plasma and reduced xanthine in fecal water of active disease patients and identified inosine and hypoxanthine in plasma and uric acid as important in discriminating between active disease and remission with a machine learning model.
Fig. 4
Fig. 4. Metabolomics in thiopurine users.
Volcano plot (a) fecal, (b) plasma and urine (c) metabolomics, a positive log2FoldChange corresponds with an increase in users while negative values correspond with an increase in non-users. Non-adjusted p-values are shown, with red colored dots for significant non-adjusted p-values. For all plots n = 27 for the remission group and n = 31 for the active group.
Fig. 5
Fig. 5. Single-cell RNA-sequencing data analysis in public data.
A Dotplot visualization of the gene expression where size and color intensity represent the percentage cells with measurable expression and the median expression, respectively. B Arrowplot visualization of the differences in gene expression where the direction and color of the arrow indicates higher (red) or lower (green) expression relative to the control subjects. Full arrows represent genes that were found to be statistically significantly different in expression with the size representing the level of significance.

References

    1. Mitchel, E. B. & Rosh, J. R. Pediatric management of Crohn’s disease. Gastroenterol. Clin. North Am.51, 401–424 (2022). - PubMed
    1. Conrad, M. A. & Rosh, J. R. Pediatric inflammatory bowel disease. Pediatr. Clin. North Am.64, 577–591 (2017). - PubMed
    1. Fitzgerald R.S., Sanderson I.R., Claesson M.J. Paediatric inflammatory bowel disease and its relationship with the microbiome. Microb. Ecol. 10.1007/s00248-021-01697-9 (2021). - PMC - PubMed
    1. Ananthakrishnan, A. N. Environmental risk factors for inflammatory bowel diseases: a review. Dig. Dis. Sci.60, 290–298 (2015). - PMC - PubMed
    1. Loddo, I. & Romano, C. Inflammatory bowel disease: genetics, epigenetics, and pathogenesis. Front. Immunol.6, 551 (2015). - PMC - PubMed

LinkOut - more resources