. 2025 Jul 8;8(1):1019.
doi: 10.1038/s42003-025-08409-w.

Single-cell analysis links DCUN1D5 to immune remodeling and cisplatin resistance in recurrent osteosarcoma

Affiliations

Single-cell analysis links DCUN1D5 to immune remodeling and cisplatin resistance in recurrent osteosarcoma

Xin Wu et al. Commun Biol. .

Abstract

Cisplatin is the primary chemotherapeutic agent for osteosarcoma. However, a significant proportion of patients develop resistance post-treatment, leading to disease recurrence and presenting profound clinical challenges. To understand the mechanisms underlying osteosarcoma recurrence and cisplatin resistance, particularly from the tumor microenvironment perspective, we consolidated numerous single-cell RNA sequencing datasets, offering an encompassing insight into the osteosarcoma microenvironment. When juxtaposing scRNA-seq with bulk RNA-seq data, we observed a strong correlation between high DCUN1D5 expression in osteosarcoma and patient survival. This gene amplifies osteosarcoma's anti-apoptotic, invasive, stem-cell-like traits and PI3K/AKT/GSK3β pathway phosphorylation and fosters cisplatin resistance. Subsequent research revealed that cisplatin-resistant osteosarcoma cells excrete DCUN1D5-rich exosomes, facilitating the maturation of osteoclast precursors. Excessive osteoclast activity is a pivotal contributor to osteosarcoma recurrence and resistance. Given these insights, DCUN1D5 is a promising therapeutic target for osteosarcoma recurrence and drug resistance.


Conflict of interest statement

Competing interests: The authors declare no competing interests. The authors declare no competing interests. Figure 6I, Figure S13A and graphic abstract, was created with BioRender software ( https://biorender.com/ , accessed on 3 March 2023). Ethical approval: All animal care and experimental procedures were conducted in accordance with the guidelines and were approved by the Ethics Committee of the Department of Laboratory Animal Science, Central South University (Approval Number: CSU-2022-0664; Approval Date: October 10, 2022). We have complied with all relevant ethical regulations for animal use.

Figures

Fig. 1
Fig. 1. Transcriptomic analysis of osteosarcoma at the single-cell level.
A Dendrogram showcasing cell clustering across varying resolutions, highlighting the stability of cluster formation and the impact of resolution choice on cell grouping. This analysis was conducted using clustree to evaluate the robustness of the clustering algorithm. B t-SNE and UMAP representations of single-cell transcriptomes from 17 osteosarcoma samples and six osteosarcoma tumor-infiltrating lymphocyte (TIL) samples. These plots demonstrate the homogeneous distribution of cells across samples, indicating the successful normalization of the data. C t-SNE and UMAP visualization of the ten primary cell types identified within osteosarcoma samples based on the expression of previously curated marker genes. This panel illustrates the cellular diversity within the tumor microenvironment and the distinct transcriptional profiles of each cell type. D Bar graphs depicting the proportional representation of cell clusters in the 17 osteosarcoma samples and six osteosarcoma-TIL samples. This panel highlights the heterogeneity of cell populations across different lesions and the consistency of specific cell types within the tumor microenvironment. E Dot plot detailing the expression of 23 feature genes across the ten identified cell clusters. The size of each dot corresponds to the proportion of cells within a cluster expressing a specific marker gene. At the same time, the color gradient represents the average expression level of that marker. This plot provides insights into the marker gene expression patterns that define each cell cluster and their relative abundance.
Fig. 2
Fig. 2. Comprehensive analysis of cell communication patterns in the osteosarcoma tumor microenvironment.
A The number of output patterns is estimated using the Cophenetic and Silhouette indices to identify different communication patterns between cell subgroups. Based on the indices, the output pattern number is selected as 4. B Cell subtypes and their associated signaling pathways are identified, and the composition of the output patterns is analyzed to reveal the specific roles of different cell populations in regulating the communication network. C Outgoing communication patterns are shown in a Sankey diagram, providing a clearer reflection of the correspondence between specific cell types, patterns, and signaling. D A dot plot of signaling pathways displays the specific outgoing signals from various cell types as output cells. E The number of input patterns is estimated using the Cophenetic and Silhouette indices to identify different communication patterns between cell subgroups. Based on the indices, the output pattern number is selected as 2. F Cell subtypes and their associated signaling pathways are identified, and the composition of the input patterns is analyzed to reveal the specific roles of different cell populations in regulating the communication network. G Incoming communication patterns are shown in a Sankey diagram, providing a clearer reflection of the correspondence between specific cell types, patterns, and signaling. H A dot plot of signaling pathways displays the specific incoming signals to various cell types as input cells.
Fig. 3
Fig. 3. Differences in cell communication between primary and recurrent osteosarcoma patients.
A Quantification of cell interactions in primary and recurrent osteosarcoma, showing the total number of communication events in both conditions. Both primary and recurrent osteosarcomas exhibit complex communication. B Visualization of changes in interaction counts or intensity during recurrence, with red representing enhanced expression and blue representing reduced expression. Recurrent osteosarcoma displays distinct communication quantities and intensities. C Comparison of interaction frequency and intensity between primary and recurrent osteosarcoma, with recurrent cases showing higher communication activity. D Heatmap illustrating the differences in interaction quantity or intensity, providing a visual comparison of cell communication features between primary and recurrent osteosarcoma. E Two-dimensional spatial juxtaposition analysis showing the distribution and directionality of interactions between signal sources and targets in primary and recurrent osteosarcoma patients. In recurrent osteosarcoma, osteosarcoma cells and osteoclasts occupy significant positions. F Detailed flow analysis of signaling pathways, revealing the complexity and diversity of the cell communication network. Signaling pathways such as MIF, FGF, PTN, RESISTIN, ANGPTL, ncWNT, UGRP1, IL16, OSM, and BAG are significantly upregulated in recurrent osteosarcoma. G Comparison of egress signals from different cell populations, highlighting changes in outward signaling between different cell groups. H Analysis of ingress signals in each cell population, reflecting differences in how different cell groups receive signals. I Overall signaling network overview, revealing the signaling patterns of various cell populations and their roles in cell communication.
Fig. 4
Fig. 4. Regulatory role of DCUN1D5 in osteosarcoma.
A Venn diagram depicting the overlap between E3 and genes overexpressed in OS, highlighting the 21 OS-E3s identified from 2142 E3 and 727 differentially expressed genes in osteogenic osteosarcoma cells. B The Kaplan-Meier survival curves show the correlation between DCUN1D5 and overall survival (OS) in the TARGET-OS and GSE21257 databases. C Uniform Manifold Approximation and Projection (UMAP) representation of DCUN1D5 expression patterns, categorizing osteogenic osteosarcoma cells into high and low expression groups based on DCUN1D5’s median expression. D Volcano plot of genes differentially expressed based on DCUN1D5 levels, illustrating the significant upregulation and downregulation of genes in high DCUN1D5-expressing cells. E Gene Ontology (GO) analysis of the differentially expressed genes revealed associations with the extracellular matrix, immune system regulation, protease activity, and cellular components like ribosomes and organelle cavities. F Gene Set Variation Analysis (GSVA) of the differentially expressed genes, showing upregulation of metabolic and functional pathways related to ubiquitin-mediated proteolysis, vesicle transport, and energy metabolism in cells with high DCUN1D5 expression. G Kyoto Encyclopedia of Genes and Genomes (KEGG) analysis of the differentially expressed genes, indicating enrichment in ribosome pathways, cancer-related proteoglycans, and various oncogenic processes. H Gene Set Enrichment Analysis (GSEA) of the differentially expressed genes, demonstrating elevated metabolism, oxidative phosphorylation, and reactive oxygen species in cells with high DCUN1D5 expression.
Fig. 5
Fig. 5. DCUN1D5’s influence on the tumor microenvironment (TM) in osteosarcoma.
A Immune Infiltration Analysis Across Osteosarcoma Samples. This panel displays the variation in immune cell infiltration across different osteosarcoma patient samples, highlighting the heterogeneity in tumor immune landscapes. B Proportional Representation of Cell Types in the Osteosarcoma Tumor Microenvironment. This panel illustrates the relative abundance of different cell types, including malignant osteogenic cells, fibroblasts, and osteoclasts, within the tumor microenvironment of osteosarcoma patients. C Correlation Analysis of DCUN1D5 Expression with Microenvironmental Cells in Osteosarcoma. This panel shows the strength and direction of the association between DCUN1D5 expression levels and the presence of various cell types within the osteosarcoma tumor microenvironment, indicating potential interactions and the influence of DCUN1D5 on the tumor’s cellular composition.
Fig. 6
Fig. 6. DCUN1D5-mediated dysregulation in osteoclast maturation and activation in osteosarcoma.
A Monocle 2 trajectory analysis illustrates osteoclast subpopulations’ distribution and clustering, highlighting distinct developmental stages. B Detailed subgroup classification within the osteoclast lineage, emphasizing the heterogeneity and complexity of cell types. C Temporal progression of osteoclast differentiation, depicting the dynamic changes in cell states over time. D The Spatial representation of DCUN1D5 expression levels across different osteoclast subclusters showcases its predominant expression in specific developmental phases. E Monocle 3 trajectory visualization, offering a comprehensive view of osteoclast subtype dynamics, from precursors to mature and non-functional states. F Patterns of DCUN1D5 expression throughout the osteoclast maturation process, indicating its crucial role in the transition between cell stages. G Heatmap with hierarchical clustering, presenting the developmental timelines of osteoclast subtypes and their associated marker genes, elucidating the molecular signatures defining each stage. H Differential clustering heatmap highlights the distinct developmental pathways emerging from branch point 4, focusing on the differentiation trajectories leading to immature, mature, and non-functional osteoclasts. I Schematic representation of DCUN1D5’s pivotal role in directing the differentiation of precursor osteoclasts towards their active and functional mature forms, thereby influencing osteosarcoma progression through abnormal osteoclast activation.
Fig. 7
Fig. 7. Increased osteosarcoma drug resistance due to DCUN1D5 upregulation.
A Correlation between DCUN1D5 expression and the half-maximal inhibitory concentration (IC50) values of various drugs in osteosarcoma tissue samples from the TARGET database. Each point represents a different drug, with the x-axis indicating DCUN1D5 expression levels and the y-axis showing the corresponding IC50 values. A positive correlation suggests that higher DCUN1D5 expression is associated with increased drug resistance. B Correlation between DCUN1D5 expression and the IC50 values of drugs in osteosarcoma tissue samples from the GSE21257 database. Like panel A, this graph demonstrates the relationship between DCUN1D5 expression and drug resistance, further supporting the hypothesis that DCUN1D5 plays a role in multidrug resistance in osteosarcoma. C Molecular interaction analysis between DCUN1D5 and primary osteosarcoma treatments, including methotrexate, doxorubicin, cisplatin, and Cyclophosphamide. The binding affinity values represent the interaction strength, with stronger interactions indicating a higher potential for DCUN1D5 to influence drug efficacy. This analysis highlights the potential of DCUN1D5 as a therapeutic target for overcoming drug resistance in osteosarcoma.
Fig. 8
Fig. 8. In vitro validation of DCUN1D5’s tumorigenic potential.
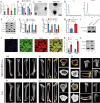
A Growth quantification of both sensitive and drug-resistant osteosarcoma cell lines using CCK-8. *P < 0.05. B qRT-PCR assessment of DCUN1D5 levels in osteosarcoma and cisplatin-resistant cell lines. C Western blot analysis of protein expression. D Confocal imaging of DCUN1D5 in both sensitive and resistant osteosarcoma cells. E Observation of tumor spheroid formation post-DCUN1D5 knockdown in resistant cells. F 3D culture analysis post-DCUN1D5 knockdown in resistant cells. G Flow cytometric analysis of osteosarcoma cell apoptosis at 48 h. H Quantitative apoptosis assessment in osteosarcoma cells. ***P < 0.001 vs. SiRNA-NC. I a Si-NC, b Si-DCUN1D5 were co-cultured with U-2OS/CDDP cells for 24 h, c Si-NC, d Si-DCUN1D5 were co-cultured with MG63/CDDP cells for 24 h. J a Oe-NC, b Oe-DCUN1D5 were co-cultured with U-2OS/CDDP cells for 24 h, c Oe-NC, d Oe-DCUN1D5 were co-cultured with MG63/CDDP cells for 24 h. protein expression of PI3K/AKT/GSK3β signal path biomarkers were identified via immunoblotting. The quantitation data from the immunoblotting analysis were analyzed via the ImageJ program, which was expressed as mean ± SD.
Fig. 9
Fig. 9. In vivo validation of DCUN1D5’s role in osteosarcoma tumorigenesis.
A Representative images of subcutaneous tumors in NSG mice from different treatment groups, illustrating the impact of DCUN1D5 silencing on tumor size. B Quantitative analysis of tumor volumes in NSG mice over time. Tumor volume (V) was calculated using the formula V = (a x b^2) / 2, where ‘a’ is the longest diameter and ‘b’ is the shortest diameter of the tumor. C Comparison of tumor weights between different groups of NSG mice, highlighting the effect of DCUN1D5 knockdown on tumor growth. D Immunofluorescence staining for DCUN1D5 in dissected tumor tissues, demonstrating the downregulation of DCUN1D5 expression in the Si-DCUN1D5 group compared to the Si-NC group. E Hematoxylin and eosin (H&E) staining of tumor sections, revealing the histological changes and reduced structural integrity of tumor cells in the Si-DCUN1D5 group. F TUNEL assay and Ki-67 immunofluorescence staining in tumor sections to assess apoptosis and proliferation, respectively. The increased number of TUNEL-positive apoptotic cells and the reduced Ki-67 expression in the SiRNA-DCUN1D5 group compared to the SiRNA-NC group indicate the pro-apoptotic and anti-proliferative effects of DCUN1D5 silencing in vivo. Statistical significance is denoted by ***P < 0.005 vs. SiRNA-DCUN1D5.
Fig. 10
Fig. 10. Exosomes secreted by osteosarcoma drug-resistant cell lines enhance osteoclast differentiation and bone resorption.
A DCUN1D5 expression in the culture medium (CM) of osteosarcoma parental and drug-resistant cell lines analyzed using qPCR. B DCUN1D5 expression in MG63 and MG63/CDDP cell lines after treatment with control medium, RNase A (2 mg/mL), or a combination with Triton X-100 (0.1%) for 0.5 h, assessed by qPCR. C Transmission microscopy-based phenotypic analysis of exosomes derived from MG63 cells, and (D) MG63/CDDP nanoparticle tracking with Nano Sight. E Detection of exosome biomarkers (TSG101, CD9, ALIX) in osteosarcoma cell lines using Western blotting. F, G qPCR assessment of DCUN1D5 expression in CM of osteosarcoma cells after exosome depletion using GW4869 (F) or ultracentrifugation (G), compared to MG63 and MG63/CDDP CM. H, I Comparative analysis of DCUN1D5 expression in osteosarcoma-derived exosomes and those from cisplatin-resistant cells using qRT-PCR (H) and Western blotting (I). J Uptake of PKH26 (red)-labeled exosomes by CFSE (green)-labeled RAW264.7 cells, visualized using confocal microscopy. K, L MMP9 and CTSK expression were analyzed using QRT-PCR and Western blotting. *P < 0.05, **P < 0.01, ***P < 0.001. M, P are three-dimensional gross images of the femur in the exosome treatment group and the control group, respectively. (N, Q) are images of various important sections of the femur in the exosome treatment group and the control group, respectively. O, R are images of various important sections and three-dimensional gross images of the tibia in the exosome treatment group and the control group, respectively.
None

Similar articles

References

    1. Tang, N. et al. Single-Cell Spatial-Temporal Analysis of ZNF451 in Mediating Drug Resistance and CD8<SUP>+</SUP> T Cell Dysfunction. Research7, 23 (2024). - PMC - PubMed
    1. Qiu, J. et al. Dissecting the Distinct Tumor Microenvironments of HRD and HRP Ovarian Cancer: Implications for Targeted Therapies to Overcome PARPi Resistance in HRD Tumors and Refractoriness in HRP Tumors. Adv. Sci. (Weinh.)11, e2309755 (2024). - PMC - PubMed
    1. Yang, L. et al. Synergetic Functional Nanocomposites Enhance Immunotherapy in Solid Tumors by Remodeling the Immunoenvironment. Adv. Sci. (Weinh.)6, 1802012 (2019). - PMC - PubMed
    1. Jin, H. et al. Tumor Ablation and Therapeutic Immunity Induction by an Injectable Peptide Hydrogel. ACS Nano12, 3295–3310 (2018). - PubMed
    1. Low, J. T., Ho, P. C. & Matsushita, M. TAM-tastic: from resistance to resilience in cancer. Trends Pharm. Sci.45, 953–954 (2024). - PubMed

MeSH terms

LinkOut - more resources