. 2025 Jul 8;9(1):230.
doi: 10.1038/s41698-025-00994-7.

Modulating ovarian cancer progression through FDX1-driven autophagy

Affiliations

Modulating ovarian cancer progression through FDX1-driven autophagy

Chang Liu et al. NPJ Precis Oncol. .

Abstract

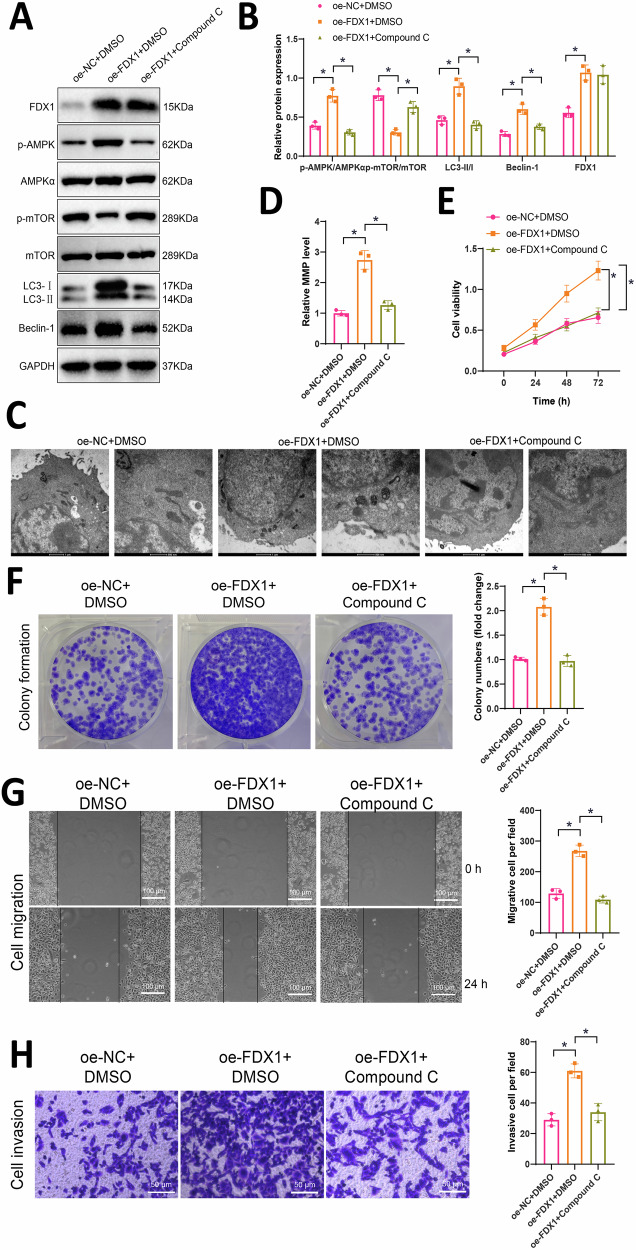
Ferredoxin 1 (FDX1) emerges as a crucial regulator of autophagy and copper metabolism in ovarian cancer (OC), as revealed by this investigation. Predominantly localized to the cytoplasm and mitochondria, FDX1 coordinates autophagic activity by modulating the AMPK and mTOR signaling pathways. Its role extends to preserving mitochondrial integrity and facilitating sulfation of DLAT/DLST, ensuring effective autophagic flux. Knockdown of FDX1 disrupts these processes, exacerbating mitochondrial dysfunction. In vivo studies further demonstrate that overexpressing FDX1, combined with Compound C treatment, markedly inhibits tumor growth and Ki67 expression. These results position FDX1 as a promising target for therapeutic strategies aimed at exploiting autophagy to hinder OC progression.


Conflict of interest statement

Competing interests: The authors declare no competing interests.

Figures

Fig. 1
Fig. 1. Differential expression of FDX1 in OC and normal samples.
A Analysis of FDX1 mRNA levels in tumor tissues and normal tissues samples based on TCGA and GTEx data, *** indicates P < 0.001; B Analysis of FDX1 mRNA levels in tumor samples of patients with different Tumor grades based on TCGA data; C Analysis of FDX1 mRNA levels in tumor samples of different p53 mutation types based on TCGA data; D Analysis of FDX1 protein expression levels in tumor tissues and normal tissues samples based on CTPAC data; E Analysis of FDX1 protein expression levels in tumor samples of patients with different Tumor grades based on CTPAC data; F Analysis of FDX1 protein expression levels in tumor samples of different p53 mutation types based on CTPAC data; G Expression analysis of FDX1 in various OC cell lines using the HPA database.
Fig. 2
Fig. 2. Identification and functional enrichment analysis of FDX1-related genes.
A Heatmap of FDX1-related genes in TCGAOC; B GO functional enrichment analysis of FDX1-related genes; C KEGG enrichment analysis of FDX1-related genes.
Fig. 3
Fig. 3. Expression of FDX1 in clinical samples of OC patients and its association with autophagy levels.
RT-qPCR (A), Western blot (B), and immunohistochemistry (C) were utilized to assess the expression levels of FDX1 in Normal and OC groups, with scale bars = 50 μm; D Western blot was performed to analyze the expression levels of LIAS and Lipoy-DLAT in Normal and OC groups; E Copper ion concentration in Normal and OC groups was measured using a assay kit; F Correlation analysis between FDX1 protein expression and copper ion concentration in tumor tissue samples from OC patients; G Western blot analysis of the expression levels of LC3-II/I and Beclin-1 in Normal and OC groups; H Correlation analysis of FDX1 and LC3-II/I protein expression in tumor tissue samples from OC patients; I Correlation analysis of FDX1 and Beclin-1 protein expression in tumor tissue samples from OC patients; J Mitochondria labeled with MitoTracker (in red) and FDX1 (in green), white arrows indicate representative mitochondria in OC cells stained with FDX1 and MitoTracker, with scale bars = 25 μm and 15 μm; Normal group, n = 3, OC group, n = 20.
Fig. 4
Fig. 4. Impact of FDX1 overexpression/silencing on copper metabolism and autophagy in OC cells.
A Copper ion concentrations were measured using a reagent kit; B Western blot analysis was performed to assess the protein expression of LIAS and Lipoy-DLAT in the cell groups; C Cell viability and growth were determined by treating cells with different concentrations of elesclomol-Cu (ratio = 1:1) for 72 h, followed by CCK-8 assay; D Clonogenic assay was used to evaluate the proliferation capacity of the cell groups; E Scratch assay was conducted to assess cell migration ability, where scale bar = 100 μm; F Transwell assay was employed to measure cell invasion ability, with a scale bar = 50 μm; G Western blot analysis was utilized to detect the protein expression of LC3-II/I and Beclin-1 in the cell groups; H Mitochondrial membrane potential was examined using JC-1 staining; I Mitochondrial morphology was observed by transmission electron microscopy, where scale bar = 500 nm/1 μm; * indicates P < 0.05 compared to the oe-NC or sh-NC groups, and all cell experiments were repeated three times.
Fig. 5
Fig. 5. The impact of FDX1 on the AMPK/mTOR signaling pathway in OC cells: proliferation, migration, invasion, and autophagy.
A Western blot analysis was performed to evaluate the expression of AMPK/mTOR signaling pathway-related factors and autophagy-related proteins in each group of cells; B Quantitative results of Figure A; C Observation of mitochondrial morphology in cells by transmission electron microscopy, where scale bar=500 nm/1 μm; D Detection of mitochondrial membrane potential using JC-1; E Cell viability assessed by CCK-8 assay in each group of cells; F Colony formation assay to evaluate the proliferation capacity of each group of cells; G Scratch assay measuring the migration ability of each group of cells, with a scale bar of 100 μm; H Transwell assay determining the invasion ability of each group of cells, with a scale bar of 50 μm; * represents statistical significance compared to the oe-NC + DMSO group or oe-FDX1 + DMSO group at P < 0.05; all cell experiments were repeated three times.
Fig. 6
Fig. 6. FDX1 mediates the effects of AMPK/mTOR signaling pathway on tumor growth in vivo.
A Western blot analysis was performed to evaluate the expression of FDX1, AMPK/mTOR signaling pathway-related factors, and autophagy-related proteins in each group of cells; B Tumor growth at different time points was monitored by measuring bioluminescence intensity; C Morphology of tumor tissues from each group of mice, with 3 representative examples shown for each group; D Tumor tissue weights for each group of mice; E Immunohistochemical staining was conducted to assess the protein expression levels of Ki67, LC3B and p62 in tumor tissues of each group of mice, with a scale bar of 50 μm; F Statistical analysis of Ki67, LC3B and p62 positive expression; * indicates P < 0.05 compared to the oe-NC + DMSO group or oe-FDX1 + DMSO group, with 5 mice in each group.
Fig. 7
Fig. 7
Diagram illustrating the molecular mechanism by which the copper-induced cell death-related gene FDX1 is involved in the progression of OC (Created with BioRender.com).

Similar articles

References

    1. Kocarnik, J. M. et al. Cancer incidence, mortality, years of life lost, years lived with disability, and disability-adjusted life years for 29 Cancer Groups From 2010 to 2019, American Medical Association (AMA), (2022). - PMC - PubMed
    1. Weiland, F. et al. Ovarian Blood Sampling Identifies Junction Plakoglobin as a Novel Biomarker of Early Ovarian Cancer, Frontiers Media SA, (2020). - PMC - PubMed
    1. Penny, S. M. Ovarian Cancer: An Overview. Radio. Technol.91, 561–575 (2020). - PubMed
    1. Stewart, C., Ralyea, C. & Lockwood, S. Ovarian Cancer: An Integrated Review, Elsevier BV, (2019). - PubMed
    1. Morand, S., Devanaboyina M., Staats H., Stanbery L. & Nemunaitis J. Ovarian Cancer Immunotherapy and Personalized Medicine, MDPI AG, (2021). - PMC - PubMed

LinkOut - more resources