. 2025 Jul;7(7):1322-1329.
doi: 10.1038/s42255-025-01324-8. Epub 2025 Jul 8.

CagriSema drives weight loss in rats by reducing energy intake and preserving energy expenditure

Affiliations

CagriSema drives weight loss in rats by reducing energy intake and preserving energy expenditure

Julie Mie Jacobsen et al. Nat Metab. 2025 Jul.

Abstract

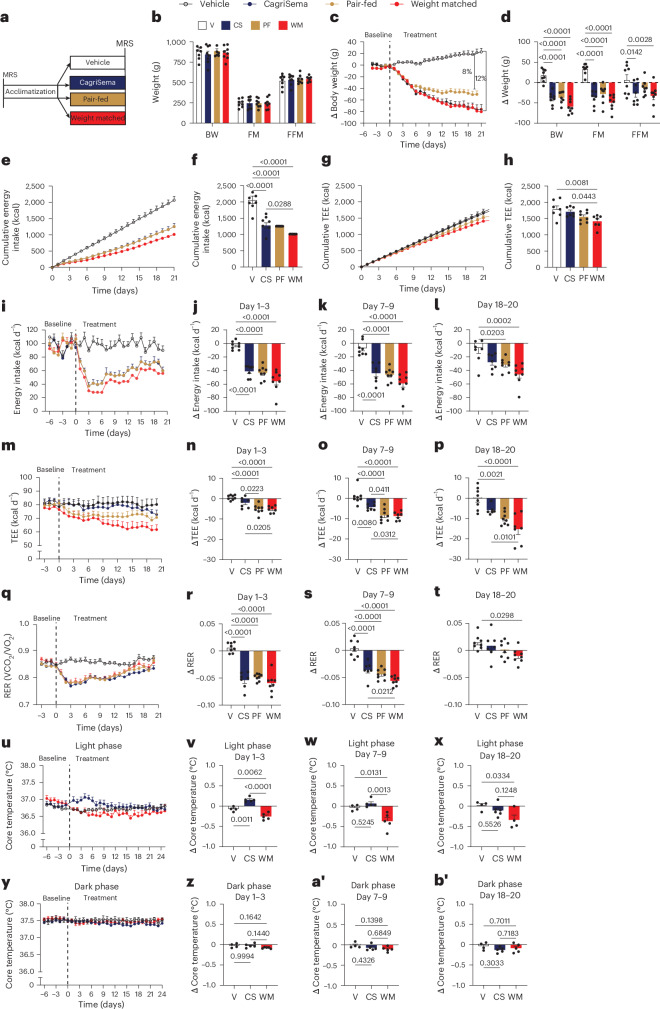
CagriSema is a combination of amylin (cagrilintide) and glucagon-like peptide-1 (semaglutide) analogues being developed for weight management. Here, we show that CagriSema blunts metabolic adaptation in rats. Quantifying CagriSema's action on energy intake and expenditure in rats we observe 12% weight loss with a 39% reduction in food intake. By contrast, pair-feeding causes less-pronounced weight loss, while weight matching requires a 51% decrease in food intake. Therefore, approximately one-third of CagriSema's weight loss efficacy arises from an effect on energy expenditure, the blunting of metabolic adaptation, which contributes to the successful treatment of obesity.


Conflict of interest statement

Competing interests: J.M.J., J.F.H., I.B., J.M.M., B.H., K.P., J.J.F., S.S., A.S., S.L., K.R. and R.E.K. are employed by Novo Nordisk A/S, and some are minor shareholders in Novo Nordisk A/S. The other authors declare no competing interests. All authors declare that this work was not influenced by economic or other types of conflicting interest.

Figures

Fig. 1
Fig. 1. CagriSema drives weight loss by acting on both EI and EE.
a, Study design. b, Baseline body weight (BW), fat mass (FM) and fat free mass (FFM). c, Body weight time course during treatment. d, Change in body weight, fat mass and fat free mass between day −5 and day 21. e,f, Cumulative energy intake (EI). g,h, Cumulative total energy expenditure (TEE). il, Daily EI. mp, Daily TEE. qt, Respiratory exchange ratio (RER). ux, Light phase body temperature. yb′, Dark phase body temperature. In ib′, each row shows the time course followed by the change from baseline (mean of days −3 to −1) to the mean of days 1–3, 7–9 or 18–20, as indicated. A dashed line indicates the first day of treatment. Body temperature is from a cohort detailed in Extended Data Fig. 3. Data are mean ± s.e.m., n = 10 or 11 per group (bt) and n = 4 or 5 per group (ub′). P values from one-way ANOVA with Tukey post hoc testing. VCO2, rate of CO2 production; VO2, rate of O2 consumption; MRS, magnetic resonance spectroscopy. Source data
Fig. 2
Fig. 2. Cagrilintide and semaglutide act individually on both EI and EE.
a, Study design. b, Baseline body weight (BW), fat mass (FM) and fat free mass (FFM). c, Body weight time course during treatment. d, Change in body weight, fat mass and fat free mass between day −6 and day 22. e,f, Cumulative energy intake (EI). g,h, Cumulative total energy expenditure (TEE). il, Daily EI. mp, Daily TEE. qt, RER. In i-t, each row shows the time course followed by the change from baseline (mean of days −3 to −1) to the mean of days 1–3, 7–9 or 18–20, as indicated. A dashed line indicates the first day of treatment. Data are mean ± s.e.m., n = 8 per group. P values from one-way ANOVA with Tukey post hoc testing. Rate of CO2 production; VO2, rate of O2 consumption. MRS, magnetic resonance spectroscopy. Source data
Fig. 3
Fig. 3. Prevention of metabolic adaptation is responsible for close to one-third of CagriSema-induced weight loss.
a,b, Contributions of energy intake (EI) and energy expenditure (EE) to body weight (BW) loss. Data are taken from Fig. 1c. cg, Effect of vehicle (V), drug (CS + C + S) or caloric restriction (WM + PF) treatments on final BW, EE and EI, and on the changes in these parameters. eg, Dotted lines are at the zero of each axis (represent no changes). h, Plasma leptin levels after the indicated treatments (taken data from Fig. 1 and Extended Data Figs. 1, 2 and 3). i,j, Upregulated and downregulated genes by treatment. Pathway enrichment analysis from liver can be found in Extended Data Fig. 7. Detailed statistical analyses are given in Extended Data Table 2 and Supplementary Table 1. Group size: a,b, n= 8; cg, n = 38 (V), n = 57 (CS + C + S), n = 50 (WM + PF); h, n = 40 (V), n = 35 (CS), n = 34 (WM); i,j, n = 4 (V, CS and WM). Data are presented as mean ± s.e.m. (a), absolute numbers (b, i and j) and as regression lines with 95% confidence bands (ch). Source data
Extended Data Fig. 1
Extended Data Fig. 1. Reproduction of main Fig. 1 results in an independent cohort.
(a) Study design. Treatments were vehicle (V), CagriSema (CS, 2 + 2 nmol/kg), and calorie-restricted to match the weight of the CS rats (weight matched, WM). (b) Body weight, fat mass and fat free mass at day −5. (c) Body weight time course, (d) change in body weight, fat mass (FM), and fat free mass (FFM) from day −5 to day 21. (e, f) Cumulative energy intake and (g, h) cumulative total energy expenditure (TEE). (i-l) Energy intake, (m-p) TEE, (q-t) dark phase EE, (u-x) light phase EE, (z-ab) respiratory exchange ratio (RER). In each set, the time course is followed by the change from baseline (mean of days −3 to −1) to the mean of days 1-3, 7-9, and 18-20, as indicated. Data are mean ± SEM, n = 10 (V) or n = 11 (CS and WM); P values from one-way ANOVA with Tukey post hoc testing.
Extended Data Fig. 2
Extended Data Fig. 2. No effect of treatment with CagriSema on physical activity.
(a) Study design. Treatments are vehicle (V), CagriSema (CS, 2 + 2 nmol/kg), and calorie-restricted to match the weight of the CS rats (weight matched, WM). (b) Body weight, fat mass and fat free mass at day −6. (c) Body weight time course, (d-f) change in (d) body weight, (e) fat mass, and (f) fat free mass from day −6 to day 6 and day 28. (g, h) Cumulative energy intake. (i) Baseline physical activity time course (days −4 to 0). Dark phase is indicated by shading. (j) Baseline dark and light phase activity levels. (k) Activity level time course on treatment days 22 to 26. (l) Treated dark and light phase activity levels. Data are mean ± SEM, n = 10/group, P values from one-way ANOVA with Tukey post hoc testing.
Extended Data Fig. 3
Extended Data Fig. 3. Characteristics of rats treated with CagriSema for body temperature measurement.
(a) Study design during indirect calorimetry. Treatments are vehicle (V), CagriSema (CS, 2 + 2 nmol/kg), and calorie-restricted to match the weight of the CS rats (weight matched, WM). (b) Body weight, fat mass and fat free mass at day −5. (c) Body weight time course, (d) changes in body weight, fat mass, and fat free mass from day −5 to 26. (e, f) Cumulative energy intake and (g, h) cumulative total energy expenditure (TEE). (i-l) Daily energy intake, (m-p) daily TEE, and (q-t) respiratory exchange ratio (RER). Body temperature dark or light phase (12 h bins) are in main Fig. 1u-ab. Data are mean ± SEM, n = 8/group. P-values from one-way ANOVA with Tukey post hoc testing.
Extended Data Fig. 4
Extended Data Fig. 4. Low efficacy of the individual CagriSema active agents.
(a) Study design during indirect calorimetry. Treatments are vehicle (V), cagrilintide (C, 2 nmol/kg), semaglutide (S, 2 nmol/kg), and calorie-restricted to match the weight of the CS rats (weight matched, WM). (b) body weight, fat mass and fat free mass at day −5. (c) Body weight time course. (d) change in fat mass and fat free mass from day −5 to 21. (e, f) Cumulative energy intake and (g, h) cumulative total energy expenditure (TEE). (i-l) Daily energy intake, (m-p) daily TEE, and (q-t) respiratory exchange ratio (RER). In each set, the time course is followed by the change from baseline (mean of days −3 to −1) to the mean of days 1-3, 7-9, and 18-20, as indicated. Data are mean ± SEM, n = 6-8/group.
Extended Data Fig. 5
Extended Data Fig. 5. Plasma concentrations ketone-bodies, glucose, glucagon, lipids, insulin, leptin, and liver inflammation markers.
Concentrations after 5-6 h fast. (a): Leptin, (b): Cholesterol, (c): Free fatty acids, (d): Glucose, (e): Glucagon, (f) Glycerol, (g): High-density lipoprotein (HDL), (h): Triglycerides, (i): Insulin, (j): 3-hydroxybuturate (3HB), (k) alanine transaminase (ALT), and (l) aspartate transaminase (AST). Data (all except leptin) are pooled from the experiments reported in main Fig. 1 and Extended Data Fig. 1). Leptin are from main Fig. 1, Extended Data Figs. 1, 2, 3, and 4). Data are mean ± SEM, n (all except leptin: V = 18, CS and WM = 19. n (leptin): V = 40, CS = 35, and WM = 34. Statistical significance was tested by One-way ANOVA followed by Tukey post hoc test. Colours: White: vehicle, Dark blue: CagriSema, and grey: weight matched.
Extended Data Fig. 6
Extended Data Fig. 6. Changes in plasma concentrations triiodothyronine (T3) and thyroxine (T4).
Samples are from rats in main Fig. 1. a: T3 and b: T4, c and d: T3 and T4 at baseline (day −5) and by end of treatment (day 21), Data are shown as means ± SEM. Dots are individual rats. n = 6-8/group. Statistical significance was tested by Oneway ANOVA. ANOVA-value was in both cases non-significant (P > 0.05). Abbreviations: V: vehicle, CS: CagriSema, and WM: Weight matched.
Extended Data Fig. 7
Extended Data Fig. 7. Principal component and pathway enrichment analysis.
Samples are from main Fig. 2. a and b: Principal component analysis of liver (a) and skeletal muscle gene expression (b). (c-e) Pathway enrichment analysis of liver transcriptomes; c: V vs. CS, d: V vs. WM, and e: CS vs. WM (n = 8). Abbreviations: V: vehicle, CS: CagriSema, WM: Weight matched.

References

    1. Melso, E., Ashraf, U., Papamargaritis, D. & Davies, M. J. What is the pipeline for future medications for obesity? Int. J. Obes.49, 433–451 (2025). - PMC - PubMed
    1. Leibel, R. L., Rosenbaum, M. & Hirsch, J. Changes in energy expenditure resulting from altered body weight. N. Engl. J. Med.332, 621–628 (1995). - PubMed
    1. Müller, M. J. & Bosy-Westphal, A. Adaptive thermogenesis with weight loss in humans. Obesity (Silver Spring)21, 218–228 (2013). - PubMed
    1. Johannsen, D. L. et al. Metabolic slowing with massive weight loss despite preservation of fat-free mass. J. Clin. Endocrinol. Metab.97, 2489–2496 (2012). - PMC - PubMed
    1. Keys, A., Brožek, J., Henschel, A., Mickelsen, O. & Taylor, H. L. The Biology of Human Starvation Vols 1 and 2 (Univ. Minnesota Press, 1951).

Substances