. 2025 Jul 8;15(1):93.
doi: 10.1186/s13613-025-01502-7.

Intra-hospital transport of adult critically ill patients treated with high flow nasal cannula oxygen: a prospective observational multicenter study

Affiliations

Intra-hospital transport of adult critically ill patients treated with high flow nasal cannula oxygen: a prospective observational multicenter study

Mai-Anh Nay et al. Ann Intensive Care. .

Abstract

Background: Acute respiratory failure is a common reason for admission to the intensive care unit, and patients are frequently treated with high-flow nasal cannula oxygen therapy (HFNC). Intra-hospital transport of critically ill patients, such as between hospital wards and the intensive care unit or for diagnostic exams, is common. Transportable HFNC can be used during these intra-hospital transports. We aimed to evaluate the complications associated with intra-hospital transport of patients treated with HFNC.

Methods: We conducted a prospective, descriptive multicenter study between May 2022 and May 2024, involving critically ill adult patients who were treated with HFNC prior to transport and required intra-hospital transport for any reason, accompanied by an intensive care unit team. The primary objective was to evaluate the incidence of severe adverse events including severe hypoxemia (with pulse oxygen saturation of less than 80%), need for intubation, need for non-invasive ventilation or cardiorespiratory arrest during transport. Secondary objectives were to assess the incidence of non-severe adverse events, defined as the need for increased inspired oxygen fraction, switching HFNC for standard oxygen therapy, nasal cannula removal or dysfunction of the HFNC device.

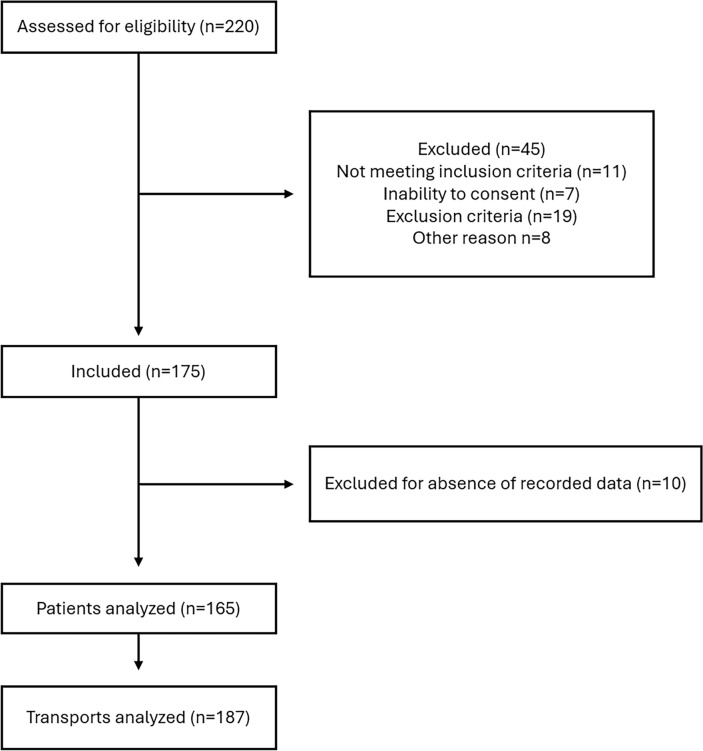
Results: We included 165 patients and analyzed 187 transports. Eight (4.3%) severe adverse events occurred in 7 patients including 6 cases of severe transient hypoxemia and 2 cases of non-invasive ventilation. All of them were transient severe hypoxemia that occurred during the first transport. Forty-three (23%) non-severe adverse events occurred, including 29(15.6%) cases of increased inspired oxygen fraction requirement, 7/187 (3.74%) cases of nasal cannula removal, 6/187 (3.2%) cases of HFNC device dysfunction, and 1 (0.5%) case involved replacing HFNC with standard oxygen therapy.

Conclusion: HFNC during intra-hospital transport of critically ill patients had a low incidence of severe adverse events. Non-severe adverse events were more frequent, but their potential impact could not be assessed in this study and warrants further investigation.

Trial registration: Clinicalstrials.gov, NCT05311007, registered 23 March 2022, https://clinicaltrials.gov/study/NCT05311007?term=hospiflow&rank=1 .

Keywords: Critical ill patient; High flow nasal cannula; Intensive care unit; Intra-hospital transport; Oxygenation.


Conflict of interest statement

Declarations. Ethics approval and consent to participate: The study protocol was approved by the French Ethics Committee (Comité de Protection des Personnes—Ile de France VI—No. 22.00476.000051) on March 8, 2022, and enregistered at Clinicaltrials.gov (NCT05311007) and was conducted in compliance with the latest version of the Declaration of Helsinki and good clinical practice guidelines. Patients, or, if they were unable to provide consent, their next of kin gave oral informed consent. Consent for publication: Not applicable. Competing interests: MAN reports receiving remuneration for presentations, fundings and material support from Fisher & Paykel healthcare and travel and congress fees from Pfizer. However, Fisher & Paykel healthcare was not involved in the development, writing, or submission of the present manuscript. The other authors declared no conflicts of interest.

Figures

Fig. 1
Fig. 1
Flow chart
Fig. 2
Fig. 2
Evolution of SpO2, respiratory rate, heart rate and mean arterial blood pressure during transport. Blue square boxes indicate the mean value, with vertical bars representing the 95% confidence interval. Values at the “before transport” time point were recorded within 5 min prior to transport. The analysis was restricted to the first 60 min as very few transports lasted longer than 1 h. The number of measurements indicates the data available at each time point. Note that there were some missing values (e.g., 178 SpO2 values at time 0 out of 187 transports) that were not replaced. SpO2, pulse oxygen saturation
Fig. 3
Fig. 3
Evolution of SpO2/FiO2 ratio, SpO2, ROX index, HFNC settings (FiO2 and flow rate), and mean arterial blood pressure during transport, compared across the three categories of transport. Red square boxes indicate the transport from ED or ward to ICU. Grey square boxes indicate the transport for imaging (CT/PET). Yellow square boxes indicate other transports. Squares indicate estimated means and errors bars represent the 95% confidence interval of the mean. Values at the “before transport” time point were recorded within 5 min prior to transport. A Linear mixed‐effects model results: Baseline (before transport) SpO2/FiO2 ratio was significantly lower in patients transported from the ward or the ED than in patients transported for imaging and lower than in patients transported for other reasons (P < 0.05). Baseline SpO2/FiO2 ratio was also significantly lower in patients transported for imaging than in patients transported for other reasons (P < 0.05). There was no significant transport × time interaction (P > 0.05), indicating that the between‐group differences observed at baseline remained essentially constant throughout the 60-min observation period. B Linear mixed‐effects model results: There were no baseline differences in SpO2 between types of transport (P > 0.05), but a significant transport × time interaction (P < 0.05). Divergence between groups became significant at 15 min; this finding should be interpreted cautiously given the small number of patients remaining at later time points. C Linear mixed‐effects model results: There was no significant interaction between time and type of transport. At baseline (before transport) both the ROX index of patients transported for imaging and of those transported from the ward or the ED were significantly lower than the ROX index of patients transported for other reasons (P < 0.05 for both). There was no significant transport × time interaction (P > 0.05), indicating that the between‐group differences observed at baseline remained essentially constant throughout the 60-min observation period. D Linear mixed‐effects model results: FiO2 at baseline (before transport) was significantly higher in patients transported from the ward or the ED than in patients transported for imaging and higher than in patients transported for other reasons (P < 0.05). This was also significantly higher in patients transported for imaging than in patients transported for other reasons (P < 0.05). There was no significant transport × time interaction (P > 0.05), indicating that the between‐group differences observed at baseline remained essentially constant throughout the 60-min observation period. E Linear mixed‐effects model results: There were no significant differences in gas flow settings across the different types of transport at baseline (before transport). There was no significant transport × time interaction (P > 0.05). F Linear mixed‐effects model results: Baseline MAP (before transport) was significantly lower in patients transported for imaging than in patients transported for other reasons (than transport from the ward or from the ED) (P < 0.05). There was a significant transport x time interaction (P < 0.05). MAP in patients transported from the ward or from the ED was higher than MAP in patients transported for imaging from time 0 to time 35 min (P < 0.05 at each time point). Throughout the entire 60 min period, MAP in the imaging group remained lower than in the other-transfers group (all P < 0.05). SpO2, pulse oxygen saturation; FiO2, inspired fraction of oxygen; HFNC, high flow nasal cannula; MAP, mean arterial blood pressure; ED, emergency department; ICU, intensive care unit; CT, computed tomography; PET, positron emission tomography

References

    1. Ling RR, Ponnapa Reddy M, Subramaniam A, Moran B, Ramanathan K, Ramanan M, et al. Epidemiology of acute hypoxaemic respiratory failure in Australian and New Zealand intensive care units during 2005–2022. A binational, registry-based study. Intensive Care Med. 2024;50:1861–72. - PMC - PubMed
    1. Behrendt CE. Acute respiratory failure in the United States: incidence and 31-day survival. Chest. 2000;118:1100–5. - PubMed
    1. Ricard J-D, Roca O, Lemiale V, Corley A, Braunlich J, Jones P, et al. Use of nasal high flow oxygen during acute respiratory failure. Intensive Care Med. 2020;46:2238–47. - PMC - PubMed
    1. Mauri T, Turrini C, Eronia N, Grasselli G, Volta CA, Bellani G, et al. Physiologic effects of high-flow nasal cannula in acute hypoxemic respiratory failure. Am J Respir Crit Care Med. 2017;195:1207–15. - PubMed
    1. Lahner D, Nikolic A, Marhofer P, Koinig H, Germann P, Weinstabl C, et al. Incidence of complications in intrahospital transport of critically ill patients–experience in an Austrian university hospital. Wien Klin Wochenschr. 2007;119:412–6. - PubMed

Associated data

LinkOut - more resources