

Regional disparities and influencing factors of health production efficiency: evidence from China
- PMID: 40629274
- PMCID: PMC12235992
- DOI: 10.1186/s12889-025-23537-y
Regional disparities and influencing factors of health production efficiency: evidence from China
Abstract
Background: The health of the populace is a fundamental pillar for China's sustainable economic growth. Health production efficiency refers to the ability to maximize the health outcomes of residents given a certain level of resource inputs. It reflects the efficiency of resource utilization in the process of health production. This paper evaluates health production efficiency in China, analyzes regional disparities, and explores influencing factors.
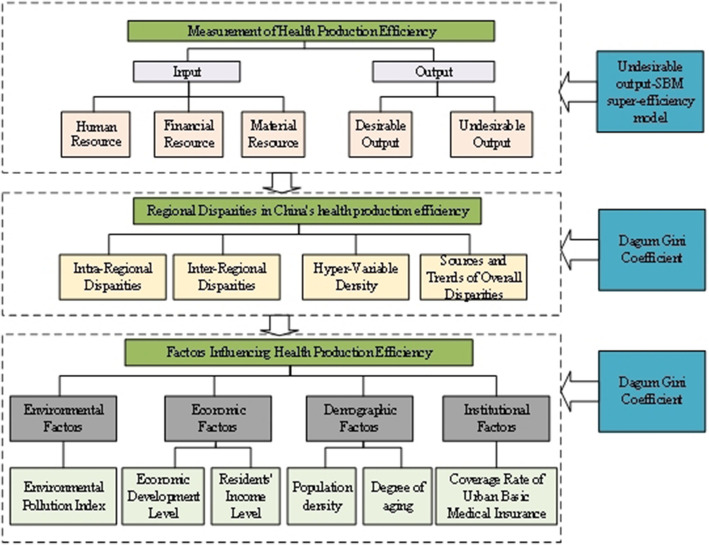
Methods: After constructing an evaluation index system for residents' health production efficiency, this study employs the undesired output-SBM super-efficiency model to measure health production efficiency. Regional disparities in health production efficiency are analyzed using the Dagum Gini coefficient, while a dynamic spatial Durbin model is applied to investigate the influencing factors and spatial spillover effects.
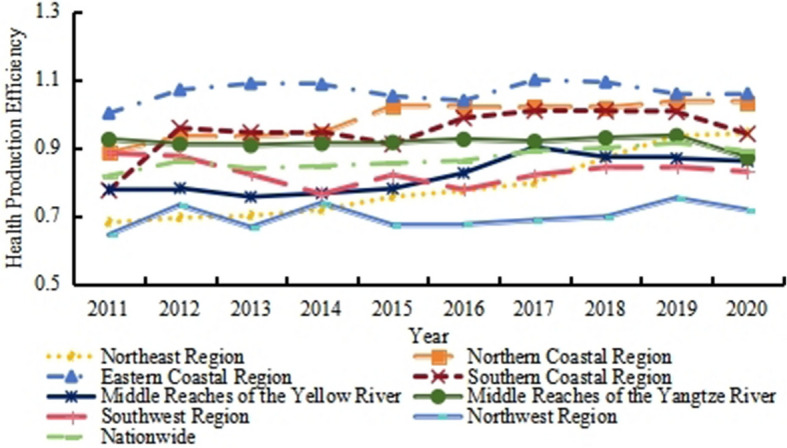
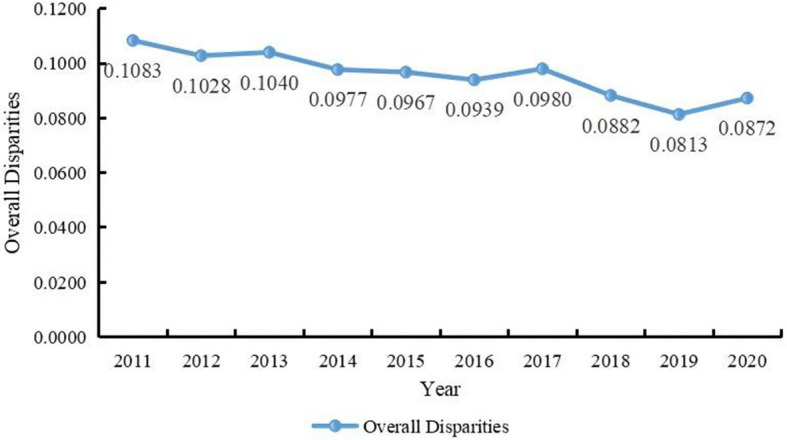
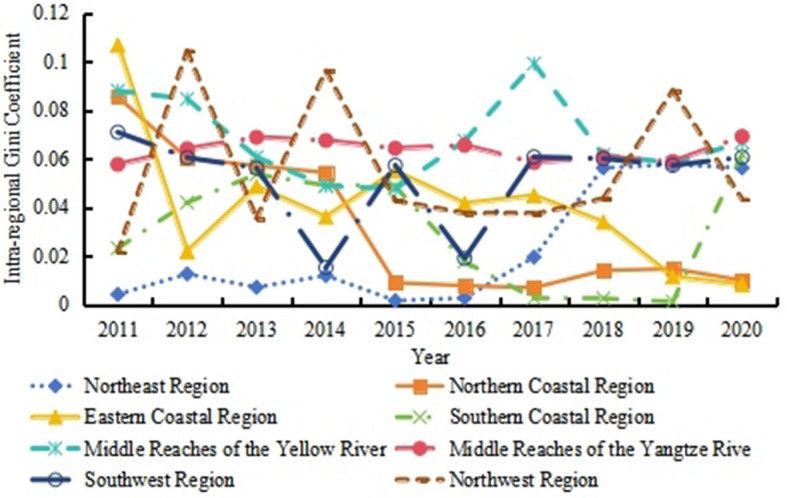
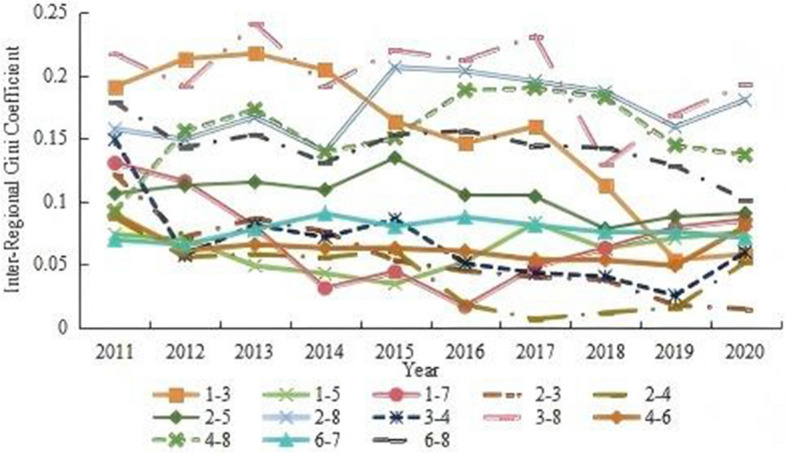
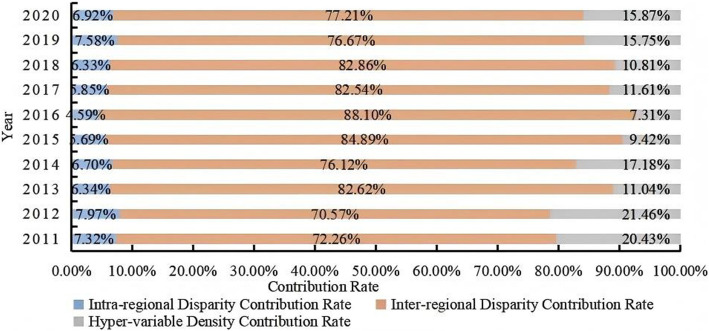
Results: The findings show: (1) Health production efficiency is generally on the rise nationwide, with eight major economic zones experiencing an increase in provinces with high efficiency and a decrease in those with low efficiency, except for a downturn in 2020 caused by the pandemic. (2) The overall disparity in health production efficiency has been steadily narrowing. Intra-regional disparities among the eight major economic zones vary, while inter-regional disparities have gradually declined but continue to represent the primary source of the overall gap. (3) Health production efficiency exhibits significant and positive spatial spillover effects both temporally and spatially. Per capita GDP exerts strong negative direct and spillover effects on health production efficiency. Residents' income demonstrates a positive spillover effect, while population density shows a significant negative overall effect.
Conclusions: This study conducts a comprehensive evaluation of health production efficiency through the construction of an index system, revealing an overall upward trend in health production efficiency. Intra-regional disparities remain the primary source of the overall differences in health production efficiency across China. Policymakers need to address the challenges posed by per capita GDP and population density on health production efficiency while leveraging the positive impact of residents' income levels to promote sustainable and balanced regional development. This study can assist the government in optimizing the allocation of healthcare resources, reducing regional health disparities, and formulating more equitable health policies.
Keywords: Dagum Gini Coefficient; Dynamic Spatial Durbin Model; Health production efficiency; Undesirable output-SBM super-efficiency model.
© 2025. The Author(s).
Conflict of interest statement
Declarations. Ethics approval and consent to participate: This study uses secondary anonymized data with minimal risk. There was no requirement for ethical review. Consent for publication: Not applicable. Competing interests: The authors declare no competing interests.
Figures
Similar articles
-
Regional disparities, dynamic evolution, and spatial spillover effects of medical resource allocation efficiency in TCM hospitals.Cost Eff Resour Alloc. 2025 Jul 18;23(1):35. doi: 10.1186/s12962-025-00644-6. Cost Eff Resour Alloc. 2025. PMID: 40682090 Free PMC article.
-
What are the key factors contributing to the inequity in healthcare resource allocation? Evidence from China's health panel data from 2009 to 2021.Front Public Health. 2025 Jul 18;13:1586585. doi: 10.3389/fpubh.2025.1586585. eCollection 2025. Front Public Health. 2025. PMID: 40756397 Free PMC article.
-
The impact of higher education investment on the urban-rural income gap: An analysis of mediating and threshold effects based on data from China's eight major comprehensive economic zones.PLoS One. 2025 Jun 25;20(6):e0326059. doi: 10.1371/journal.pone.0326059. eCollection 2025. PLoS One. 2025. PMID: 40561073 Free PMC article.
-
The Black Book of Psychotropic Dosing and Monitoring.Psychopharmacol Bull. 2024 Jul 8;54(3):8-59. Psychopharmacol Bull. 2024. PMID: 38993656 Free PMC article. Review.
-
A rapid and systematic review of the clinical effectiveness and cost-effectiveness of paclitaxel, docetaxel, gemcitabine and vinorelbine in non-small-cell lung cancer.Health Technol Assess. 2001;5(32):1-195. doi: 10.3310/hta5320. Health Technol Assess. 2001. PMID: 12065068
References
-
- Grossman M. On the concept of health capital and the demand for health. J Polit Econ. 1972;80(2):223–55.
-
- Cantor VJM, Poh KL. Integrated Analysis of Healthcare Efficiency: A Systematic Review. J Med Syst. 2018;42:8. 10.1007/s10916-017-0848-7. - PubMed
-
- Shawna G, Vivian V, Valentin Z. The Cambridge Handbook of Healthcare. 2024. https://www.cambridge.org/gb/universitypress/subjects/economics/industri....
-
- Greene W. A stochastic frontier model with correction for sample selection. J Prod Anal. 2010. 10.1007/s11123-009-0159-1.
MeSH terms
Grants and funding
LinkOut - more resources
Full Text Sources
Medical
Miscellaneous
