. 2025 Jul;55(7):e51630.
doi: 10.1002/eji.202451630.

Acellular Pertussis Vaccines Induce CD8+ and CD4+ Regulatory T Cells That Suppress Protective Tissue-Resident Memory CD4+ T Cells, in Part via IL-10

Affiliations

Acellular Pertussis Vaccines Induce CD8+ and CD4+ Regulatory T Cells That Suppress Protective Tissue-Resident Memory CD4+ T Cells, in Part via IL-10

Caitlín Ní Chasaide et al. Eur J Immunol. 2025 Jul.

Abstract

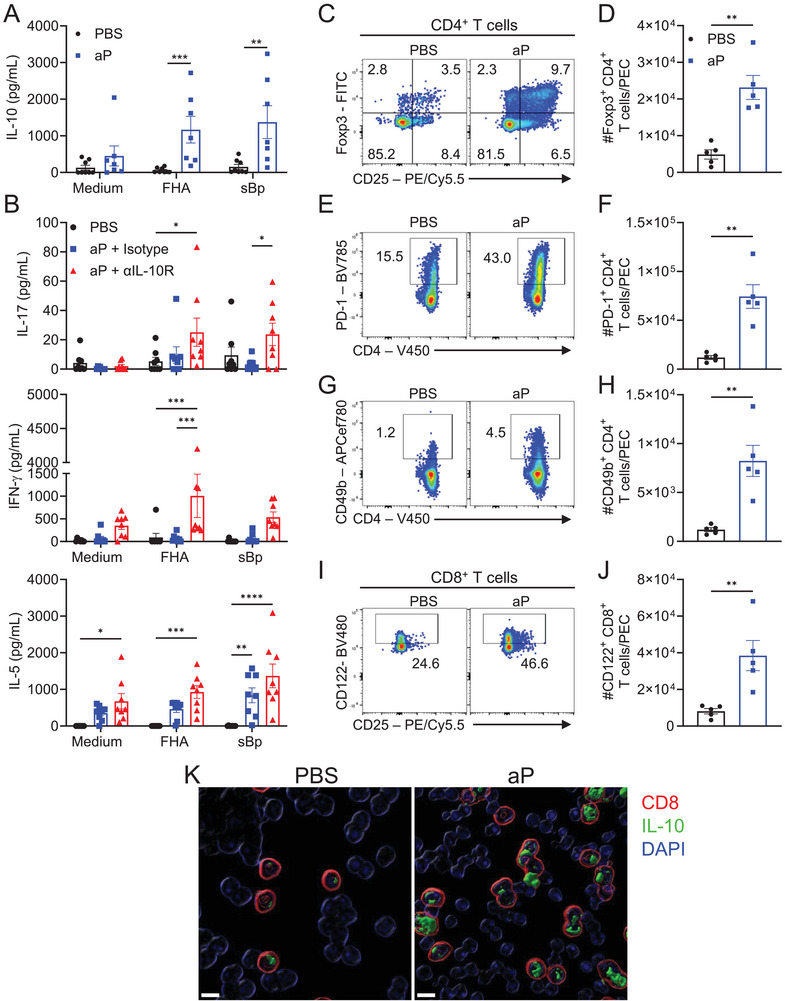
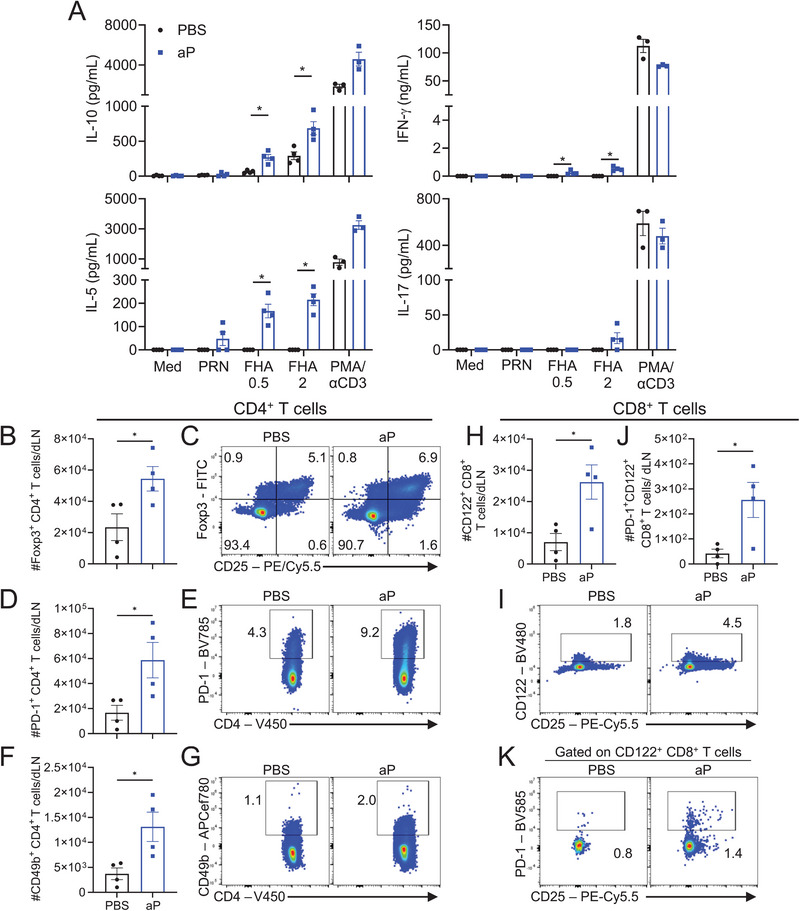
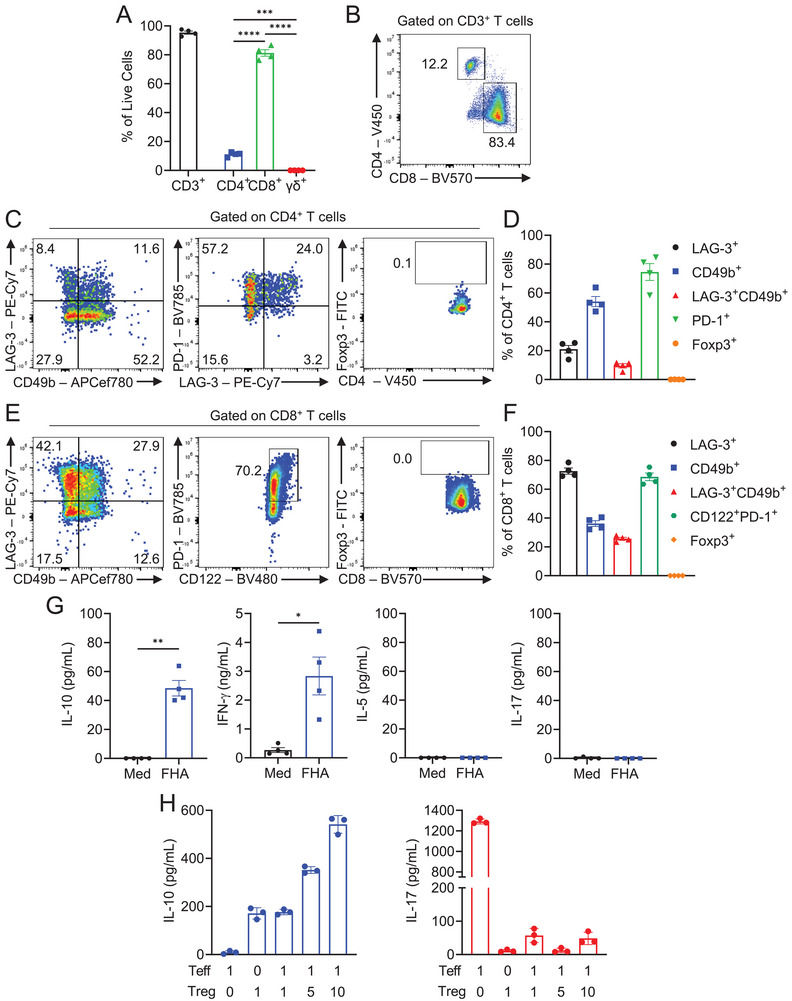
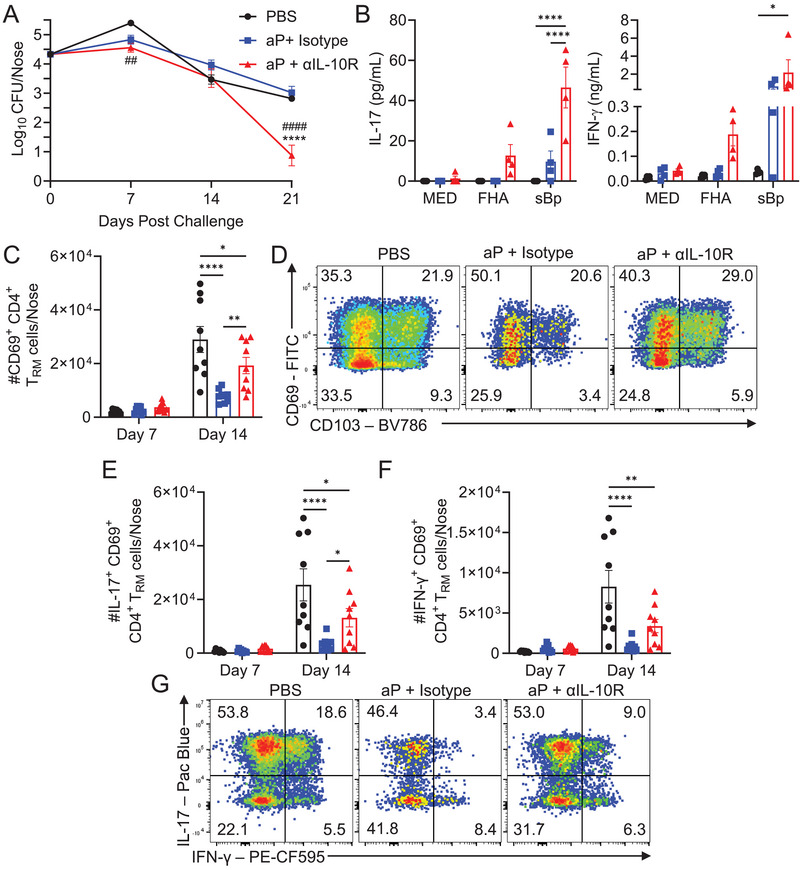
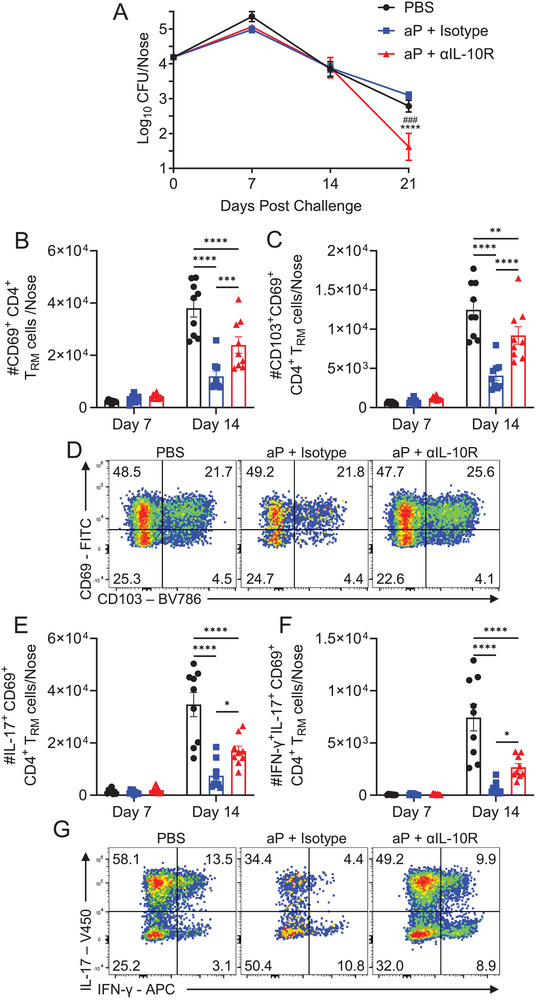
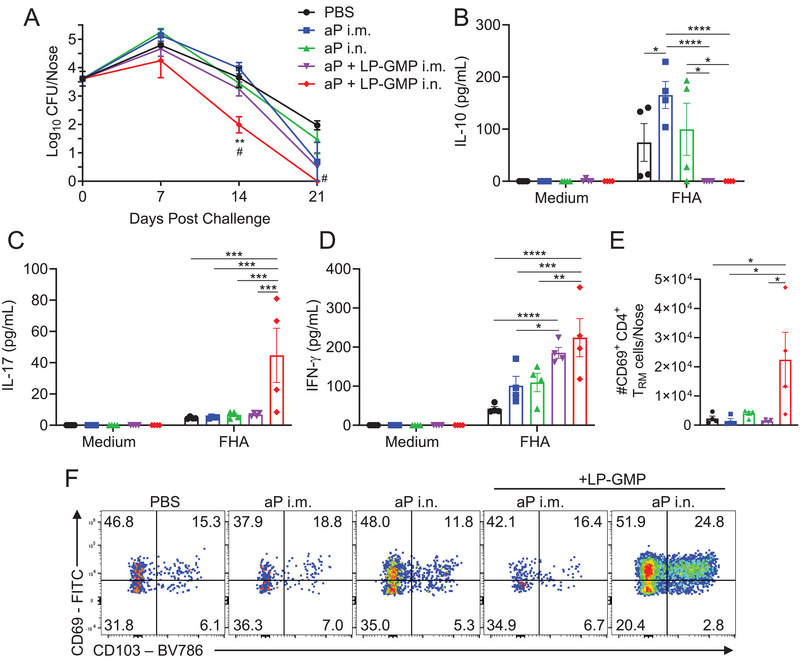
Tissue-resident memory T (TRM) cells play a key role in sustained protective immunity against Bordetella pertussis infection of the nasal mucosa. Current alum-adjuvanted acellular pertussis (aP) vaccines protect against severe pertussis disease but fail to prevent nasal infection with B. pertussis. Here we demonstrate that immunization of mice with an aP vaccine failed to generate respiratory TRM cells, but did induce antigen-specific CD4+ Treg cells that expressed Foxp3, CD49b, PD-1 and LAG-3, and CD8+ Treg cells that expressed CD122, PD-1, and IL-10. B. pertussis-specific CD4+ and CD8+ T cell lines established from aP-immunized mice expressed the regulatory markers and suppressed activation of Th1 and Th17 cells. Blockade of IL-10 signaling during aP immunization or B. pertussis challenge promoted the induction of IL-17-secreting CD4+ TRM responses and enhanced bacterial clearance from the nose. Addition of the adjuvant LP-GMP, comprising TLR2 and STING agonists, to the aP vaccine and delivery by the nasal route promoted the induction of antigen-specific IL-17-producing CD4+ TRM cells and enhanced vaccine efficacy. Our findings demonstrate that aP vaccines suppress the induction of protective TRM cells in part through the induction of CD4+ and CD8+ Treg cells, which can be overcome using a potent adjuvant and delivery of the vaccine intranasally.

Keywords: IL‐10; TRM cell; Th17 cell; Treg cell; pertussis vaccine.


Conflict of interest statement

Kingston Mills is the co‐founder of a Start‐up company and has collaborative research funding from and acts as a consultant to Pharmaceutical and Biotech companies. Kingston Mills, Béré Diallo, Caitlín Ní Chasaide, and Pauline Schmitt are inventors on a patent application around a novel vaccine adjuvant.

Figures

FIGURE 1
FIGURE 1
Alum‐adjuvanted aP vaccine induces IL‐10, which inhibits Th1 and Th17 responses. (A) Mice were immunized i.p. with Infanrix twice (0 and 28 days). Three days after the second immunization, mediastinal LN cells (dLN; 2 × 105 cells/well) were cultured with FHA (2 µg/mL), sBp (1 µg/mL), or medium alone. After 3 days, the concentrations of IL‐10 in culture supernatants were quantified by ELISA. Data shown are ±SEM (n = 7–8 mice per group), with each symbol representing an individual mouse, data pooled from two independent experiments. **< 0.01, ***< 0.001 by Mann–Whitney test. (B) Mice were immunized i.p. at 0 and 28 days with Infanrix and treated with anti‐IL‐10R or isotype control antibody (200 µg/mouse; i.p.) one day prior to and 4 h after immunization. Two weeks after the second immunization, PECs were harvested and cultured (2 × 105 cells/well) with FHA (2 µg/mL), sBp (1 µg/mL), or medium alone. After 72 h, concentrations of IL‐17, IFN‐γ, and IL‐5 in cell culture supernatants were quantified by ELISA. Data shown are mean ± SEM (n = 8 mice per group) with each symbol representing a triplicate culture for an individual mouse; data are pooled from two independent experiments. *p < 0.05, **p < 0.01, ***p < 0.001, ****p < 0.0001 by two‐way ANOVA with Tukey's post‐test. (C–K) Mice were immunized i.p. with the aP vaccine (Infanrix; 1/50 human dose) on days 0 and 28, or with PBS as control. Seven days after second immunization, PECs, mediastinal dLNs, and spleens were harvested. (C–J) PECs were stained with cell surface markers CD11b, CD19, CD3, CD4, CD8, CD49b, CD122 and PD‐1 and intranuclearly for Foxp3. Representative flow cytometry plots (C) and mean absolute numbers (D) of Foxp3+CD4+CD19CD11b cells. Representative flow cytometry plots (E) and mean absolute numbers (F) of PD‐1+CD4+CD19CD11b cells. Representative flow cytometry plots (G) and mean absolute numbers (H) of CD49b+CD4+CD19CD11b cells. Representative flow cytometry plots (I) and mean absolute numbers (J) of CD122+CD8+CD19CD11b cells. Data shown are mean ±SEM (n = 5 mice per group), from one experiment. **p < 0.01 by Mann–Whitney test. (K) Imaris reconstruction of IL‐10+ CD8+ T cells in spleen and dLN, following 20 h co‐culture of cells, at a 1:1 ratio (8 × 105 cells/well), with FHA (2 µg/mL) and anti‐CD49d and anti‐CD28 (both at 1 µg/mL). Brefeldin A (5 µg/mL) and monensin (1 µg/mL) were added for the final 4 h, prior to immunocytochemistry staining. Representative image from five mice per group in one experiment. Scale bars = 8 µm.
FIGURE 2
FIGURE 2
The alum‐adjuvanted aP vaccine induces antigen‐specific Treg cells and IL‐10 when administered by i.m. route. Mice were immunized i.m. with aP vaccine (Boostrix; 1/10 human dose) or with PBS as control on days 0 and 28. On day 35, inguinal and popliteal LNs (dLNs) and spleens were harvested. (A) Spleen and dLN cells were co‐cultured at a 1:1 ratio (4 × 105 cells/well) with PRN (1 µg/mL), FHA (0.5 or 2 µg/mL), PMA and anti‐CD3 (αCD3), or medium alone for 72 h. Concentrations of IL‐10, IFN‐γ, IL‐5, and IL‐17 in supernatants were quantified by ELISA. Data shown are mean ± SEM (n = 4 mice per group) with each symbol representing triplicate culture for an individual mouse (For PMA/αCD3 stimulation condition, data shown are mean ±SEM (n = 3 mice per group) with each symbol representing single‐well culture for an individual mouse), representative of two independent experiments. *p < 0.05 by Mann–Whitney test. (B–K) dLN cells were stained with Treg surface markers and intranuclearly for Foxp3 for flow cytometric analysis. Mean absolute cell numbers and representative flow cytometry plots of Foxp3+CD4+CD19CD11b cells (B, C), PD‐1+CD4+CD19CD11b cells (D, E), CD49b+CD4+CD19CD11b cells (F, G), CD122+CD8+CD19CD11b cells (H, I) and PD‐1+CD122+CD8+CD19CD11b cells (J, K). Data shown are mean ±SEM (n = 4 mice per group), with each symbol representing an individual mouse, from one experiment. *p < 0.05, by unpaired t‐test.
FIGURE 3
FIGURE 3
T cell lines established from aP‐immunized mice express Treg markers and suppress antigen‐specific Th17 cells. Mice were immunized i.m. with aP vaccine (Boostrix; 1/10 human dose) on days 0 and 28. On day 35, T cell lines were generated by culturing cells with FHA in the presence of IL‐2 and IL‐15. T cells were stained with antibodies specific for Treg cell surface markers and analyzed by flow cytometry. Mean frequency of CD3+, CD4+, CD8+, and γδ+ T cells (A), and representative flow cytometry plots for CD4 versus CD8 (B). Representative flow cytometry plots (C) and mean frequencies (D) of LAG‐3+, CD49b+, LAG‐3+CD49b+, PD‐1+, and Foxp3+ CD4+ T cells (all pregated on CD4+CD19CD11bCD45.2+ cells). Representative flow cytometry plots (E) and mean frequencies (F) of LAG‐3+, CD49b+, LAG‐3+CD49b+, CD122+PD‐1+, and Foxp3+ CD8+ T cells (all pregated on CD8+CD19CD11bCD45.2+ cells). (G) Cells from an FHA‐specific T cell line were stimulated with FHA (2 µg/mL) or medium only in the presence of splenic irradiated APCs for 72 h. Concentrations of IL‐10, IFN‐γ, IL‐17, and IL‐5 were quantified by ELISA. Data shown are mean ± SEM (n = 4 mice, biological replicates), with each symbol representing a T cell line established from an individual mouse, representative of two independent experiments. ***p < 0.001, ****p < 0.0001 by one‐way ANOVA with Tukey's post‐test (A) or *p < 0.05, **p < 0.01 by paired t‐test (G). (H) CD4+ Teff cells isolated from LNs (cervical, axillary, brachial) and lungs of convalescent mice were co‐cultured (0.5 × 105 cells/well) with Treg cell lines (0.5 × 105, 2.5 × 105, 5 × 105 cells/well), irradiated APCs (5 × 105 cells/well) and FHA (2 µg/mL). After 4 days, IL‐17 and IL‐10 concentrations in culture supernatants were quantified by ELISA. Data shown are mean ± SD (pooled from four individual T cell lines shown in A–G) of triplicate cell culture (technical replicates), representative of two independent experiments.
FIGURE 4
FIGURE 4
Blockade of IL‐10R at the time of aP immunization enhances B. pertussis clearance and ameliorates TRM cell suppression in the nose. Mice were immunized i.p. at days 0 and 28 with aP vaccine (Infanrix; 1/50 human dose) and treated i.p. with an αIL‐10R or isotype control antibody, 1 day prior to and 3 days after immunizations or mice were immunized with PBS as a control. (A) Mice were aerosol challenged with live B. pertussis 14 days after the booster immunization, and bacterial CFUs were assessed in nasal tissue at 2–16 h (day 0) and on days 7, 14, and 21 post challenge. Data are mean ± SEM (n = 7–9 mice per group, per time‐point), and data are pooled from two independent experiments. ****p < 0.0001 aP + αIL‐10R versus aP + Isotype, ##p < 0.01, ####p < 0.0001 aP + αIL‐10R versus PBS, by two‐way ANOVA with Tukey's post‐test. (B) On the day of challenge, purified lung immune cells were co‐cultured (in triplicate) with irradiated APCs, and FHA (2 µg/mL), sBp (5 µg/mL), or medium for 72 h. IL‐17 and IFN‐γ concentrations were quantified by ELISA. (C–G) On days 7 and 14 post‐B. pertussis challenge, mice were injected i.v. with αCD45 antibody 10 min prior to euthanasia, and nasal tissue cells were stained with antibodies specific for TRM cells, or cells were stimulated with PMA and ionomycin for 4 h, prior to intracellular cytokine staining (ICS) and flow cytometric analysis. Mean absolute number of CD69+ CD4+ TRM cells (C) with representative flow cytometry plots for day 14 (D). Mean absolute number of IL‐17+ (E) and IFN‐γ+ (F) CD4+ TRM cells with representative flow cytometry plots for day 14 (G). Data are mean ±SEM (n = 4 (B) or n = 8–9 (C–G) mice per group, per time‐point), with each symbol representing an individual mouse. All data are pooled or representative of two independent experiments. The control groups in one of the two experiments were shared with those in Figure 5. *p < 0.05, **p < 0.01 ****p < 0.0001 by two‐way ANOVA with Tukey's post‐test.
FIGURE 5
FIGURE 5
Blockade of IL‐10R at the time of B. pertussis challenge enhances bacterial clearance and reverses TRM suppression in nasal mucosa in aP‐immunized mice. Mice were immunized i.p. at days 0 and 28 with aP vaccine (Infanrix; 1/50 human dose) or PBS. Mice were aerosol challenged with live B. pertussis 2 weeks after boost and were treated i.p. with αIL‐10R or isotype control antibody, 1 day and 4 h prior to and on days 4, 8, 12, and 16 after challenge. (A) Bacterial CFUs were enumerated in nasal tissue at 16 h (day 0) and on days 7, 14, and 21 post challenge. Data are mean ±SEM (n = 8–9 mice per group, per time‐point) and are pooled from two independent experiments. ****p < 0.0001 vs. aP + Isotype, ###p<0.001 vs PBS, by two‐way ANOVA with Šidák's post‐test. (B–G) On days 7 and 14, mice were injected i.v. with αCD45 antibody 10 min prior to euthanasia. Nasal cells were stained with antibodies specific for TRM cell surface markers, or cells were stimulated with PMA and ionomycin for 4 h, prior to ICS and flow cytometric analysis. Mean absolute numbers of CD69+ (B) and CD103+CD69+ (C) CD4+ TRM cells, with representative flow cytometry plots for day 14 (D). Mean absolute cell number of IL‐17+ (E) and IFN‐γ+IL‐17+ (F) CD4+ TRM cells with representative flow cytometry plots for day 14 (G). Data shown are mean ±SEM (n = 8–9 mice per group, per time‐point), with each symbol representing an individual mouse. All data are pooled from two independent experiments. The control groups in one of the two experiments were shared with those in Figure 4. *p < 0.05, **p < 0.01, ***p < 0.001, ****p < 0.0001 by two‐way ANOVA with Tukey's post‐test.
FIGURE 6
FIGURE 6
Nasal delivery of aP vaccine formulated with LP‐GMP induces Th17 and Th1‐skewed responses, nasal TRM cells, and confers protection against B. pertussis in the nose. Mice were immunized i.m. or i.n. on days 0 and 28 with the aP vaccine (Infanrix; 1/50 human dose), aP + LP‐GMP or PBS as a control. Two weeks following the second immunization, mice were challenged with live B. pertussis. (A) CFUs were enumerated in the nasal mucosa 2 h (day 0) and 7‐, 14‐, and 21 days post challenge. Data are mean ±SEM (n = 3–4 mice per group, per time‐point), representative of three independent experiments. **p < 0.01 versus aP i.m., #p < 0.01 versus aP i.n. by two‐way ANOVA with Tukey's post‐test. (B–D) On the day of challenge, cervical and inguinal LNs and spleens were co‐cultured in triplicate with FHA (0.5 µg/mL) or medium alone for 72 h. Concentrations of IL‐10 (B), IL‐17 (C), and IFN‐γ (D) in supernatants were quantified by ELISA. (E, F) On the day of the challenge, mice were injected i.v. with an αCD45 antibody 10 min prior to euthanasia. Nasal tissue cells were stained with antibodies specific for TRM cell surface markers. Mean absolute numbers of CD69+ CD4+ TRM cells (E), with representative flow cytometry plots below (F). Data shown are mean ± SEM (n = 4 mice per group; each symbol represents an individual mouse), and are representative of two (B–D) or three (E, F) independent experiments. *p < 0.05, **p < 0.01, ***p < 0.001, ****p < 0.0001 by two‐way (B–D) or one‐way (E) ANOVA, with Tukey's post‐test.

Similar articles

References

    1. Mattoo S. and Cherry J. D., “Molecular Pathogenesis, Epidemiology, and Clinical Manifestations of Respiratory Infections Due to Bordetella Pertussis and Other Bordetella Subspecies,” Clinical Microbiology Reviews 18 (2005): 326–382. - PMC - PubMed
    1. Poeta M., Moracas C., Albano C., et al., “Pertussis Outbreak in Neonates and Young Infants Across Italy, January to May 2024: Implications for Vaccination Strategies,” Euro Surveillance 2024: 29. - PMC - PubMed
    1. Smout E., Mellon D., and Rae M., “Whooping Cough Rises Sharply in UK and Europe,” Bmj 385 (2024): q736. - PubMed
    1. Nordholm A. C., Emborg H. D., Nørgaard S. K., et al., “Pertussis Epidemic in Denmark, August 2023 to February 2024,” Euro Surveillance (2024): 29. - PMC - PubMed
    1. Klein N. P., Bartlett J., Rowhani‐Rahbar A., Fireman B., and Baxter R., “Waning Protection After Fifth Dose of Acellular Pertussis Vaccine in Children,” New England Journal of Medicine 367 (2012): 1012–1019. - PubMed

MeSH terms