

Temporal and Seasonal Trends in Pediatric Eye Trauma in California
- PMID: 40630266
- PMCID: PMC12235020
- DOI: 10.2147/OPTH.S523256
Temporal and Seasonal Trends in Pediatric Eye Trauma in California
Abstract
Purpose: This study aims to evaluate temporal and seasonal trends in pediatric eye trauma based on emergency department (ED) visits in California.
Design: Retrospective, population-based cohort study.
Methods: Children who presented with ocular trauma to EDs in California between 2016 and 2021 were identified using the California Department of Health Care Access and Information datasets and classified by International Classification of Diseases (ICD) diagnosis codes. Poisson regression was used to model yearly incidence and seasonality was assessed.
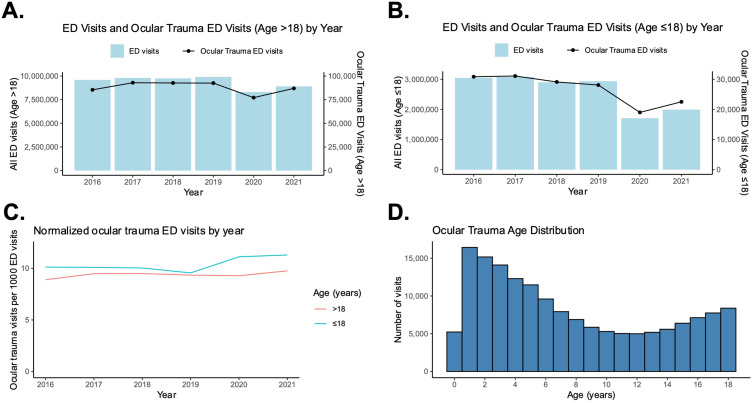
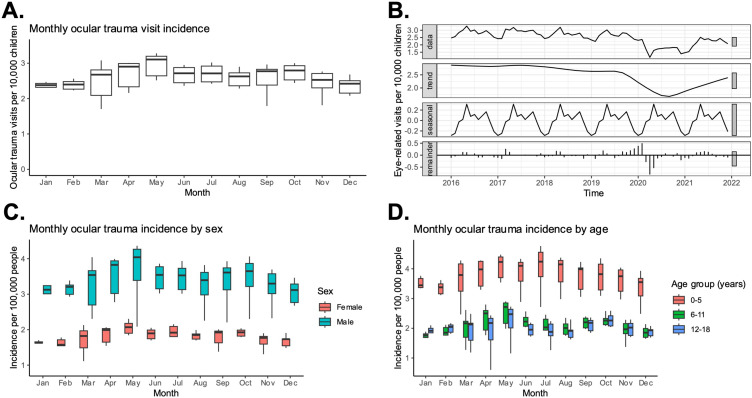
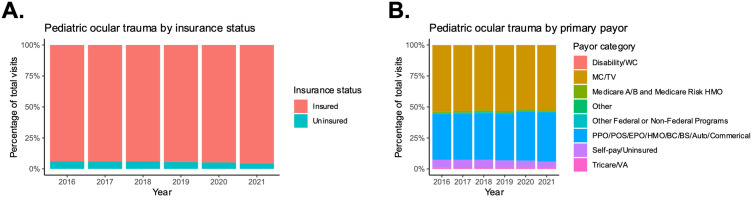
Results: Among 15,674,366 ED visits by children in California from 2016 to 2021, 160,730 (1.0%) involved a primary or secondary diagnosis of ocular trauma. The mean age at presentation was 7.6 (SD: 5.6) years. The most common diagnoses were ocular adnexal open wound (51.4%) and superficial injury of the eye/adnexa (23.6%). The overall yearly incidence of eye trauma was 3.0 (95% CI: 3.0-3.0) per 1000 children, peaking in 2017 (3.4) and lowest in 2020 (2.1) and significantly decreased over the study period. Male children and Black and Hispanic/Latino children had the highest incidence of ocular trauma. A significant seasonal pattern was observed, with the highest incidence in May and the lowest in January (P<0.01). Geographically, the highest incidences were in the Inland North and Central Valley regions. Over the 6-year period, the percentage of self-pay (uninsured) pediatric patients decreased over time, and public insurance (Medicaid/Title V) remained the most common payor.
Conclusion: Ocular trauma represents a small fraction of ED visits for children in California. The incidence of ocular trauma ED visits decreased over the study period and displayed a seasonal trend. Higher incidence of ocular trauma were observed in male and Black and Hispanic/Latino children.
Keywords: emergency department; epidemiology; health disparities; pediatric ocular trauma; pediatric ophthalmology; seasonal trends.
© 2025 Bishay et al.
Conflict of interest statement
The authors report no conflicts of interest in this work.
Figures


Similar articles
-
Do Patients of Different Levels of Affluence Receive Different Care for Pediatric Osteosarcomas? One Institution's Experience.Clin Orthop Relat Res. 2025 Apr 1;483(4):748-758. doi: 10.1097/CORR.0000000000003299. Epub 2024 Oct 30. Clin Orthop Relat Res. 2025. PMID: 39485923
-
Surveillance for Violent Deaths - National Violent Death Reporting System, 50 States, the District of Columbia, and Puerto Rico, 2022.MMWR Surveill Summ. 2025 Jun 12;74(5):1-42. doi: 10.15585/mmwr.ss7405a1. MMWR Surveill Summ. 2025. PMID: 40493548 Free PMC article.
-
Blood transfusions in the emergency department: A descriptive analysis and referral patterns at a non-trauma center.Am J Emerg Med. 2025 Aug;94:153-157. doi: 10.1016/j.ajem.2025.04.035. Epub 2025 Apr 16. Am J Emerg Med. 2025. PMID: 40300386
-
Multifaceted behavioral interventions to improve topical glaucoma therapy adherence in adults.Cochrane Database Syst Rev. 2025 Jun 11;6(6):CD015788. doi: 10.1002/14651858.CD015788.pub2. Cochrane Database Syst Rev. 2025. PMID: 40497459 Review.
-
Adefovir dipivoxil and pegylated interferon alfa-2a for the treatment of chronic hepatitis B: a systematic review and economic evaluation.Health Technol Assess. 2006 Aug;10(28):iii-iv, xi-xiv, 1-183. doi: 10.3310/hta10280. Health Technol Assess. 2006. PMID: 16904047
References
LinkOut - more resources
Full Text Sources
