[Preprint]. 2025 Jul 4:rs.3.rs-6977440.
doi: 10.21203/rs.3.rs-6977440/v1.

The Dichotomy of Tumor Control by Recruited and Resident Tumor-Associated Macrophages

Affiliations

The Dichotomy of Tumor Control by Recruited and Resident Tumor-Associated Macrophages

Claudia Jakubzick et al. Res Sq. .

Abstract

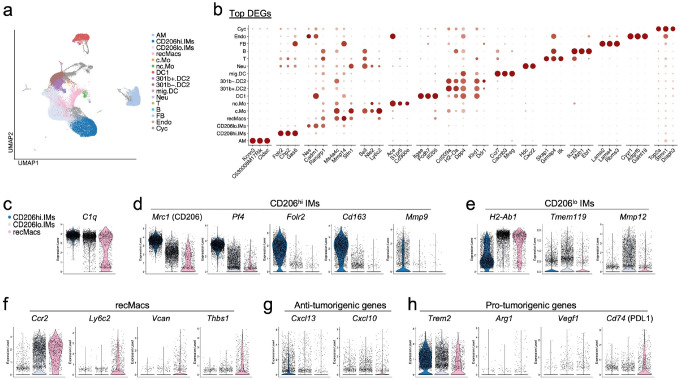
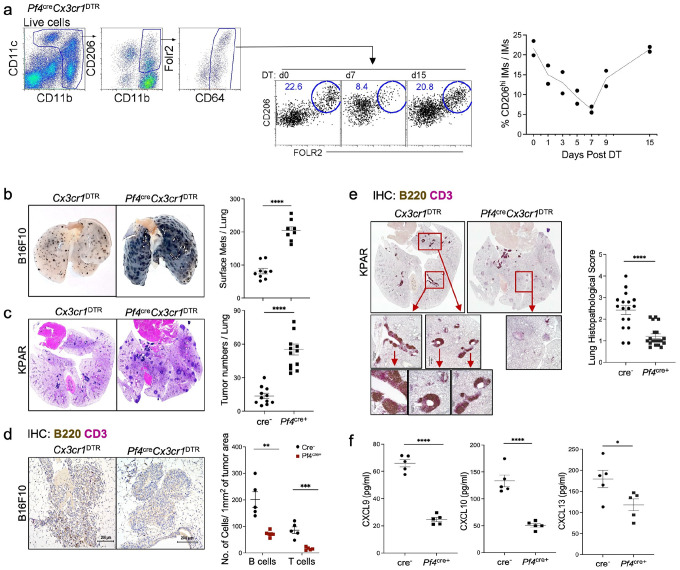
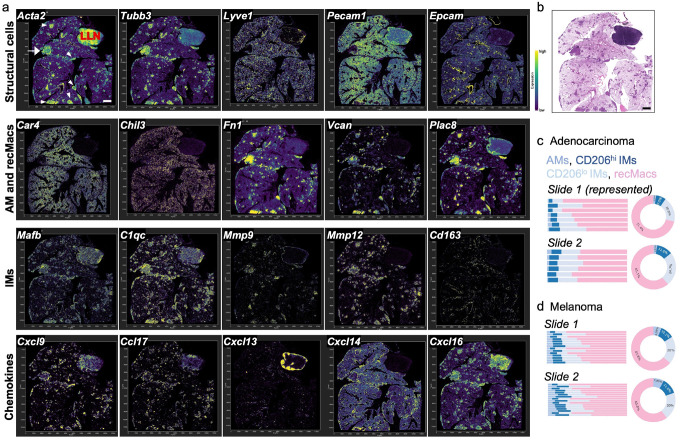
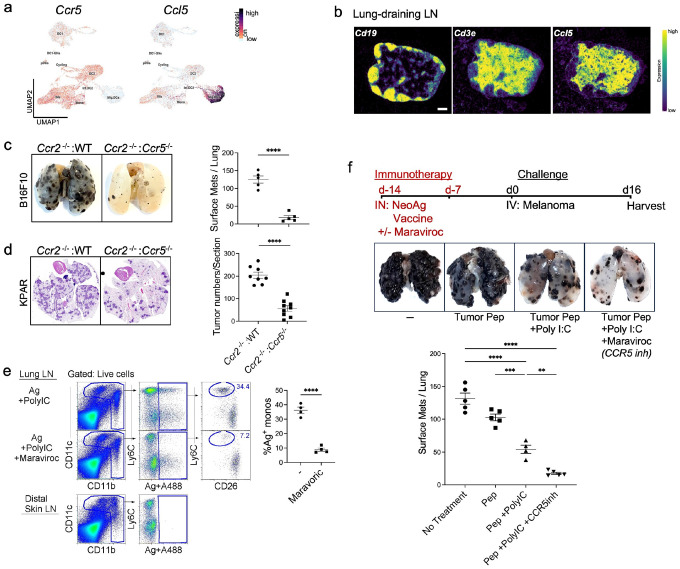
Tumor-associated macrophages (TAMs) play dual roles in cancer, either promoting or suppressing tumor progression, complicating therapeutic approaches. TAMs include recruited macrophages (recMacs), derived from circulating monocytes, and tissue-resident interstitial macrophages (IMs). We recently identified a heterogeneous population of chemokine-expressing IMs, including subsets that support tertiary lymphoid structure (TLS) formation during lung inflammation. Here, we show that IMs can be either pro- or anti-tumorigenic, depending on the subset. Using Pf4 Cx3cr1 mice to deplete CD206hi IMs expressing Cxcl13, Cxcl9, and Cxcl10, we demonstrate their essential role in TLS formation, lymphocyte recruitment, and tumor suppression in melanoma and lung adenocarcinoma. In contrast, Ccl2-expressing IMs promote tumor growth by recruiting pro-tumorigenic recMacs. Spatial transcriptomics confirmed the distinct localization and chemokine profiles of these subsets. Finally, CCR5 blockade with the FDA-approved inhibitor Maraviroc during neoantigen vaccination improved tumor control by preventing the migration of immunosuppressive, antigen-presenting recMacs (moDCs). These findings support the development of macrophage-targeted therapies by identifying pro-tumorigenic subsets and recMac trafficking as actionable targets, while preserving macrophage populations that sustain anti-tumor immunity.


Conflict of interest statement

Competing interests The authors declare no competing interests.

Figures

Figure 1
Figure 1. Pulmonary melanoma scRNA-seq identifies pro- and anti-tumorigenic signatures in CD206hi IMs, CD206lo IMs and recMacs
(a) UMAP of extravascular immune cells isolated from the lungs of day 16 melanoma burdened C57BL/6 mice, n=3 (b) DEGs defined the unbiased clusters. Alveolar macrophages, AMs; interstitial macrophages, IMs (CD206hi and CD206lo, recruited macrophages, recMacs; classical and non-classical monocytes, c.Mo and nc.Mo; dendritic cells, DC1, DC2 (CD301+ and CD301); migratory DCs, mig.DCs, neutrophils, Neu; basophils, B; fibroblast,FB; endothelial cells, E; B cells, B; and cycling cells, Cyc. (c-h) Violin plots comparing gene expression in IM subsets and recMacs. (c) Feature plots show the expression of C1qb key IM signature genes. (d) Feature plots depict CD206hi IM expression for Mrc1, Pf4 Folr2, Cd163, and Mmp9. (e) CD206lo IM expression for H2-Ab1, Tmem119, and Mmp12. (f) Feature plots show recMacs expression for Ccr2, Ly6c2, Vcan, and Thbs1. (g-h) Feature plots display anti-tumorigenic chemokines Cxcl13, and Cxcl10 by IMs and pro-tumorigenic genes such as Trem2 expressed by both recMacs and IMs, and Spp1, Vegfa, Vcan, Arg1, and Cd274 by recMacs.
Figure 2
Figure 2. CD206hi IMs promote lymphocyte recruitment and anti-tumor immunity.
(a) Gating strategy for CD11b+CD64+CD206hi/loFOLR2+/− IMs and the time course of CD206+FOLR2+ IM depletion kinetics in Pf4creCx3cr1DTR mice following DT injection on day 0. Three independent experiments were conducted. (b) Representative images of tumor-burdened lungs from cre-Cx3cr1DTR and Pf4creCx3cr7DTR mice harvested on day 16 after intravenous injection of melanoma cells. Plot shows the number of surface metastases per lung. Four independent experiments were conducted, with n = 4–5 per group. (c) Representative hematoxylin and eosin-stained lung sections from cre-Cx3cr1DTR and Pf4creCx3cr1DTR mice harvested on day 16 after injection of KPAR1.3 adenocarcinoma cells. Plot quantifies the number of tumors per section. Four independent experiments were conducted, with n = 5 per group. (d) Representative IHC sections stained for B220 (brown) and CD3e (purple). The plots show the number of T cells and B cells infiltrating the TME in cre-Cx3cr1DTR and Pf4creCx3cr1DTR mice. Three independent experiments were conducted, with n = 5 per group. (e) Representative IHC sections stained for B220 (brown) and CD3e (purple), showing prominent tertiary lymphoid structures (TLS) in cre-Cx3cr1DJR lungs, whereas Pf4creCx3cr1DTR lungs exhibited virtually no TLS. Whole lung images and magnified views of TLS are presented. The plots show lung histopathology scores in cre-Cx3crlDTR and Pf4creCx3cr1DTR mice. Three independent experiments were conducted, with n = 5 per group. (f) ELISA analysis of CXCL9, CXCL10, and CXCL13 levels in homogenized lungs from cre-Cx3cr1DTR and Pf4creCx3cr1DTR mice on day 16 after KPAR1.3 adenocarcinoma injection. Two independent experiments were conducted, with n = 5 biologically independent samples per group. p-values were calculated using a two-sided Student’s t-test. *p < 0.05; ** p < 0.01; **** p < 0.001
Figure 3
Figure 3. Spatial transcriptomics of adenocarcinoma reveals distinct chemokine patterns and a high abundance of recMac and CD206lo IMs compared to CD206hi IMs, with virtually no AMs in the TME.
(a) Spatial expression analysis of d16 KPAR1.3 adenocarcinoma lungs shows high concentration of Actin (Acta2), aiding in TME identification. White arrows indicate tumor nodules. A large white arrow, to the left of Acta2 image, pointing at a large tumor, highlights structural cells within the TME across the top row. In situ gene expression reveals distinct cell types, including innervated nerves (Tubb3), lymphatic vessels (Lyve1), blood vessels (Pecam1), and epithelial cells (Epcam). Markers for macrophage populations include alveolar macrophages (Chil3, Car4), recMacs (Fn1, Vcan, Plac8), IMs (Mafb, C1qc), CD206hi IMs (CD163, Mmp9), and CD206lo IMs and recMacs (Mmp12). Additionally, chemokines (Cxcl9, Ccl17, Cxcl13, Cxcl14, Cxcl16) are represented. A control slide without tumors is shown in Supplementary Fig 4. (b) Hematoxylin and eosin-stained section of a spatial transcriptomic adenocarcinoma lung. (c-d) Spatial transcriptomics and quantification of extravascular macrophages within the tumor TME in adenocarcinoma and melanoma. All spatial samples are shown; n = 2 per tumor type.
Figure 4
Figure 4. Ccl2 expression by IMs is critical for recMac recruitment.
(a) Spatial expression analysis of d16 KPAR1.3 adenocarcinoma lungs reveals high Ccl2 expression in the TME, along with classical M1 pro-inflammatory genes Il1b and Nos2, as well as M2 reparative genes Arg1 and Ccl24. (b) UMAP visualization of Ccl2 expression in myeloid cells, illustrated with labeled second dataset, Supplementary Fig. 1. (c) Spatial transcriptomics overlay of three genes Ccl2, C1qb and Cd163. (d) Irradiated (900 rad) CD45.1 mouse recipients were reconstituted with CD45.2 WT and Ccl2−/− bone marrow. The representative image shows mice on day 16 post-melanoma cell injection. To the right, quantification of the number of surface metastases and (e) number of recMacs per lung. Three independent experiments were conducted, with n = 4–5 per group. (f) Four weeks after busulfan injection, myeloid cells were examined: host CD45.1 IMs were preserved, while monocytes and DCs were donor derived (CD45.2). Three independent experiments were conducted, with n = 3–4 per group. (g) Four cohorts of mice (Irradiated, IMs are WT-derived and CclZ−/− derived; Busulfan-treated: IMs are WT-derived and WT-derived) were injected with B16F10 melanoma cells and examined for tumor growth. Scatter plot quantifies the number of surface metastases per lung. Two independent experiments were conducted, with n = 3–4 per group. p-values were calculated using a two-sided Student’s t-test. ** p < 0.01; **** p < 0.001
Figure 5
Figure 5. Inhibiting lymph node antigen-bearing moDC with Maraviroc during a prophylactic neoantigen vaccine enhances anti-tumor immunity.
(a) UMAP visualization of Ccl5 and Ccr5 expression in myeloid cells. (b) Spatial expression of Cd19, Cd3e, and Ccl5 in a lung-draining lymph node. (c) Representative images of tumor-burdened lungs from Ccr2−/−:WT and Ccr2−/−:Ccr5−/− reconstituted mice harvested on day 16 post-melanoma cell injection. Plot showing the number of surface metastases per lung. Two independent experiments were conducted with n = 5 for each group. (d) Representative hematoxylin and eosin-stained sections of lungs from bone marrow chimeric Ccr2−/−:WT.1 and Ccr2−/−:Ccr5−/− mice harvested on day 16 post KPAR1.3 adenocarcinoma cell injection. The plot quantifies the number of tumors per section. Two independent experiments with n = 5 for each group are represented. (e) WT mice were treated i.p. with or without 300 μg Maraviroc (CCR5 inhibitor) 4 h prior to i.n. delivery with 5 μg OVA-Alexa488 and 50 μg Poly I:C. 24 h post antigen delivery lymph nodes were harvested. Scatter plot left to right displays gated myeloid cells, then gated antigen-bearing cells, and then antigen-bearing Ly6C+ moDCs (circled) and CD26+ DCs. Three independent experiments were conducted with n = 4–5 for each group. (f) Representative image of lungs from prophylactically treated WT mice injected with tumor peptides alone, tumor peptides + Poly I:C, and tumor peptides + Poly I:C + Maraviroc (Ccr5 inhibitor) 14 and 7 days prior to tumor challenge. The plot shows the number of surface metastases per lung. Two independent experiments were conducted with n = 5 for each group. p-values were calculated using a two-sided Student’s t-test. ** p < 0.01; **** p < 0.001

Similar articles

References

    1. Bedoret D. et al. Lung interstitial macrophages alter dendritic cell functions to prevent airway allergy in mice. Journal of Clinical Investigation 119, 3723–3738 (2009). - PMC - PubMed
    1. Li X. et al. ScRNA-seq expression of IFI27 and APOC2 identifies four alveolar macrophage superclusters in healthy BALF. Life Science Alliance 5 (2022). - PMC - PubMed
    1. Li X. et al. Coordinated chemokine expression defines macrophage subsets across tissues. Nat Immunol 25, 1110–1122 (2024). - PMC - PubMed
    1. Aegerter H., Lambrecht B.N. & Jakubzick C.V. Biology of lung macrophages in health and disease. Immunity 55, 1564–1580 (2022). - PMC - PubMed
    1. Vanneste D. et al. MafB-restricted local monocyte proliferation precedes lung interstitial macrophage differentiation. Nat Immunol 24, 827–840 (2023). - PMC - PubMed

Publication types

LinkOut - more resources