. 2025 Jun 26;30(3):413.
doi: 10.3892/ol.2025.15159. eCollection 2025 Sep.

Differential extracellular matrix proteomic signatures in colorectal tumors from Appalachian and non-Appalachian patients

Affiliations

Differential extracellular matrix proteomic signatures in colorectal tumors from Appalachian and non-Appalachian patients

Alexander T Sougiannis et al. Oncol Lett. .

Abstract

Emerging evidence reports that regulation of the extracellular matrix influences the progression of colorectal cancer (CRC). The present study investigated regulation of the extracellular matrix proteome in colorectal malignancy within a high-risk Appalachian population compared with non-Appalachian populations. A targeted mass spectrometry imaging proteomic method directed at collagen regulation was used. Tissue microarrays (TMAs) comprising of matched CRC with adjacent normal to tumor (NAT) from 45 patients were constructed into 86 samples to evaluate the extracellular matrix proteome (ECM). A total of five specific peaks were discovered to differ between NAT and tumor with high sensitivity and specificity by receiver operating characteristic (AUROC) ≥0.7, Wilson/Brown P<0.0002. Evaluation of patient TMA cores showed increased levels of combined ECM peptides in advanced stage Appalachian CRC (III + IV) compared with early staged CRC (I + II) (AUROC 0.8595; 95% confidence interval, 0.8190-0.8999; Wilson/Brown P<1.0×10⁻¹⁵), contrasting with the non-Appalachian tumors, which showed a decreased ability to discriminate between early and late stage (AUROC 0.6618; 95% confidence interval, 0.6126-0.7110; Wilson/Brown P<1.0×10⁻⁹). Comparison of advanced stage CRCs between Appalachian and non-Appalachian populations showed high sensitivity and specificity in distinguishing the populations (AUROC 0.7612; 95% confidence interval, 0.7109-0.8114; Wilson/Brown P<3.0×10⁻¹⁵). History of smoking, sex and tumor origin location did not show significant ability to distinguish by AUROC. A combination of high mass resolution, high mass accuracy spatial proteomics and sequencing proteomics by liquid chromatography coupled to tandem mass spectrometry revealed that fibrillar collagens were spatially regulated within the CRC tumor microenvironment. Fibrillar collagen post-translational modifications of hydroxylated proline revealed distinct spatial separation based on the presence of a number of hydroxylated proline sites. The present study highlighted that the targeted mass spectrometry imaging of the ECM proteome may provide new insight and novel predictive tools for understanding CRC, particularly among Appalachian patients.

Keywords: cancer; collagen; colorectal cancer; extracellular matrix; imaging; mass spectrometry imaging; spatial proteomics.


Conflict of interest statement

The authors declare that they have no competing interests.

Figures

Figure 1. Study design and workflow. (A) Regional Appalachian and non–Appalachian counties inform which samples were collected in the study. Map was constructed from the publicly available U.S. Geolog...
Figure 1.
Study design and workflow. (A) Regional Appalachian and non-Appalachian counties inform which samples were collected in the study. Map was constructed from the publicly available U.S. Geological Survey, National Geospatial Program (https://www.usgs.gov/programs/national-geospatial-program). (B) Previously banked patient matched tumors and NAT from men and women were used in the study (panel 1). Cores were selected by a pathologist from the tumor or NAT and formatted into a TMA (panel 2). TMAs were sectioned for proteomic imaging analysis. Tumors were further annotated by stage. Pathologist-designated cores were used to create a formalin-fixed, paraffin-embedded tissue microarray (panel 3). Tissue sections of the TMA prepared for collagen targeted proteomic analysis were scanned by mass spectrometry; Each core was sampled ~225 times (panel 4). Data analysis used peak intensities as a total score per core (panel 5). Images created using Biorender (Biorender.com). NAT, normal adjacent to tumors; TMA, tissue microarray.
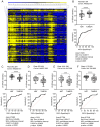
Figure 2. Evaluation of NAT versus tumor independent of Appalachian status and independent of tumor stage. (A) Peptide peaks showed distinct clusters based on peptide intensity. (B–F) Five peptide pea...
Figure 2.
Evaluation of NAT versus tumor independent of Appalachian status and independent of tumor stage. (A) Peptide peaks showed distinct clusters based on peptide intensity. (B-F) Five peptide peaks were altered in NAT vs. tumor per P≤0.001. (B) Peptide 827.431, collagen α-1(I) chain amino acid domain 562–570, showed significant increases in tumor with AUROC of 0.7420 (P=0.00001); (C) Peptide 843.394, collagen α-1(I) chain amino acid domain 506–514, showed significant decreases in tumor with an AUROC of 0.7580 (P=0.0001); (D) Peptide 870.404, collagen α-1(I) chain amino acid domain 557–565, decreased in tumor with an AUROC of 0.7373 (P=0.0002); (E) Peptide 1041.540, collagen α-1(I) chain amino acid domain 347–358, decreased in tumor with an AUROC of 0.7334, (P=0.0002); (F) Peptide 1172.520, collagen α-1(III) chain amino acid domain 795–806 decreased in tumor with an AUROC of 0.7518 (P<0.0001). AA designates amino acid domain per each collagen. Peptides showed sensitive and specific discrimination between NAT and tumor by area under the receiver operating curve (AUROC) ≥0.7 and Wilson/Brown P≤0.0001. ***P<0.001 and ****P<0.0001. NAT, normal adjacent to tumors; Col, collagen; LN, natural log.
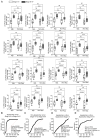
Figure 3. CRC tumors show alterations based on stage and regionalized Appalachian or non–Appalachian county origins. Stages are combined as Stage I + II (early) and Stage II + IV (late). (A) A total o...
Figure 3.
CRC tumors show alterations based on stage and regionalized Appalachian or non-Appalachian county origins. Stages are combined as Stage I + II (early) and Stage II + IV (late). (A) A total of sixteen peptides reported potential differences compared between Appalachian/non-Appalachian early/late stage within the same population group. Patient data is an average from a minimum of two cores per patient. AA designates amino acid domain per each collagen. (B) Combined results for area under the receiver operating curve showing significant discriminatory difference in Appalachian stage I + II compared with stage III + IV CRC. (C) Lower discriminatory difference in non-Appalachian stage I + II compared with stage III + IV CRC. (D) Combined results for area under the receiver operating curve showing no discriminatory difference in Appalachian compared with non-Appalachian in stage I/II CRC. (E) Significant discriminatory differences when comparing between Appalachian and non-Appalachian stage III + IV CRC. *P<0.05, **P<0.01, ***P<0.001 and ****P<0.0001. CRC, colorectal cancer; App., Appalachian; non-App., Appalachian; ns, not significant; Col, collagen; LN, natural log.
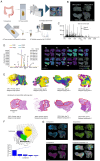
Figure 4. Complex peptide gradient patterns in CRC resections by collagen targeted mass spectrometry imaging. (A) Workflow took tissue sections from colorectal resections for experiments by high mass ...
Figure 4.
Complex peptide gradient patterns in CRC resections by collagen targeted mass spectrometry imaging. (A) Workflow took tissue sections from colorectal resections for experiments by high mass accuracy, high mass resolution imaging mass spectrometry. Image created using Biorender (biorender.com). (B) Photomicrograph of sections from four colorectal resections demonstrating different CRC features. (C) Total ion current over all four sections showed 4,696 peptides. (D) A high level of peptide complexity was found within a narrow mass window representing unique image patterns within the four sections (scale bar, 3 cm). (E) Heuristic peptide clustering of the 4,696 peak set by image segmentation shows high definition of pathologically defined regions found by hematoxylin and eosin pathology staining (scale bar, 1 cm). (F) Principal components analysis of all spectra (4,696 peak set) from pathological regions of tumor, mucosa and muscularis demonstrates separation based on pathological region. Component 1 represents 25.6% of variance derived from pathological location. (G) Spatial mapping of components 1 through 3 further confirmed distinct pathological regions defined by collagen peptide regulation (scale bar, 1 cm). CRC, colorectal cancer; LC-MS/MS, liquid chromatography-mass spectrometry.
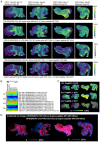
Figure 5. Variation in CRC pathology dependent on collagen peptide status of hydroxylated proline modification. (A) Case studies of example peptides identified by sequencing proteomics on the same tis...
Figure 5.
Variation in CRC pathology dependent on collagen peptide status of hydroxylated proline modification. (A) Case studies of example peptides identified by sequencing proteomics on the same tissue sections (G=grade). Each peptide reports unique spatial patterns following tissue pathology. Images are from high mass accuracy, high mass resolution imaging experiments by Fourier Transform Ion Cyclotron Resonance mass spectrometer. Parenthesis refers to site probability found by high mass accuracy, high mass resolution sequencing proteomics. (B) Peptide peak intensity varying by potential proline statin in pathological regions or across each section. Peaks are defined by difference in hydroxylated proline status within each peptide. Window for peak selection from image data was ± 5 ppm. (C) Example mapping of peaks defined by potential differences in proline status defined by high mass accuracy. (D) Combined ion image showing complementary peak distribution of a Col peptide with unmodified status or hydroxylated proline status. CRC, colorectal cancer; Col, collagen; HYP, hydroxylated proline.

References

    1. Wu X, Cai J, Zuo Z, Li J. Collagen facilitates the colorectal cancer stemness and metastasis through an integrin/PI3K/AKT/Snail signaling pathway. Biomed Pharmacother. 2019;114:108708. doi: 10.1016/j.biopha.2019.108708. - DOI - PubMed
    1. Nissen NI, Kehlet S, Boisen MK, Liljefors M, Jensen C, Johansen AZ, Johansen JS, Erler JT, Karsdal M, Mortensen JH, et al. Prognostic value of blood-based fibrosis biomarkers in patients with metastatic colorectal cancer receiving chemotherapy and bevacizumab. Sci Rep. 2021;11:1–12. doi: 10.1038/s41598-020-79608-0. - DOI - PMC - PubMed
    1. Longley DB, Harkin DP, Johnston PG. 5-fluorouracil: Mechanisms of action and clinical strategies. Nat Rev Cancer. 2003;3:330–338. doi: 10.1038/nrc1074. - DOI - PubMed
    1. Iacovelli R, Pietrantonio F, Maggi C, de Braud F, Di Bartolomeo M. Combination or single-agent chemotherapy as adjuvant treatment of gastric cancer: A systematic review and meta-analysis of published trials. Crit Rev Oncol Hematol. 2016;98:24–28. doi: 10.1016/j.critrevonc.2015.09.002. - DOI - PubMed
    1. Iacovelli R, Pietrantonio F, Palazzo A, Maggi C, Ricchini F, de Braud F, Di Bartolomeo M. Incidence and relative risk of grade 3 and 4 diarrhoea in patients treated with capecitabine or 5-fluorouracil: A meta-analysis of published trials. Br J Clin Pharmacol. 2014;78:1228–1237. doi: 10.1111/bcp.12449. - DOI - PMC - PubMed

LinkOut - more resources