

Immunogenic cell death-related biomarkers in heart failure probed by transcriptome and single-cell sequencing
- PMID: 40630963
- PMCID: PMC12234543
- DOI: 10.3389/fimmu.2025.1560903
Immunogenic cell death-related biomarkers in heart failure probed by transcriptome and single-cell sequencing
Abstract
Background: Heart failure (HF) represents the terminal stage of various cardiovascular disorders, with immunogenic cell death (ICD) potentially influencing HF progression through modulation of immune cell activity. This study aimed to identify ICD-associated biomarkers in patients with HF and explore their underlying mechanisms.
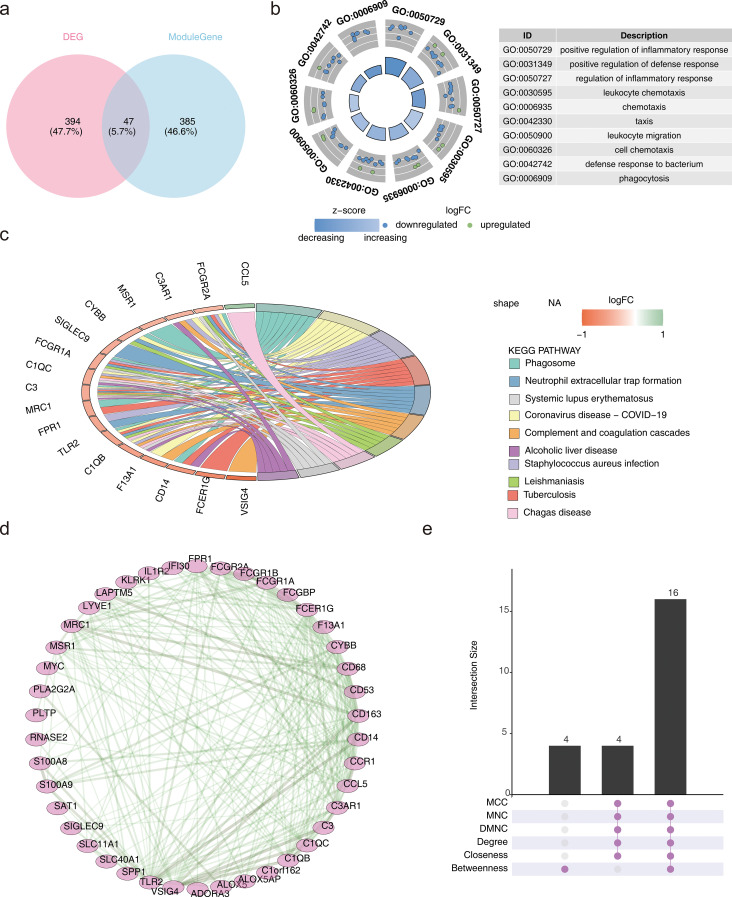
Methods: Data from GSE57338, GSE3586 and GSE5406 were retrieved from the Gene Expression Omnibus (GEO) database. Differential expression analysis and weighted gene co-expression network analysis (WGCNA) were employed to identify candidate genes, followed by enrichment analysis and Protein-Protein Interaction (PPI) network construction. Candidate biomarkers were selected using two machine learning approaches and validated for expression levels, with receiver operating characteristic (ROC) curve analysis determining the final biomarkers. A nomogram model was built based on the biomarkers, followed by molecular regulatory network analysis, gene set enrichment analysis (GSEA), immune infiltration assessment, and drug prediction. Additionally, key cells were selected for pseudo-time and cell communication analysis using the GSE183852 dataset. Next, pseudotemporal analysis was also performed on key cell subpopulations. Real-time quantitative PCR (RT-qPCR) was employed to validate the biomarkers.
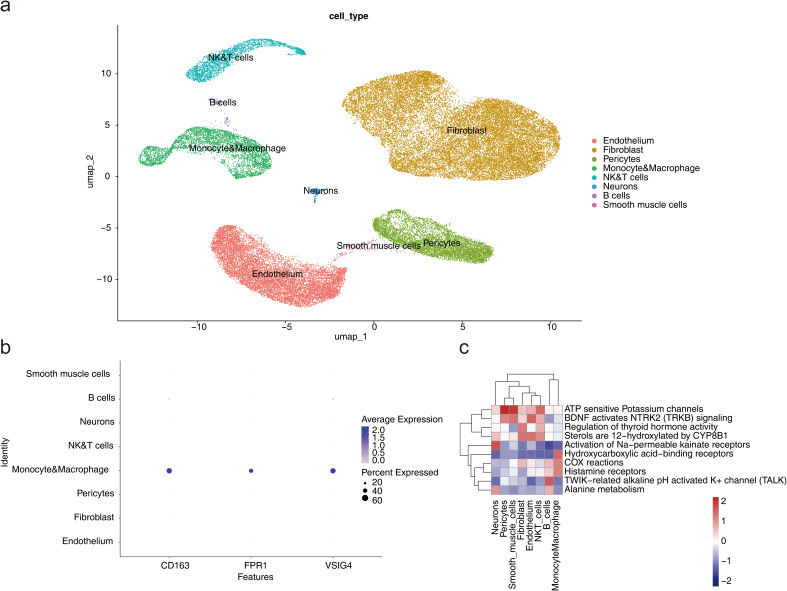
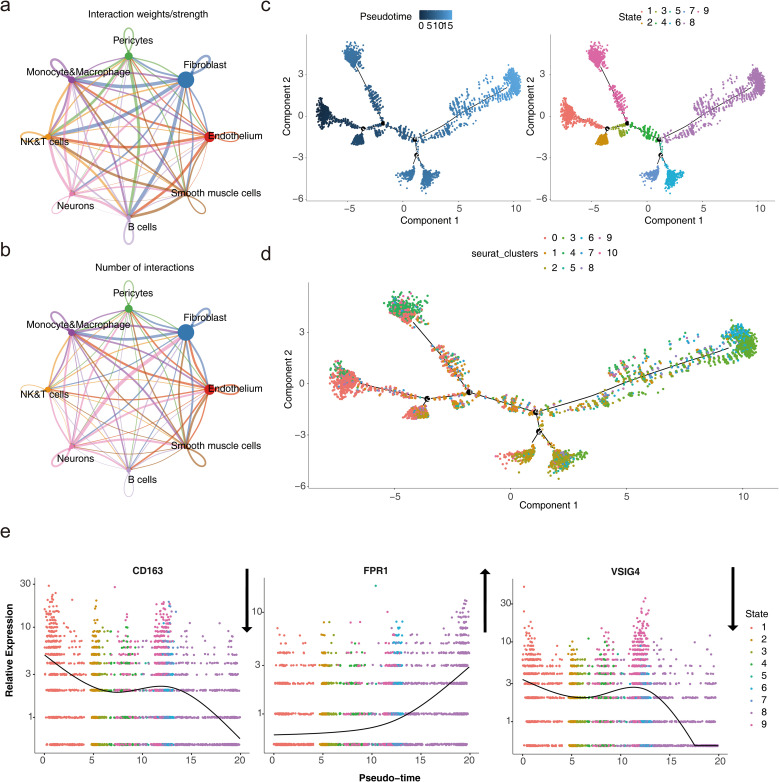
Results: Three biomarkers, CD163, FPR1, and VSIG4, were identified as having significant diagnostic value for HF. GSEA revealed their enrichment in ribosomal and immune cell-related pathways. These biomarkers were notably correlated with CD8 T cells and M2 macrophages. Carbachol and etynodiol were predicted to interact with all three biomarkers. Single-cell RNA sequencing identified nine cell types, with expression of the biomarkers confined to monocytes and macrophages. Strong cell communication was observed between these cell types and fibroblasts. Expression of CD163 and VSIG4 decreased over time in monocytes and macrophages, whereas FPR1 showed an upward trend. In addition, the expression levels of CD163 and VSIG4 increased in subpopulations of monocytes and macrophages, whereas FPR1 showed a decreasing trend. RT-qPCR results confirmed significant down-regulation of CD163, FPR1, and VSIG4 in patients with HF and animal models.
Conclusions: This study identified and validated three ICD-related biomarkers in HF-CD163, FPR1, and VSIG4-offering a novel theoretical foundation for the clinical diagnosis and treatment of HF.
Keywords: biomarker; heart failure; immunogenic cell death; monocytes and macrophages; single-cell RNA sequencing analysis.
Copyright © 2025 Wang, Wu, Han, Yan, Wang, He, Chen, Wang and Han.
Conflict of interest statement
The authors declare that the research was conducted in the absence of any commercial or financial relationships that could be construed as a potential conflict of interest.
Figures


Similar articles
-
Developing a Panel of Shared Susceptibility Genes as Diagnostic Biomarkers for chronic obstructive pulmonary disease and Heart Failure.Comput Biol Med. 2025 Sep;196(Pt A):110657. doi: 10.1016/j.compbiomed.2025.110657. Epub 2025 Jul 4. Comput Biol Med. 2025. PMID: 40617086
-
Constructing a tumor immune microenvironment-driven prognostic model in acute myeloid leukemia using bioinformatics and validation data.Sci Rep. 2025 Jul 18;15(1):26123. doi: 10.1038/s41598-025-03557-9. Sci Rep. 2025. PMID: 40681545 Free PMC article.
-
Identifying common genes and immune infiltration characteristics between systemic sclerosis and atherosclerosis.Clin Rheumatol. 2025 Aug;44(8):3217-3233. doi: 10.1007/s10067-025-07479-9. Epub 2025 Jun 20. Clin Rheumatol. 2025. PMID: 40540223
-
Markers of Iron Metabolism and Outcomes in Patients with Heart Failure: A Systematic Review.Int J Mol Sci. 2023 Mar 15;24(6):5645. doi: 10.3390/ijms24065645. Int J Mol Sci. 2023. PMID: 36982717 Free PMC article.
-
Systemic pharmacological treatments for chronic plaque psoriasis: a network meta-analysis.Cochrane Database Syst Rev. 2021 Apr 19;4(4):CD011535. doi: 10.1002/14651858.CD011535.pub4. Cochrane Database Syst Rev. 2021. Update in: Cochrane Database Syst Rev. 2022 May 23;5:CD011535. doi: 10.1002/14651858.CD011535.pub5. PMID: 33871055 Free PMC article. Updated.
References
MeSH terms
Substances
LinkOut - more resources
Full Text Sources
Medical
Research Materials
Miscellaneous