[Preprint]. 2025 Jul 3:2025.06.27.662030.
doi: 10.1101/2025.06.27.662030.

PROFET Predicts Continuous Gene Expression Dynamics from scRNA-seq Data to Elucidate Heterogeneity of Cancer Treatment Responses

Affiliations

PROFET Predicts Continuous Gene Expression Dynamics from scRNA-seq Data to Elucidate Heterogeneity of Cancer Treatment Responses

Yu-Chen Cheng et al. bioRxiv. .

Abstract

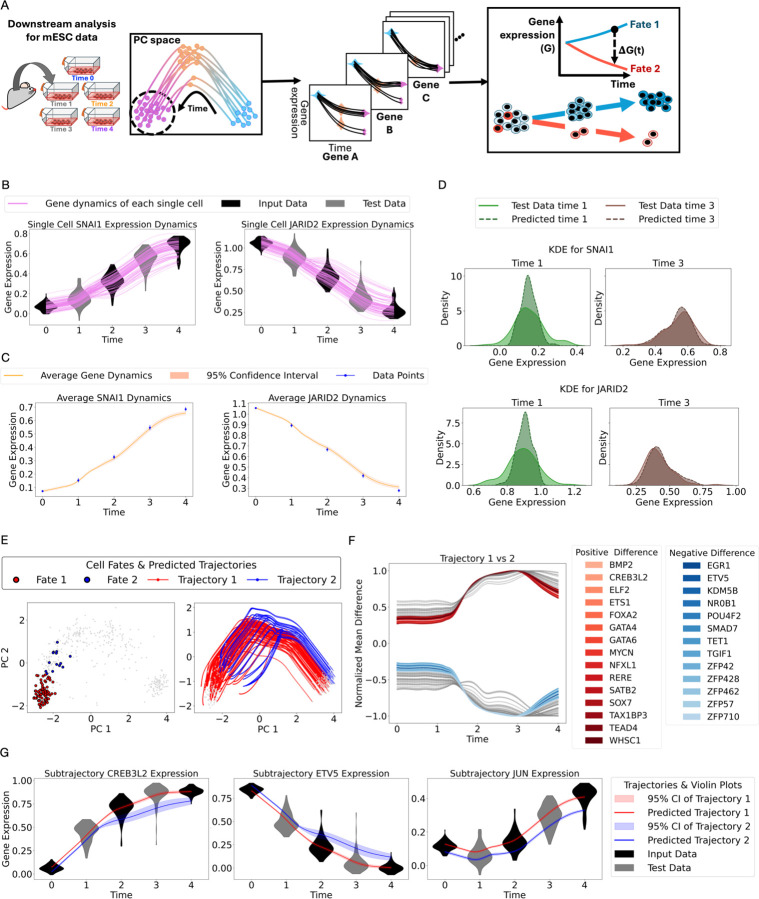
Single-cell RNA sequencing captures static snapshots of gene expression but lacks the ability to track continuous gene expression dynamics over time. To overcome this limitation, we developed PROFET (Particle-based Reconstruction Of generative Force-matched Expression Trajectories), a computational framework that reconstructs continuous, nonlinear single-cell gene expression trajectories from sparsely sampled scRNA-seq data. PROFET first generates particle flows between time-stamped samples using a novel Lipschitz-regularized gradient flow approach and then learns a global vector field for trajectory reconstruction using neural force-matching. The framework was developed using synthetic data simulating cell state transitions and subsequently validated on both mouse and human in vitro datasets. We then deployed PROFET to investigate heterogeneity in treatment responses to palbociclib, a CDK4/6 inhibitor, in hormone receptor positive breast cancer. By comparing newly generated scRNA-seq data from a palbociclib-resistant breast cancer cell line with published patient-derived datasets, we identified a subpopulation of patient cells exhibiting profound phenotypic shifts in response to treatment, along with surface markers uniquely enriched in those cells. By recovering temporal information from static snapshots, PROFET enables inference of continuous single-cell expression trajectories, providing a powerful tool for dissecting the heterogeneity of cell state transitions in treatment responses.


Figures

Figure 1.
Figure 1.. Reconstruction of continuous single-cell gene expression dynamics from discrete scRNA-seq data.
(A) Study objective and approach. Left: Existing scRNA-seq technologies capture only static snapshots of cell states, limiting the ability to observe continuous trajectories. Right: To address this limitation, we developed PROFET to reconstruct continuous gene expression dynamics from sampled scRNA-seq time points (colored), while masking intermediate time points (gray) for validation. (B) Two-step architecture of PROFET. Step 1: Apply Generative Particle Algorithm (GPA) to infer gradient flows interpolating between observed distributions at adjacent time points. Step 2: Use a neural network to perform force-matching on these flows and learn a globally smooth, time-dependent vector field that models cell dynamics. (C–E) Three key downstream analyses enabled by our method. (C) Prediction of continuous single-cell gene expression dynamics. (D) Classification of predicted trajectories into terminal fates, enabling tracing fate-assigned cells to their origins. (E) Identification of diverse temporal gene expression patterns associated with distinct fates, illustrated by three representative genes: left panel shows early divergence, middle shows late divergence, and right shows no divergence.
Figure 2.
Figure 2.. PROFET model development and validation process.
(A) Overview of the synthetic data generation process simulating TGF-β–induced EMT using a gene regulatory network model. (B) PROFET development using synthetic EMT data. The model is trained using input from time points 0, 2, and 4 to reconstruct full single-cell trajectories. Hyperparameters were selected to ensure stable, non-divergent trajectories that align with the distributions at the withheld test time points. (C) Schematic of the validation process using mESC differentiation data. The model, with fixed hyperparameters, is applied to reconstruct trajectories from input data at time points 0, 2, and 4, and evaluated using held-out data from time points 1 and 3. (D) Principal component analysis (PCA) of the mESC dataset (left), and predicted single-cell trajectories by PROFET (right), with the trajectories colored by predicted time from day 0 to day 4. (E) Distribution distance between predicted trajectories and ground truth snapshots at each time point, computed using W2 (left) and MMD (right). (F) Comparison of predicted cell states at test time points (days 1 and 3) across three methods: PROFET (blue dots); WOT (magenta crosses), which uses an optimal transport plan and linear interpolation; and random coupling (black crosses), which applies a uniform transport plan with linear interpolation. (G) Prediction errors measured by W2, Sinkhorn, and MMD metrics across PROFET (blue), WOT (magenta), and random coupling (black), showing consistent outperformance of the other two methods by PROFET.
Figure 3.
Figure 3.. Downstream analysis of reconstructed single-cell trajectories for mESC data.
(A) Overview of the downstream analysis pipeline for mESC differentiation. The process begins with PROFET-reconstructed single-cell trajectories in PCA space. These trajectories are then inverse-mapped back to the original gene expression space to recover dynamic gene expression profiles for each gene in each cell. Subsequently, we investigate gene expression differences across distinct sub-trajectories to identify the timing and magnitude of divergence associated with different terminal fates. ΔG(t) denotes the temporal difference in mean gene expression between sub-trajectories. (B) Single-cell, single-gene dynamics plotted as gene expression levels (y-axis) over time (x-axis), with each green curve representing an individual cell trajectory. The predicted trajectories are compared against real data distributions using violin plots (gray for test data, black for training data). (C) Predicted average gene expression trajectories (orange curves with shaded regions indicating 95% confidence intervals) compared to actual gene expression levels from real data (blue dots with error bars). (D) Comparison of predicted and actual gene expression distributions at day 1 (green) and day 3 (brown). Predicted distributions are shown as dashed lines, with real data distributions shown as solid lines. (E) Classification of differentiation fates and ancestral trajectory tracing. Left panel: Two distinct cell fate subgroups at day 4, identified through clustering analysis. Right panel: Ancestral trajectories of the two subgroups traced back to earlier time points. (F) Temporal quantification of gene expression divergence between fate groups. Normalized mean differences are plotted over time, with genes exceeding a divergence threshold of 0.5 highlighted. Positive values indicate higher expression in trajectory group 1, and negative values indicate higher expression in trajectory group 2. (G) Examples of gene expression divergence in the two subpopulations. Three representative genes are shown, with average gene expression trajectories plotted separately for each subgroup (shaded regions indicate 95% confidence intervals).
Figure 4.
Figure 4.. Downstream analysis of reconstructed single-cell trajectories for EMT data.
(A) Illustration of EMT scRNA-seq data. (B) Application of PROFET to reconstruct continuous trajectories using only data from time points 0 and 4, with time point 2 held out for validation. The colormap represents the predicted time along the trajectory, ranging from time 0 to time 4, and the test data is highlighted by orange circles. (C) Comparison of test data predictions (time 2) between the PROFET (blue dots) and the WOT method (magenta crosses). (D) Quantitative comparison of prediction errors at time 2 across three methods—PROFET (blue), WOT (magenta), and random coupling (black)—measured using W2, Sinkhorn (entropy = 0.1, 1, 10), and MMD metrics. (E) Single-cell, single-gene dynamics, showing gene expression levels (y-axis) over time (x-axis). Each green curve represents an individual cell trajectory, with predicted trajectories compared against real data distributions using violin plots (gray for test data, black for training data). (F) Comparison of predicted and actual gene expression distributions at time 2. Predicted distributions are shown as dashed lines, while real data distributions are shown as solid lines. (G) Classification of ancestral cell subgroups and forward trajectory predictions. Left: Two distinct cell subpopulations at time 0, identified via clustering. Right: Forward-predicted trajectories of these two subpopulations. (H) Normalized mean differences in gene expression between the two trajectory groups are plotted over time. Positive values indicate higher expression in group 1, while negative values indicate higher expression in group 2. Genes exhibiting a drop greater than 0.5 in normalized mean difference at specific time points are highlighted, indicating pronounced convergence in expression levels between the two trajectories. (I) Representative examples of gene expression convergence. Four genes are shown, with average gene expression forward trajectories plotted separately for each ancestral subpopulation.
Figure 5.
Figure 5.. Reconstructed single-cell trajectories for palbociclib resistance.
(A) Overview of the datasets analyzed (upper table): one in vitro cell line experiment and three patient-derived datasets—one from Luo et al. and two from Klughammer et al. The lower panel illustrates the objective of applying PROFET to these datasets: to identify single cells that undergo significant phenotypic switching in response to palbociclib treatment. (B) Each row represents one dataset. Left: PCA projection of scRNA-seq data, with pre-treatment cells in magenta and post-treatment cells in teal. Right: Kernel density estimates (KDE) of phenotypic shifts, defined as the Euclidean distances between initial and final cell states for each single-cell trajectory inferred by PROFET. C) Trajectories of resistance in HR+ breast cancer. Each row corresponds to one dataset. The first panel presents the full set of continuous single-cell trajectories reconstructed by PROFET. The subsequent three panels display subsets of trajectories grouped by their magnitudes of phenotypic shift, quantified as the Euclidean distances between initial and final cell states, as defined in (B).
Figure 6.
Figure 6.. Downstream analysis of reconstructed single-cell trajectories in palbociclib resistance.
(A) Schematic overview of the key biological questions addressed through downstream analyses of reconstructed single-cell trajectories that link pre-treatment and post-treatment states. (B) Differential gene expression analysis comparing post- versus pre-treatment time points for each dataset. Color indicates the direction and magnitude of log2 fold change (red: upregulated, blue: downregulated). (C) Representative examples of gene expression dynamics for individual cells in the in vitro dataset. Violin plots show observed gene expression levels used as input for trajectory inference; magenta lines represent predicted trajectories for each single cell. (D) Representative gene dynamics for individual cells across three patient datasets. Violin plots show real expression data; colored lines represent predicted trajectories from three subgroups of cells defined by low, medium, and high phenotypic shift levels, as described in Figure 5. (E) Differential expression analysis of surface marker genes in pre-treatment cells from patient PA3 (Luo et al.), comparing high versus low phenotypic shift subgroups. Red dots indicate significantly differentially expressed genes (p < 0.05, |log2 fold change| > 1.1). Blue-labeled genes represent significantly upregulated genes (positive log2 fold change) that are significantly upregulated in the other two patients (862 and 887) from Klughammer et al. The Venn diagram summarizes the overlap of differentially expressed surface markers across all three datasets.

References

    1. Purvis J. E. & Lahav G. Encoding and Decoding Cellular Information through Signaling Dynamics. Cell 152, 945–956 (2013). - PMC - PubMed
    1. Skylaki S., Hilsenbeck O. & Schroeder T. Challenges in long-term imaging and quantification of single-cell dynamics. Nat Biotechnol 34, 1137–1144 (2016). - PubMed
    1. Mazutis L. et al. Single-cell analysis and sorting using droplet-based microfluidics. Nat Protoc 8, 870–891 (2013). - PMC - PubMed
    1. Tanay A. & Regev A. Scaling single-cell genomics from phenomenology to mechanism. Nature 541, 331–338 (2017). - PMC - PubMed
    1. Wagner D. E. & Klein A. M. Lineage tracing meets single-cell omics: opportunities and challenges. Nat Rev Genet 21, 410–427 (2020). - PMC - PubMed

Publication types

LinkOut - more resources