[Preprint]. 2025 Jul 4:2025.07.01.662594.
doi: 10.1101/2025.07.01.662594.

Robust Production of Parvalbumin Interneurons and Fast-Spiking Neurons from Human Medial Ganglionic Eminence Organoids

Affiliations

Robust Production of Parvalbumin Interneurons and Fast-Spiking Neurons from Human Medial Ganglionic Eminence Organoids

Maria C Varela et al. bioRxiv. .

Abstract

The medial ganglionic eminence (MGE) gives rise to parvalbumin (PV)- and somatostatin (SST)-expressing cortical interneurons essential for regulating cortical excitability. Although PV interneurons are linked to various neurodevelopmental and neurodegenerative disorders, reliably generating them from human pluripotent stem cells (hPSCs) has been extremely challenging. We present a robust, reproducible protocol for generating single-rosette MGE organoids (MGEOs) from hPSCs. Transcriptomic analyses reveal that MGEOs exhibit MGE regional identity and faithfully model the developing human fetal MGE. As MGEOs mature, they generate abundant PV-expressing cortical interneurons, including putative basket and axoaxonic cells, at a scale not previously achieved in vitro. When fused with hPSC-derived cortical organoids, these interneurons rapidly migrate into cortical regions, integrate into excitatory networks, and contribute to complex electrophysiological patterns and the emergence of large numbers of fast-spiking neurons. MGEOs thus offer a powerful in vitro approach for probing human MGE-lineage cortical and subcortical GABAergic neuron development, modeling various neuropsychiatric disorders, and advancing cell-based therapies for neurodevelopmental and neurodegenerative disorders.

Keywords: GABAergic; axoaxonic cells; basket cells; brain organoid; forebrain development; multielectrode array; neuronal migration; pluripotent stem cells.


Conflict of interest statement

Declaration of interests The authors have no financial or other competing interests to declare.

Figures
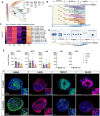
Figure 1:
Figure 1:. Generation of human subpallial brain organoids with MGE regional specificity
(A) Schematic of tangential migration of MGE-derived interneurons, key markers differentiating MGE from nearby brain regions, and the distribution of key patterning molecules Sonic Hedgehog (SHH) and Wingless-related Integration Site (WNT). (B) Protocol variations tested for generating brain organoids with MGE regional specificity. DXSB condition: 2uM DMH1, 2uM XAV939, 10uM SB431542. (C) Heat map of relative mRNA levels measured by qRT-PCR in 18 DIV organoids exposed to various timings and concentrations of SAG and with or without continued (cont.) XAV939 after DXSB. n=1–2 differentiations per condition of 2E iPSCs. Graphed as Log10FC relative to GAPDH and iPSC baseline. Text in blue indicates the condition that most closely produced the expected MGE regional expression levels (high LHX6, low PAX6 and RX). (D) Final protocol for generating MGEOs. Boxes in blue above the timeline illustrate the key steps at days 4 (monolayer cutting) and 10 (transitioning organoids from 3D adherent to suspension culture). (E) Relative mRNA expression of 1-, 2- and 3-month MGEOs for key regional markers. n≥5 differentiations between 3 cell lines. Graphed as average ΔΔCT fold change ± SEM, normalized to GAPDH and relative to average iPSC baseline. Shapes denote hPSC line and colors indicate age (triangle: 2E, circle: 79B, diamond: H9; gray: 1 month, purple: 2 month, orange: 3 month). (F) immunostaining of MGEOs at 1-month (top) and 3-months (bottom) shows the expected strong expression of GABA (green), LHX6 (red), NKX2–1 (green), and Olig2 (red). Bisbenzimide nuclear stain (DNA) is in blue. A higher magnification view is shown in the inset of each image. Abbreviations: NCx: Neocortex; LGE: Lateral Ganglionic Eminence; Str: Striatum; GP: Globus pallidus; MGE: medial ganglionic eminence; POA: preoptic area; Hyp: Hypothalamus; ECM: extracellular matrix.
Figure 2:
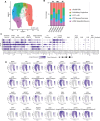
Figure 2:. Single-Cell RNA sequencing of 1-month old MGEOs derived from 3 cell lines
(A) UMAP plot of 1-month-old MGEOs with color coded and numbered clusters. n=90,631 total cells from 6 samples (2 experimental replicates per hPSC line, 6–8 organoids pooled per sample). (B) Left: Stacked bar graphs denoting the cluster percent composition for each individual sample included in the UMAP in panel A. Right: Cluster name and color key. (C) Dot plot showing expression of markers of interest by cell cluster. Circle size denotes percent of cells within a given cluster that expresses the gene of interest. Dot color indicates average expression level relative to other clusters. Dots were included for all genes that contained greater than 1 percent of cells in a cluster. All cells with >0 expression levels were included in the analysis. (D) Individual UMAP plots of selected genes. Color gradient denotes expression levels from none (light gray) to highest (dark purple) as depicted by the scale on the right of each plot. Abbreviations: GE: Ganglionic Eminences; MGE: Medial Ganglionic Eminence; IN: Interneurons; POA: Preoptic area; CGE: Caudal Ganglionic Eminence; LGE: Lateral Ganglionic Eminence; NPC: Neural Progenitor Cell; Cycling Projen: Cycling Progenitors.
Figure 3.
Figure 3.. MGEOs generate human MGE-derived cell-types
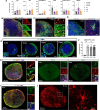
(A) RT-qPCR of 1-, 2- and 3-month MGEOs shows expected mRNA transcript expression of GABAegic, potassium channel, and MGE-derived markers. n≥5 differentiations between 3 cell lines, graphed as average fold change (ΔΔCT) ± SEM, normalization to GAPDH and relative to average iPSC baseline. Shapes denote cell line and color indicates time point (triangle: 2E, circle: 79B, diamond: H9; gray: 1-month, purple: 2-month, orange: 3-month). (B-D) Immunostaining for cell type-specific markers in 3-month MGEOs. Dashed boxes in B and C denote regions of interest (ROI) shown to the right of each respective image.

(E) Representative images of immunostaining for parvalbumin (PV, green) at 3-, 4-, 6- and 8-months (mo) in vitro shows robust PV expression in MGEOs from 4 months onwards. Nuclei are shown in blue with bisbenzimide staining. Dashed boxes denote ROI shown at higher magnification (inset). (F) Quantification of PV expression as percentage (%) of organoid area ± SD. n=5–8 organoids per timepoint, from n= 2–3 differentiations / cell-line. One way ANOVA with Dunnett’s T3 multiple comparisons post hoc test. P= 0.0036 (**). (G) Immunostaining of 6-month organoids shows colocalization of PV (green) and MEF2C (red), bisbenzimide staining in blue. Dashed box denotes ROI shown at right. (H) Immunostaining of 3-month (left) and 8-month (right) MGEOs shows that the voltage-gated potassium channel Kv3.1 (green) is expressed in MEF2C+ (red) cells at 8 months. Dashed boxes are shown to the right of each image as higher-magnification views of individual red and green channels and also merged with bisbenzimide nuclear stain (DNA, blue). (I) Immunostaining of 6-month MGEOs shows PV (green) co-expressed with the perineuronal net marker WFA (red). Dashed boxed area is shown on the right as higher-magnification views of individual red and green channels and also merged with bisbenzimide nuclear stain (blue). (J) Confocal imaging of PV basket cell-specific AAV1-BiPVe3-dTom virus expression in live-imaged 6-month-old MGEOs reveals complex morphologies of putative PV basket cells.
Figure 4:
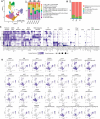
Figure 4:. scRNA-seq analysis of 3-month MGEOs reveals MGE specificity
(A) UMAP plot shows 10 clusters from six 3-month-old MGEO samples, 2 differentiations per cell line, with clusters color-coded and numbered. Middle: bar graphs denote the percentages of cells within each sample that correspond to each cluster shown on the UMAP. Each sample contains cells from 4–6 pooled organoids, with samples 1 & 2 derived from H9 (female, hESC-derived), samples 3 & 4 from 79B (female, blood-derived), and samples 5 & 6 from 2E (male, foreskin fibroblast-derived) hPSC lines. Right: Legend of cluster identities by number and color. (B) Average percentage of cells in each cluster by cell line (2 differentiations per line). (C) Dot plots showing expression of markers of interest by cell cluster. Circle size denotes the percentage of cells that express the gene of interest within a given cluster, while dot color indicates average expression level relative to all other clusters. Analysis parameters and abbreviations are the same as in Figure 2C. (D) Individual UMAP plots of selected genes. Color gradients (at the right of each plot) denote a range from no expression (light gray) to highest expression (dark purple).
Figure 5.
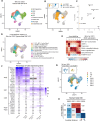
Figure 5.. MGEOs transcriptome closely resembles the developing human MGE
(A) UMAP plot of human GW9–18 single-cell RNA-sequencing data from Shi et al., 2021, with color-coded regional and cell type clustering. (B) Integrated UMAP plot of scRNAseq data from 3-month MGEOs (orange) compared to human fetal GEs from gestational weeks (GW) 9–18 (Shi et al. 2021. Human fetal MGE cluster: Blue; non-MGE clusters: grey). Insets show the MGEO cluster and human MGE cluster alone. (C) Principal component analysis (PCA) of 3-month MGEO scRNA-seq data (orange dot) compared to human fetal GE scRNA-seq clusters (gestational weeks 9–18; Shi et al., 2021, black dots) shows that MGEOs are most similar to the human MGE cluster. (D) UMAP showing 3-month MGEO cell type clusters integrated with human GW9–18 fetal GEs (Shi et al., 2021; in gray). MGEO cell clustering and colors as in Figure 4. (E) Heat map of Pearson correlation coefficients for comparison of 3-month MGEO neuronal clusters 1–7 (columns, numbered as in panel D and Figure 4) with Shi et al. 2021 human fetal MGE subclusters (rows). (F) Heat map comparing the average percentage of cells expressing selected gene markers for MGE, LGE, CGE, and preoptic area/hypothalamus (POA/Hypo) across single-cell RNA-sequencing datasets from 3-month MGEOs, human fetal MGE (Shi et al., 2021; gestational weeks 9–18), and other subpallial organoids of similar timepoints (Xiang et al., 2017; Birey et al., 2017). (G) Integrated UMAP of 3-month MGEO and human fetal GE scRNA-seq data, as shown in panels B and D. Developmental age clusters from Shi et al. are depicted in shades of blue, while 3-month MGEO cells are colored by cell line (red: H9; green: 79B; yellow: 2E). Insets display human fetal cells (left) and MGEO cells (right) separately. (H) Heatmap of PCA Euclidean distances comparing each 3-month MGEO cell line to human fetal gestational developmental ages (GW 9, 12, 16, and 18) shows 3-month MGEOs are, on average, closest to human developmental timepoints GW12–16.
Figure 6:
Figure 6:. MGEO-derived neurons rapidly migrate in 2D and 3D assays, and they integrate within dorsal cortical organoids in assembloids
(A) Diagram of 2D migration assay. (B) Images of MGEOs at 32 hours post-plating (hr pp) at 10 DIV, and (B’) 0, 12, and 24 hr pp at 21 DIV on ECM (Geltrex, 1:50). Also see supplemental video S1 for a representative timelapse video of migrating progenitors. (C) Confocal images of a MGEO fixed 3 days post plating and immunolabeled for MAP2ab (red) and LHX6 (green) show that migrated cells are MGE-derived neurons. Bisbenzimide (DNA) in blue. Boxed region of upper left image is shown at higher magnification in the other panels. (D) Schematic of assembloid protocol, involving viral labeling at 48 DIV, fusion at 56 DIV, and subsequent live confocal microscopy from 24 hours to 15 days post fusion (DPF). (E-F) Images from representative MGEO-CO assembloids at 4 (E) or 5 and 10 (F) DPF. mDLX-GFP (green) virus labels GABAergic cells originating from the MGEO, whereas tdTomato (red) labels cortical organoid progenitors and putative excitatory neurons. See supplementary video S2 for a video of this migration in a live assembloid taken 5 DPF. (G) Quantification of migration of mDLx-GFP+ virally labeled MGEO interneurons into COs at 24 hours, 3–5 days, and 10–15 DPF. Percentage area of GFP expression in the CO organoid area ± standard deviation (SD) is shown. Points represent single organoid replicates (n≥4), with the point shape denoting the cell line used (triangle: 2E, circle: 79B, diamond: H9). (H) Timelapse live imaging of a mDLX-GFP-labeled MGEO interneuron within the CO region of a 2E MGEO-CO assembloid shows characteristic interneuron leading edge branching movement patterns. Time is listed as hr:min. The white arrow denotes the neuronal soma, and the yellow arrowhead points to branching of the leading process. Also see supplementary video S3. (I) Confocal image of an MGEO-CO assembloid at 6 months shows full fusion into a single spherical structure. The boxed area in the left panel is expanded in the right panels. Labeling with mDLX-GFP (green) and tdTomato (red) is as described in D-F. (J) Immunostaining of a 7.5 month MGEO:CO assembloid shows expression of GABAergic post- and pre-synaptic markers Gephyrin (green) and vGAT (red), respectively, on a CAG-tdTom CO neuron (pseudocolored blue). Boxed area in the left panel is shown at higher magnification at right, with white arrowheads in the merged image showing closely apposed vGAT+ and Gephyrin+ puncta. (K) Immunolabeling of a 6-month MGEO:CO assembloid shows VGAT puncta (green) localized along an Ankyrin G (AnkG)-positive axon initial segment (white).
Figure 7.
Figure 7.. MGEO-CO assembloids form functional excitatory and inhibitory synapses, and display increased complexity of network activity and fast-spiking units over time
(A) Diagram of organoid slicing and whole-cell patch clamp recordings of MGEO-CO assembloid excitatory and inhibitory neurons. (B) Representative traces showing spontaneous (B) and evoked (B’) repetitive firing of mDLX-GFP+ (MGEO-derived) neurons in MGEO-CO assembloid slices at 204 DIV. Repetitive AP firing was evoked from resting membrane potential by injection of 1500 ms pulse currents of 20 pA. (C) Representative trace of spontaneous excitatory postsynaptic currents (sEPSCs) recorded from an mDLX-GFP+ (MGEO-derived) neuron within an MGEO-CO assembloid slice at 204 DIV at a holding potential of −70 mV. (D) Representative trace of spontaneous inhibitory postsynaptic currents (sIPSCs) recorded from a CAG-tdT+ (CO-derived) neuron in the same assembloid slice as (C). (D’) sIPSC were recorded at a holding potential of −70 mV in the presence of 6-cyano-7-nitroquinoxaline-2,3-dione (CNQX, 10 μM) and amino-5-phosphonopentanoic acid (APV, 50 – 100 μM) in the external solution to block glutamate receptor-mediated synaptic responses. (E) Brightfield image of a 6 month MGEO-CO assembloid cultured in suspension and acutely plated on an MEA plate for recording. (F) Representative MEA voltage traces from 3 electrodes taken from n = 2 representative MGE-CO assembloid recordings shown over a 2 s window (left) and a 5 min window (right). (G) Cumulative distribution of maximum firing rates between DIV-140 CO-CO (gray) and MGEO-CO (light blue) assembloids. n=3 each from 2 cell lines with 62 putative units per assembloid type. Two-tailed Kolmogorov-Smirnov test, P = 0.0056. (H) Representative raster plots of putative units in MGEO-CO assembloids at different maturation stages: DIV-140 (n=3), DIV-212 (n=4–6), and DIV-235 (n = 4–6) MGE-CO assembloids from 2 cell lines. (I-J) Cumulative distribution of maximum firing rates (I) and burst counts (J) across maturation stages (DIV-140, DIV-212, and DIV-235) using same samples as in H. Two-tailed Kolmogorov-Smirnov test, DIV 140 vs 212: (I) KS=0.5010, P=2.3247e-07, (J) KS=0.5062, P=1.6290 ×10⁻⁷. DIV 140 vs 235: (I) KS Stat=0.4597, P=4.1009e-06, (J) KS Stat=0.5123, P=1.5173 ×10⁻⁷ DIV 212 vs 235: (I) KS Stat=0.1350, p-value=8.1858e-01, (J) KS=0.1404, P=0.77593. N=38–62 putative units/3–5 assembloids per developmental window. (K) Electrode-matched representative voltage traces from a 5 min recording before (gray, top) and after (black, bottom) application of 10 μM bicuculline. (L) Firing rate per burst of putative units. Boxplots display the median, 25th and 75th percentiles (box edges), whiskers extending to the most extreme data points, and individual outliers plotted separately. Two-tailed Mann-Whitney U=113, P= 0.007, Pre Bic treatment: N= 9–11 putative units/3 MGEO-COs, During Bic treatment: 8–10 putative units/2 MGEO-COs. (M) Representative voltage trace with corresponding raster plots of three putative units recorded during a network burst. Orange represents a putative regular-spiking unit (RS1), while brown (FS1) and beige (FS2) represent putative fast-spiking units. (N) Quantification from panel (M): histogram distribution of putative FS vs. RS units pooled from n = 10 assembloids across at least two independent differentiations each from 2 different cell lines. (N’) representative voltage traces of putative RS and FS units aligned to the trough. The mean trough-normalized waveforms of each unit are overlaid, showing trough to peak (TTP) measurements and non-overlapping RS and FS waveforms. MEA data shown is pooled from 2–4 independent differentiations.

References

    1. Buzsáki G., and Chrobak J.J. (1995). Temporal structure in spatially organized neuronal ensembles: a role for interneuronal networks. Curr Opin Neurobiol 5, 504–510. 10.1016/0959-4388(95)80012-3. - DOI - PubMed
    1. Hájos N., Pálhalini J., Mann E.O., Nèmeth B., Paulsen O., and Freund T.F. (2004). Spike Timing of Distinct Types of GABAergic Interneuron during Hippocampal Gamma Oscillations In Vitro. The Journal of Neuroscience 24, 9127. 10.1523/JNEUROSCI.2113-04.2004. - DOI - PMC - PubMed
    1. Jacobs J., Kahana M.J., Ekstrom A.D., and Fried I. (2007). Brain oscillations control timing of single-neuron activity in humans. Journal of Neuroscience 27, 3839–3844. 10.1523/JNEUROSCI.4636-06.2007,. - DOI - PMC - PubMed
    1. Bartos M., Vida I., Frotscher M., Meyer A., Monyer H., Geiger J.R.P., Jonas P., and Heidelberg (2002). Fast synaptic inhibition promotes synchronized gamma oscillations in hippocampal interneuron networks. Proc Natl Acad Sci U S A 99, 13222–13227. 10.1073/PNAS.192233099,. - DOI - PMC - PubMed
    1. Marín O. (2012). Interneuron dysfunction in psychiatric disorders. Nat Rev Neurosci 13, 107–120. 10.1038/nrn3155. - DOI - PubMed

Publication types