[Preprint]. 2025 Jul 3:2025.07.02.662844.
doi: 10.1101/2025.07.02.662844.

Genetics of growth rate in induced pluripotent stem cells

Affiliations

Genetics of growth rate in induced pluripotent stem cells

Brian N Lee et al. bioRxiv. .

Abstract

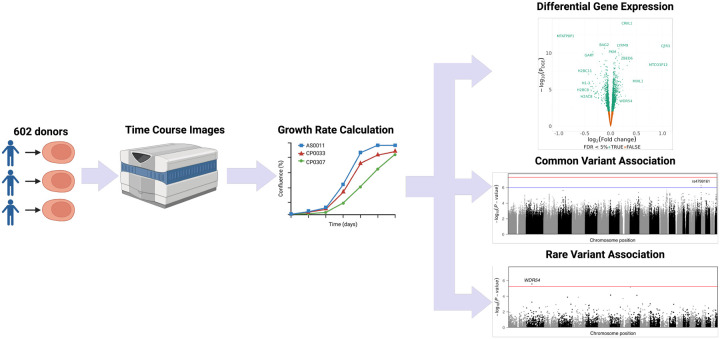
Human induced pluripotent stem cells (iPSCs) have transformed biomedical research by enabling the generation of diverse cell types from accessible somatic tissues. However, certain fundamental biological properties, such as the genetic and epigenetic determinants of iPSC proliferation, remain poorly characterized. We measured the growth of iPSC lines derived from 602 unique donors using high-throughput time-lapse imaging, quantified proliferation through a growth Area-Under-the-Curve (gAUC) phenotype, and correlated gAUC with the gene expression and genotype of the cell lines. We identified 3,091 genes associated with gAUC, many of which are well established regulators of cell proliferation. We also found that rare deleterious variants in WDR54 were associated with reduced iPSC growth and that WDR54 was differentially expressed with respect to gAUC. Although no common variants showed a genome-wide association with gAUC, iPSC lines from monozygotic twins were highly correlated, and common genetic variation explained approximately 71-75% of the variance in iPSC growth rates. These results indicate a complex genetic architecture of iPSC growth rates, where rare, large-effect variants in important growth regulators, including WDR54, are layered onto a highly polygenic background. These findings have important implications for the design of pooled iPSC-based studies and disease models, which may be confounded by intrinsic growth differences.


Conflict of interest statement

LGB is a member of the Illumina Medical Ethics advisory board, receives research support from Merck, and royalties from Wolters-Kluwer.

Figures

Fig. 1.
Fig. 1.. Graphical overview of this study.
Human iPSCs from multiple cohorts were cultured in 96-well plates until confluence. Daily cell density measurements were obtained via imaging cytometry. Upon reaching confluence, cells were harvested for bulk RNA sequencing, genotyping, and genome sequencing, enabling differential expression analysis and both common- and rare-variant association studies.
Fig. 2.
Fig. 2.. Covariate associations with growth Area-Under-the-Curve (gAUC) and differential gene expression analyses.
(A) Effect size (y-axis) with 95% confidence intervals (CIs; lines) of iPSC line characteristics (x-axis). Color denotes FDR < 5%. (B) Volcano plots of log2(fold change) (x-axis) and −log10(P) (y-axis) from differential gene expression analysis. Color denotes associated genes (FDR < 5%).
Fig. 3.
Fig. 3.. Common-variant association study
(A) Manhattan plot of common variant associations (points) with gAUC. Nominal association threshold (P < 1 × 10⁻⁶) is indicated by the blue line. Genome-wide association threshold (P < 5 × 10⁻⁸) is indicated by the red line. (B) Percent of growth rate variance explained by the genetic relatedness matrix (y-axis) across different models (x-axis). The horizontal axis and colors indicate the model—either all samples (green), samples with RNA-seq (orange), or RNA-seq samples with pluripotency covariates (purple). The vertical error bars indicate 95% confidence intervals (CIs). (C) Power estimates (y-axis) by sample size (x-axis). Color indicates absolute effect size modelled.
Fig. 4.
Fig. 4.. Rare-variant association study
(A) Manhattan plot of rare variant associations (points) with gAUC. The horizontal red line indicates Bonferroni P-value threshold (P < 5.90 × 10⁻⁶). (B) The mean confluence trajectories stratified by rare-variant burden scores (color) for WDR54 with confluence percentage (y-axis) over time (x-axis). (C) A scatterplot displaying the relationship between WDR54 gene expression (x-axis) and the average gAUC (y-axis) per line (points). The shaded ribbon indicates the 95% CI.

References

    1. Park I.-H., Zhao R., West J.A., Yabuuchi A., Huo H., Ince T.A., Lerou P.H., Lensch M.W., and Daley G.Q. (2008). Reprogramming of human somatic cells to pluripotency with defined factors. Nature 451, 141–146. 10.1038/nature06534. - DOI - PubMed
    1. Takahashi K., Tanabe K., Ohnuki M., Narita M., Ichisaka T., Tomoda K., and Yamanaka S. (2007). Induction of pluripotent stem cells from adult human fibroblasts by defined factors. Cell 131, 861–872. 10.1016/j.cell.2007.11.019. - DOI - PubMed
    1. Yu J., Vodyanik M.A., Smuga-Otto K., Antosiewicz-Bourget J., Frane J.L., Tian S., Nie J., Jonsdottir G.A., Ruotti V., Stewart R., et al. (2007). Induced pluripotent stem cell lines derived from human somatic cells. Science 318, 1917–1920. 10.1126/science.1151526. - DOI - PubMed
    1. Veres A., Faust A.L., Bushnell H.L., Engquist E.N., Kenty J.H.-R., Harb G., Poh Y.-C., Sintov E., Gürtler M., Pagliuca F.W., et al. (2019). Charting cellular identity during human in vitro β-cell differentiation. Nature 569, 368–373. 10.1038/s41586-019-1168-5. - DOI - PMC - PubMed
    1. Pagliuca F.W., Millman J.R., Gürtler M., Segel M., Van Dervort A., Ryu J.H., Peterson Q.P., Greiner D., and Melton D.A. (2014). Generation of functional human pancreatic β cells in vitro. Cell 159, 428–439. 10.1016/j.cell.2014.09.040. - DOI - PMC - PubMed

Publication types

LinkOut - more resources