[Preprint]. 2025 Jul 6:2025.07.04.663231.
doi: 10.1101/2025.07.04.663231.

Product-stabilized filamentation by human glutamine synthetase allosterically tunes metabolic activity

Affiliations

Product-stabilized filamentation by human glutamine synthetase allosterically tunes metabolic activity

Eric Greene et al. bioRxiv. .

Abstract

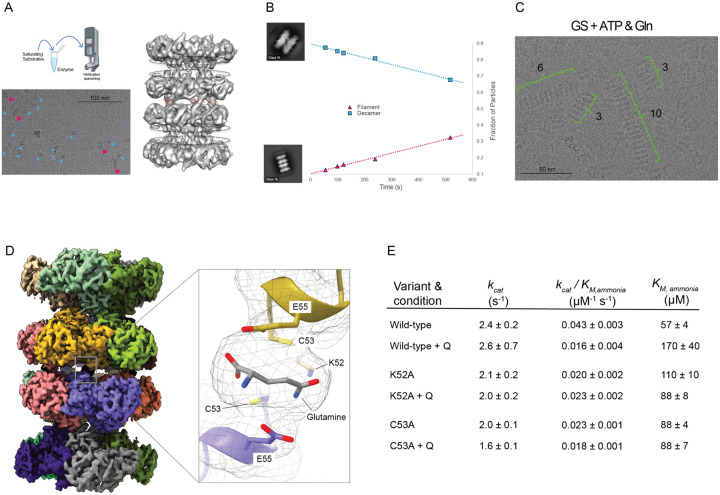
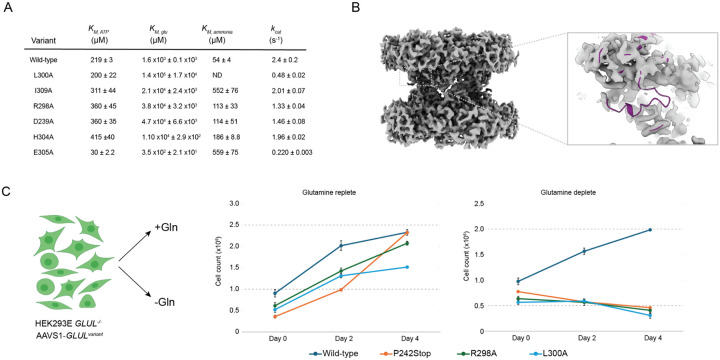
To maintain metabolic homeostasis, enzymes must adapt to fluctuating nutrient levels through mechanisms beyond gene expression. Here, we demonstrate that human glutamine synthetase (GS) can reversibly polymerize into filaments aided by a composite binding site formed at the filament interface by the product, glutamine. Time-resolved cryo-electron microscopy (cryo-EM) confirms that glutamine binding stabilizes these filaments, which in turn exhibit reduced catalytic specificity for ammonia at physiological concentrations. This inhibition appears induced by a conformational change that remodulates the active site loop ensemble gating substrate entry. Metadynamics ensemble refinement revealed >10 Å conformational range for the active site loop and that the loop is stabilized by transient contacts. This disorder is significant, as we show that the transient contacts which stabilize this loop in a closed conformation are essential for catalysis both in vitro and in cells. We propose that GS filament formation constitutes a negative-feedback mechanism, directly linking product concentration to the structural and functional remodeling of the enzyme.


Conflict of interest statement

Conflicts of interest HY is an employee of JSR. J.S.F. is a consultant to, a shareholder of, and receives sponsored research support from Relay Therapeutics.

Figures

Figure 1.
Figure 1.. Human Glutamine Synthetase Forms Filaments.
A) At top, reaction mechanism of glutamine synthetase. Middle: surface representation of PDB:2QC8 ADP + Methionine sulfoximine (MSO) bound x-ray crystal structure of human glutamine synthetase. Bottom: N-terminal His6-tag perturbs structure of human glutamine synthetase (GS) as observed by 2D classification of negative stain and cryoEM data. B) Size-exclusion chromatography reveals His6-tag dramatically alters the oligomeric state of human GS and scarless GS can form higher order oligomers. C) His6-tagged GS displays strongly altered steady-state kinetic constants when compared to scarless GS. N.D. = not defined as His6-tagged GS also display inefficient coupling of ATP hydrolysis with glutamine formation and thus KM,ammonia could not be defined for this enzyme. D) cryoEM reconstruction of apo-GS filament form. Decamers are rotated relative to each other by ~26 degrees. The minimal five-fold filament interface formed consists of K52, C53, and E55 of adjacent monomers from different decamers. No obvious connecting cryoEM density is observed in the apo map. E) Bifunctional crosslinking with Bis-sulfosuccinimidyl glutarate (BSG; top) or bis-maleimoethane (BMOE; bottom) to covalently attached adjacent primary amines (K52) or cysteines (C53) respectively followed by SDS-PAGE reveals crosslinked species only in the wild-type GS protein sample, but not K52A or C53A indicating presence and disruption of filament formation respectively.
Figure 2:
Figure 2:. Glutamine binds to GS filaments at the interface.
A) Establishment of steady state conditions prior to vitrification with GS at low concentration (0.15 mg/mL) revealed presence of 2-decameric species (red arrows) in addition to decameric species (blue arrows) during cryoEM grid screening. Initial reconstruction of the turnover 2-decameric map demonstrated clear density connecting decamers (red dotted circle) not previously observed in the apo-filament map and loss of E305-loop density (black dotted circle). B) Time-resolved cryoEM demonstrates linear relationship between glutamine and filament formation assessed by independently processing five datasets and quantifying the fraction of decamer and filament present (see Methods) and plotted against the vitrification quench time of the reaction. C) cryoEM screening data demonstrating robust filament seeding from addition of ATP and glutamine to human GS prior to vitrification. D) Turnover-filament 3D reconstruction demonstrates similar overall architecture to apo-filament map (left) but with clear density between decamers with glutamine modeled which forms hydrogen bonds with K52, C53, and E55 (right). E) Steady-state ammonia kinetic constants for wild-type, K52A, and C53A with and without 10 mM glutamine added to reaction to stimulate filament formation. Errors were calculated as S.E.M. from global fitting and were propagated through each Michaelis-Menten parameter (Equations 2–4; n = 8 replicates) see Methods.
Figure 3:
Figure 3:. Variable E305-loop density and conformations in human glutamine synthetase.
A) Turnover-decamer cryoEM density map is colored based on monomer except for one E-305 loop with is colored cyan and ADP density that is colored purple demonstrating how the E305-loop closes over the active site to enclose the glutamate and ammonia binding site. B) CryoEM E305-loop density representations for the apo-filament, ATP-filament, turnover-filament, and turnover-decamer maps with 2QC8 docked into each map shown in red. The contour is chosen to equalize the relative density levels in other regions of the protein (Supplementary Figure 11). C) Representation of EMMIVox ensembles of the E305-loop (residues 295–309) for one pentamer (decamer-orange and filament-blue) overlaid with ribbon structure of consensus model (tan). (D) Single filament and decamer turnover monomers overlaid and presented in blue and orange respectively presenting a hydrophobic stabilizing patch (I285, L300, and I309) and stabilizing salt-bridge (D239 and R298) in the ‘closed active’ loop state that is missing in the filament models. Distance measurements calculated across full EMMIVox ensembles represented as kernel density function between residues participating in ‘closed active’ loop state are presented demonstrating bias away from these contacts in the turnover filament form. (E) Same as (D) but representing the ‘tip’ of the loop showing E305 hydrogen bonding with S66 and H304 hydrogen bonding with N246 with quantification of these distances from the ensemble. In all cases, the filament oligomeric state under turnover conditions disfavored these interactions. (F) MD-refinement of the cryoEM filament turnover map revealed active site loop infiltration into the active site with R299 hydrogen bonding with active site residues E136 (top left) with distance quantification of R299 to E136 in the active site (top right). At bottom, overlay of all ten monomers per MD-refined model with loops in ribbon, ADP in stick, and the rest of the model is represented in surface. The filament loop is in an outward conformation from the active site at the base of helix 8.
Figure 4.
Figure 4.. Global conformational change is associated with loop conformational heterogeneity under turnover conditions.
(A) Left: rotational motion about the pentameric interface observed where models were aligned on the bottom monomer and rotation seen in the upper monomer is noted (decamer in yellow and filament in blue). Middle: representation of the decameric turnover cryoEM map colored per monomer with outlines showing relevant areas shown at left and right. Right: monomeric interface within a pentamer overlay of the turnover filament model (gray) with turnover decamer model colored by monomer (tan, green, and red). Ligands are colored by atom type. Arrows indicate conformational change from filament to decamer state. The largest Ca distance change not including the E305-loop is indicated between residues 74 and 263 from across the pentamer. (B) Ca distance difference matrix for chain G between turnover decamer and turnover filament models with the E305-loop (residues 289–312) and the far C-terminal peptide (369–373) omitted with a cartoon secondary structure representation of a monomer on top and distance color legend at right demonstrating that the tip of the B-grasp region (60–76) and helix 8 (residues 262–282) showing the largest conformational differences. (C) Ca distance differences for residues 74 and 263 between the turnover filament and turnover decamer ensembles demonstrating a robust 2 angstrom distance difference.
Figure 5
Figure 5. Glutamine synthetase E305-loop conformation controls Michaelis-complex formation.
A) Steady-state kinetic parameters for wild-type GS (also displayed in Figure 2) and six point-mutants of GS, L300A, I309A, R298A, D239A, H304A, E305A as assessed by the coupled-ADP release assay (methods). (B) cryoEM density map for R298A decamer under turnover conditions displayed in full (left) with inset focused on loop density (right) demonstrating complete loss of the E305-loop for this variant. (C) Schematic of HEK293E GLUL−/− cell line auxotrophic for glutamine is reconstituted with single genomic integration of individual GLUL variants (methods) and used to assess glutamine prototrophy. All variant cell lines grow equivalently in glutamine replete media conditions (middle) but only the wild-type GLUL variant could support cell growth and survival under glutamine deplete conditions, whereas R298A, L300A, and a premature stop codon at P242 all led to cell death.
Figure 6:
Figure 6:. Filament formation tunes E305-loop dynamics to modulate enzyme activity.
Left: cryoEM map of the turnover filament which includes a higher KM, ammonia and open E305-loop indicated at bottom and by an ‘open’ red colored E305-loop cartoon. Also indicated is the global conformational change that opens up the monomeric interfaces about the active site (yellow lines). This form of the enzyme is increased with increased GS concentration and/or glutamine concentration and is different from the decamer which includes a more closed active site and less conformationally heterogeneous E305-loop. Right: proposed conformational landscape of GS wherein the global fold of the enzyme is largely retained and subtle conformational/ensemble changes found in the low thermodynamic basin are present. Inset: the E305-loop ensemble is depicted for the turnover decamer, turnover filament, and E305-loop mutants wherein the decamer slightly favors an active-closed state, the filament an open-ensemble, and loop variants significantly favor the open-ensemble state.

References

    1. Abraham Mark James, Murtola Teemu, Schulz Roland, Páll Szilárd, Smith Jeremy C., Hess Berk, and Lindahl Erik. 2015. “GROMACS: High Performance Molecular Simulations through Multi-Level Parallelism from Laptops to Supercomputers.” SoftwareX 1–2 (September):19–25.
    1. Albe K. R., Butler M. H., and Wright B. E.. 1990. “Cellular Concentrations of Enzymes and Their Substrates.” Journal of Theoretical Biology 143 (2): 163–95. - PubMed
    1. Arad G., Freikopf A., and Kulka R. G.. 1976. “Glutamine-Stimulated Modification and Degradation of Glutamine Synthetase in Hepatoma Tissue Culture Cells.” Cell 8 (1): 95–101. - PubMed
    1. Atkinson D. E. 1965. “Biological Feedback Control at the Molecular Level.” Science (New York, N.Y.) 150 (3698): 851–57. - PubMed
    1. Berendsen H. J. C., Postma J. P. M., van Gunsteren W. F., DiNola A., and Haak J. R.. 1984. “Molecular Dynamics with Coupling to an External Bath.” The Journal of Chemical Physics 81 (8): 3684–90.

Publication types