[Preprint]. 2025 Jul 6:2025.07.06.663377.
doi: 10.1101/2025.07.06.663377.

An Epigenomic Roadmap Primes Non-Growing Oocytes for Maturation and Early Embryogenesis

Affiliations

An Epigenomic Roadmap Primes Non-Growing Oocytes for Maturation and Early Embryogenesis

Mengwen Hu et al. bioRxiv. .

Abstract

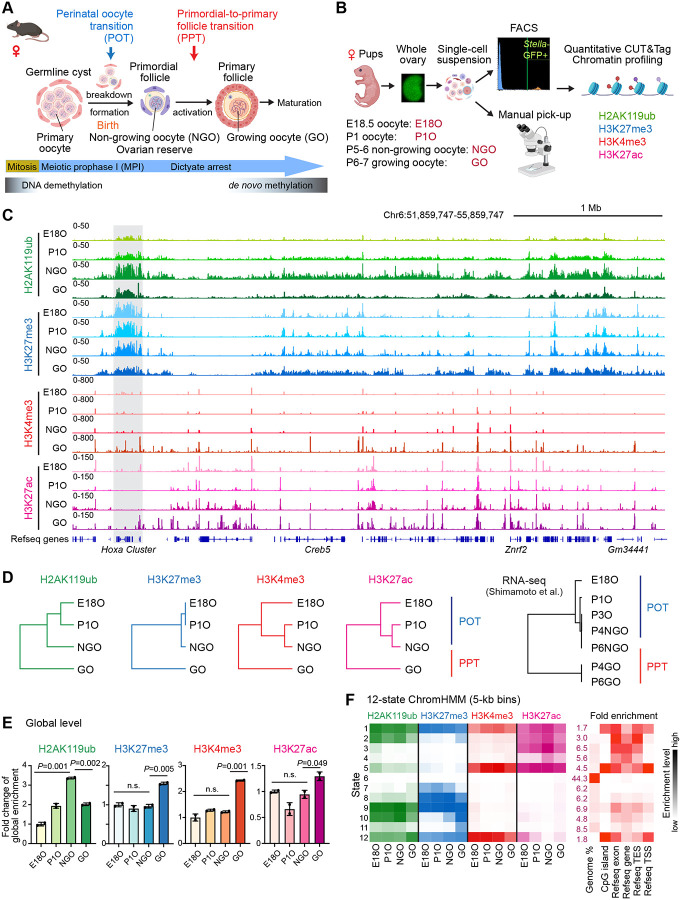
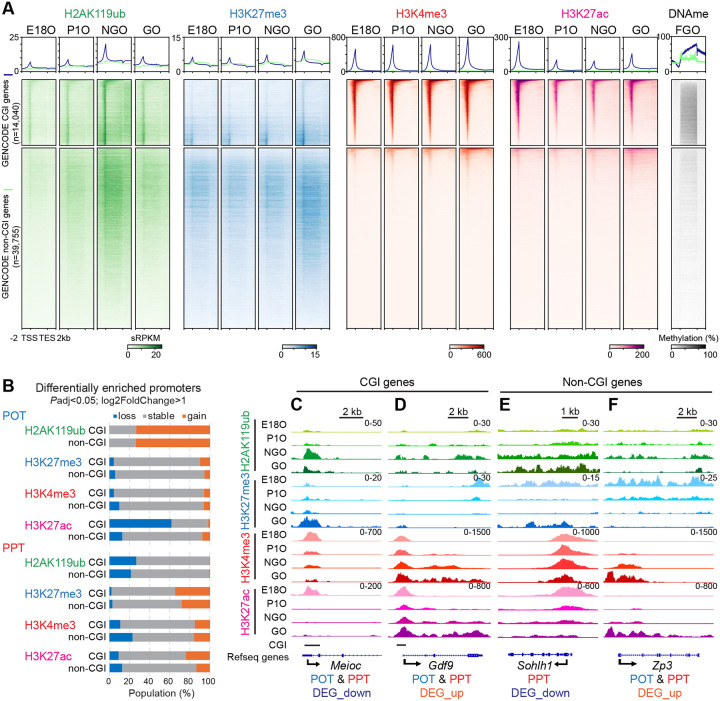
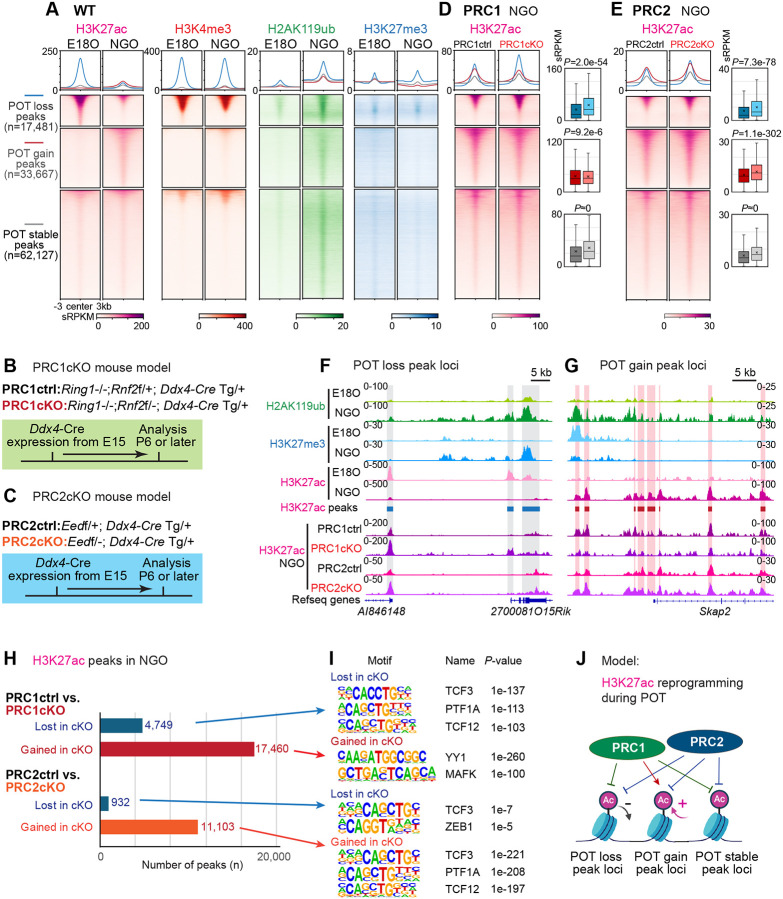
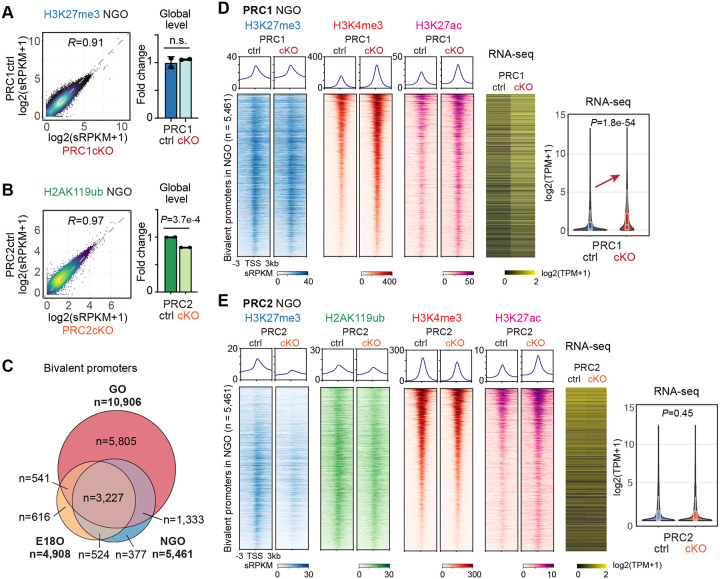
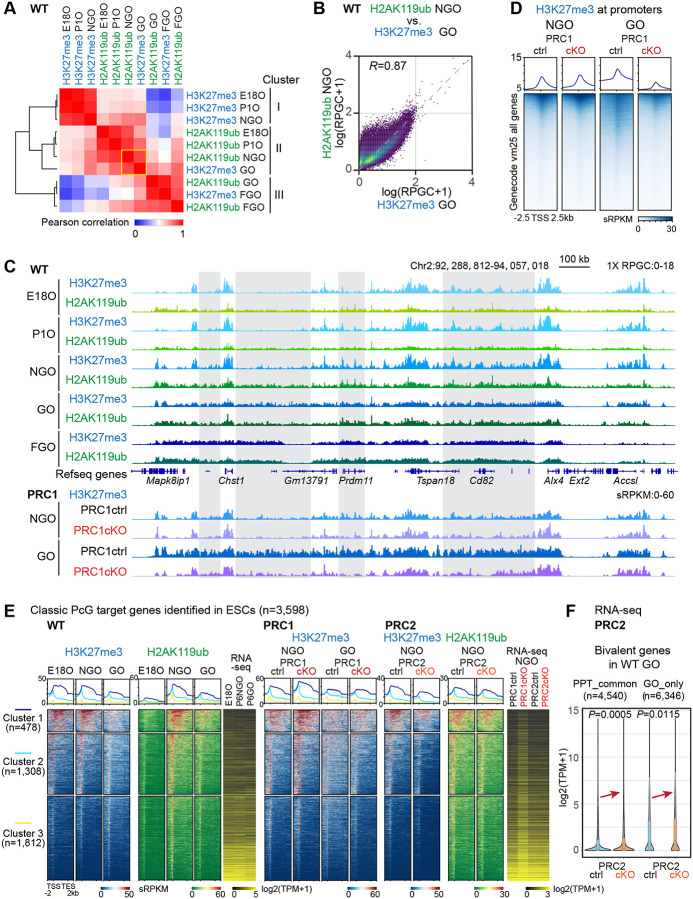
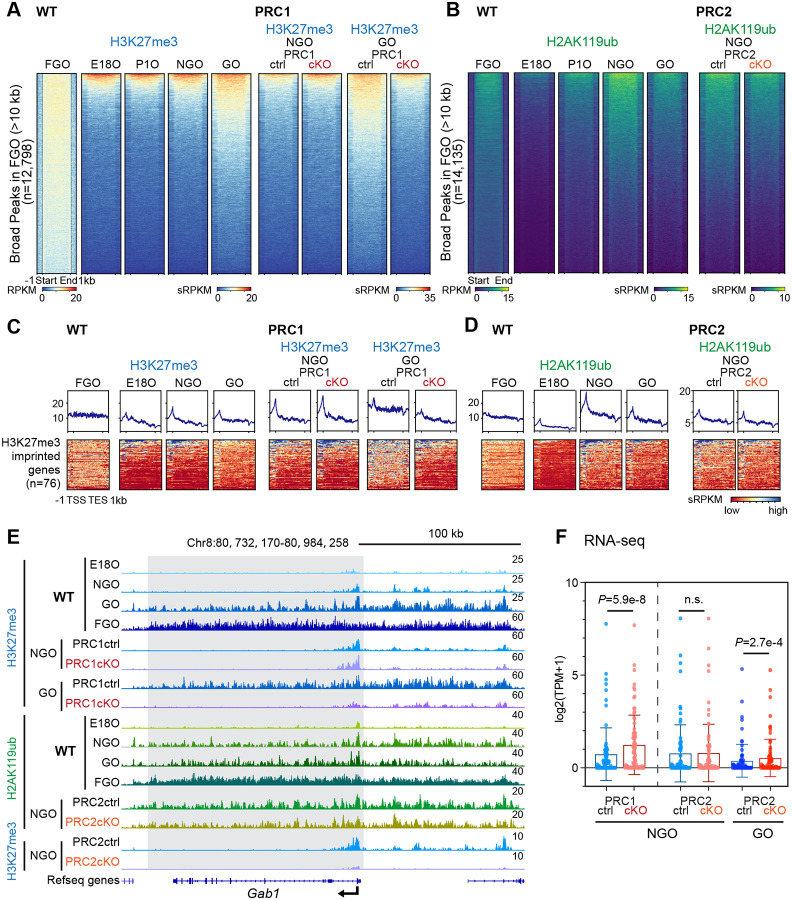
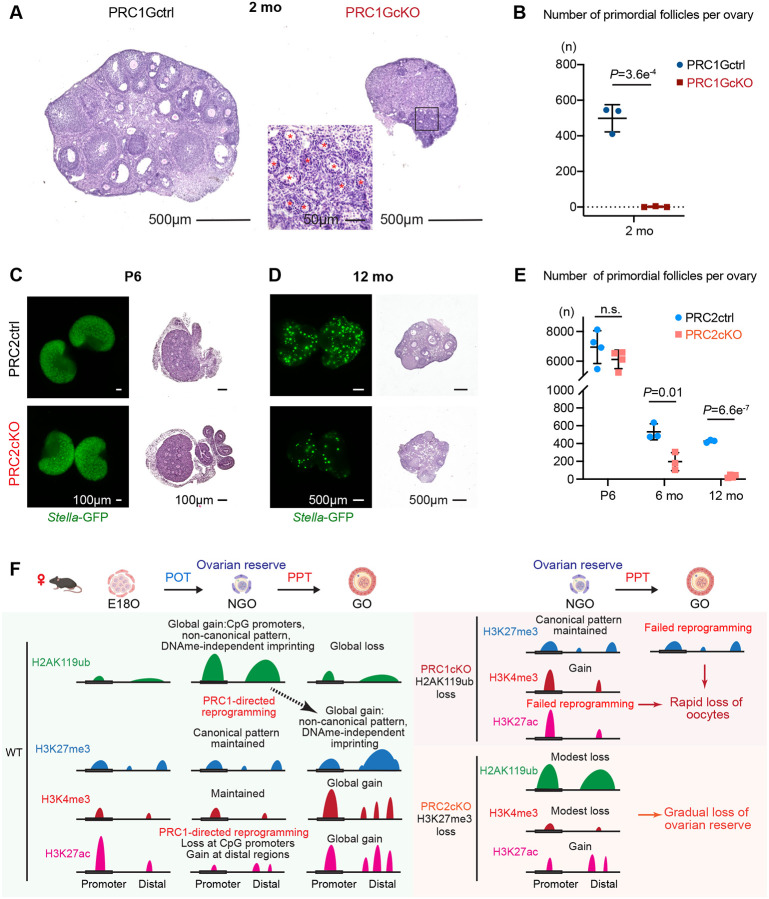
Female reproductive lifespan is defined by long-lived, non-growing oocytes (NGOs) that comprise the ovarian reserve. NGOs are assumed to acquire the epigenetic marks that will define the early embryo only after they exit the ovarian reserve and become activated for growth. Contrary to this dogma, we show that mouse NGOs possess abundant histone modifications that both underlie maintenance of the ovarian reserve and prime the epigenome of growing oocytes for early embryogenesis. As NGOs are established around birth, Polycomb Repressive Complex 1 (PRC1) mediates abundant H2AK119 ubiquitylation and reprograms the H3K27 acetylation landscape, which is essential to maintain the ovarian reserve. Importantly, the PRC1-driven epigenetic state of NGOs provides a blueprint for subsequent generation of a PRC2-catalyzed H3K27 trimethylation profile in growing oocytes that is characterized by broad domains and DNA methylation-independent imprints that are transmitted to the embryo. Thus, Polycomb complexes play pivotal roles in priming the NGO epigenome for oocyte maturation and early embryogenesis.

Keywords: Epigenetics; Epigenomics; Germline; Imprinting; Oogenesis; Ovarian reserve; Polycomb.


Conflict of interest statement

Declaration of interests The authors declare no competing interests.

Figures

Figure 1
Figure 1. Dynamic epigenomic landscapes in perinatal oocytes.
(A) Schematic of mouse perinatal oogenesis (created with BioRender.com). DNA methylation levels are represented with a graph. NGO, non-growing oocyte; GO, growing oocyte. (B) Overview of the experimental steps for chromatin profiling using quantitative CUT& Tag on perinatal oocytes (created with BioRender.com). (C) Genome browser views of H2AK119ub, H3K27me3, H3K4me3 and H3K27ac landscapes during perinatal oogenesis. (D) Hierarchical clustering of global H2AK119ub, H3K27me3, H3K4me3, and H3K27ac in 10-kb bins and hierarchical clustering of gene expression across all stages during perinatal oogenesis in wild-type. E18O represents oocytes in meiotic prophase I; P1O and P3O represent oocytes transitioning to dictyate arrest; P4 and P6 small oocytes represent NGO residing in primordial follicles; and P4 and P6 large oocytes represent GO in primary follicles after initiation of oocyte growth. (E) Bar chart showing the foldchange of global levels of H2AK119ub, H3K27me3, H3K4me3, and H3K27ac as determined by quantitative CUT&Tag in perinatal oocytes (n = 2 biological replicates, indicated by dots). P values of pairwise comparisons (two-sided unpaired Student’s t-test) are given. n.s., not significant. Data are represented as mean ± SD. (F) Heatmap illustrating chromatin state dynamics in perinatal oocytes using ChromHMM analysis. The intensity of colors indicates the enrichment level for each modification belonging to the given state at each stage. Genome distributions of all 12 states were shown on the right. The intensity of colors indicates the fold enrichment level of the given state. The number in the first column represents the genome coverage percentage of each state.
Figure 2
Figure 2. Coordinated chromatin changes drive transcriptional transitions during POT and PPT.
(A) Average tag density plots and heatmaps showing H2AK119ub, H3K27me3, H3K4me3, and H3K27ac dynamics at gene body regions (TSS -TES ± 2 kb) of CGI genes and non-CGI genes in perinatal oocytes. The color keys represent signal intensity, and the numbers represent spike-in scaled RPKM (sRPKM) values. Right: average tag density plot and heatmap showing DNA methylation levels in full-grown oocytes (FGO) of corresponding CGI and non-CGI gene groups. The color keys represent signal intensity, and the numbers represent DNA methylation percentage. (B) Bar charts showing percentages of differentially enriched promoters of CGI and non-CGI genes for H2AK119ub, H3K27me3, H3K4me3, and H3K27ac during POT and PPT. (C-F) Track views of the representative POT or PPT DEGs in CGI gene group (Meioc and Gdf9) and non-CGI gene group (Sohlh1 and Zp3) gene loci showing differential H2AK119ub, H3K27me3, H3K4me3, and H3K27ac occupancy during perinatal oogenesis. Data ranges in the upper right represent sRPKM values from combined replicates.
Figure 3
Figure 3. PRC1 regulates H3K27ac reprogramming during ovarian reserve formation.
(A, D and E) Average tag density plots and heatmaps showing histone modification changes at differential H3K27ac peaks region (peak center ± 3 kb) in E18O and NGO of WT (A), NGO of PRC1ctr&cKO (D), NGO of PRC2ctrl&cKO (E), respectively. Right: Box and whisker plots showing quantifications of H3K27ac enrichment within peaks (sRPKM values) of indicated peak groups in PRC1ctr&cKO, PRC2ctrl&cKO, respectively. Boxes show the 25th and 75th percentile with the median, and whiskers indicate 1.5 times the interquartile range. P values of pairwise comparisons (two-sided unpaired Student’s t-test) are given. (B and C) Schematic of mouse models and experiments. (F and G) Track views of the representative POT loss (F) or POT gain (G) H3K27ac peaks region showing H2AK119ub, H3K27me3, and H3K27ac occupancy during POT in WT, and H3K27ac changes in PRC1ctr&cKO, PRC2ctrl&cKO NGO. Data ranges represent sRPKM values from combined replicates. (H and I) Bar chart showing numbers (H) and motif analysis (I) of differentially enriched H3K27ac peaks in NGO of PRC1ctrl&cKO, PRC2ctrl&cKO. (J) A schematic model showing the regulation of H3K27ac reprogramming during POT by Polycomb.
Figure 4
Figure 4. Distinct functions of PRC1 and PRC2 in gene repression in non-growing oocytes.
(A and B) Density scatter plots showing genome-wide H3K27me3 enrichment by 10-kb bins comparing PRC1ctrl and PRC1cKO NGO (A), or H2AK119ub in PRC2ctrl and PRC2cKO NGO (B). The Pearson correlation coefficient is indicated. The bar charts on the right show the foldchange of H3K27me3 global level in PRC1ctrl and PRC1cKO NGO (A) or H2AK119ub in PRC2ctrl and PRC2cKO NGO (B). (n = 2 biological replicates, indicated by dots). P values of pairwise comparisons (two-sided unpaired Student’s t-test) are given. n.s., not significant. Data are represented as mean ± SD. (C) Venn diagrams showing bivalent promoters dynamics in perinatal oocytes. Numbers and percentages of total bivalent promoters are indicated. (D and E) Average tag density plots and heatmaps showing histone modifications changes at WT NGO bivalent promoter regions (TSS ± 3 kb) in PRC1ctrl&cKO NGO (D) or PRC2ctrl&cKO NGO (E). The color keys represent signal intensity, and the numbers represent sRPKM values. Right: Heat map and violin plots with included boxplots showing RNA expression (log2-transformed TPM) of corresponding bivalent genes in PRC1ctrl&cKO NGO (D) or PRC2ctrl&cKO NGO (E). Boxes show the 25th and 75th percentile with the median, and whiskers indicate 1.5 times the interquartile range. P values of pairwise comparisons (two-sided unpaired Student’s t-test) are given.
Figure 5
Figure 5. PRC1-H2AK119ub in the ovarian reserve programs PRC2-H3K27me3 in growing oocytes.
(A) Heatmaps with hierarchical clustering showing the Pearson correlation of PRC1-H2AK119ub and PRC2-H3K27me3 genome-wide distribution (Reads per genomic content :RPGC) in different oocyte developmental stages. (B) Density scatter plots showing genome-wide distribution between H2AK119ub in WT NGO and H3K27me3 in WT GO by 10-kb bins. The Pearson correlation coefficient is indicated. (C) Genome browser views of H2AK119ub and H3K27me3 landscapes in different oocyte development stages of WT, and H3K27me3 in PRC1ctrl&cKO oocytes. (D) Average tag density plots and heatmaps showing H3K27me3 changes at promoter regions (TSS ± 2.5 kb) in PRC1ctrl and PRC1cKO oocytes. The color keys represent signal intensity, and the numbers represent sRPKM values. (E) Average tag density plots and heatmaps of k-means clusters showing H2AK119ub and H3K27me3 enrichment at gene regions (TSS-TES ± 2 kb) of classic Polycomb-target genes in WT, PRC1, and PRC2 oocytes of indicated genotypes. Right: heatmaps showing RNA-seq expression (log2-transformed TPM) of corresponding k-means clusters in WT, PRC1, and PRC2 oocytes of indicated genotypes. (F) Violin plots with included boxplots showing RNA expression (log2-transformed TPM) of WT GO bivalent genes in PRC2ctrl&cKO GO. Boxes show the 25th and 75th percentile with the median, and whiskers indicate 1.5 times the interquartile range. P values of pairwise comparisons (two-sided unpaired Student’s t-test) are given.
Figure 6
Figure 6. Broad Polycomb domains and H3K27me3-dependant imprinting are primed during perinatal oogenesis.
(A) Heatmaps showing H3K27me3 dynamics in WT perinatal oocytes and PRC1ctrl&cKO oocytes on theH3K27me3 broad peaks (peaks length >10kb) identified in FGO. (B) Heatmaps showing H2AK119ub dynamics in WT perinatal oocytes and PRC2ctrl&cKO oocytes on the H2K119ub broad peaks (peaks length >10kb) identified in FGO. (C and D) Heatmaps showing H3K27me3 (C) and H2AK119ub (D) dynamics in WT oocytes, PRC1ctrl& cKO or PRC2ctrl&cKO oocytes on the 76 H3K27me3-imprinted gene regions. (E) Genome browser views showing H2AK119ub and H3K27me3 dynamics at the H3K27me3-imprinted gene Gab1 locus in WT oocytes and PRC1ctrl&cKO oocytes. (F) Scatter dot plots showing RNA expression levels of the 76 H3K27me3-imprinted genes in PRC1ctrl& cKO or PRC2ctrl&cKO oocytes as indicated. P values of pairwise comparisons (two-sided paired Student’s t-test) are given. n.s., not significant. Data are represented as mean ± SD.
Figure 7
Figure 7. Premature ovarian failure in Polycomb conditional knockout mouse models.
(A) Histology of ovarian sections from 2-month-old PRC1Gctrl and PRC1GcKO females, respectively, stained with hematoxylin & eosin. Red asterisks mark atretic follicles. Bars: 500 μm, 50 μm in boxed area. Three mice of each genotype were used for analysis, and representative images are shown. (B) Estimated numbers of primordial follicles per ovary from PRC1Gctrl and PRC1GcKO mice at 2 months. Three mice were analyzed for each genotype. Data are presented as mean values ± SD. Two-tailed unpaired Student’s t-test. (C, D) Ovarian sections of PRC2ctrl and PRC2cKO mice at P6 (C) and 12 months of age (D). The ovaries were directly imaged for Stella-GFP (green) or stained with hematoxylin & eosin on sections. Bars: 100 μm for P6 ovaries, 500 μm for 12 mo ovaries. At least three mice were analyzed for each genotype at each time point, and representative images are shown. (E) Estimated numbers of primordial follicles per ovary from PRC2ctrl and PRC2cKO mice at P6, 6 months, and 12 months of age. At least three mice were analyzed for each genotype at each time point. Data are presented as mean values ± SD. n.s., not significant; two-tailed unpaired Student’s t-test. (F) Schematic models of Polycomb-mediated programming and reprogramming in the ovarian reserve development.

Similar articles

References

    1. Ramakrishna N.B., Murison K., Miska E.A., and Leitch H.G. (2021). Epigenetic Regulation during Primordial Germ Cell Development and Differentiation. Sex Dev 15, 411–431. 10.1159/000520412. - DOI - PubMed
    1. Grive K.J. (2020). Pathways coordinating oocyte attrition and abundance during mammalian ovarian reserve establishment. Mol Reprod Dev 87, 843–856. 10.1002/mrd.23401. - DOI - PubMed
    1. Grive K.J., and Freiman R.N. (2015). The developmental origins of the mammalian ovarian reserve. Development 142, 2554–2563. 10.1242/dev.125211. - DOI - PMC - PubMed
    1. Borum K. (1961). Oogenesis in the mouse. A study of the meiotic prophase. Exp Cell Res 24, 495–507. 10.1016/0014-4827(61)90449-9. - DOI - PubMed
    1. Broekmans F.J., Knauff E.A., te Velde E.R., Macklon N.S., and Fauser B.C. (2007). Female reproductive ageing: current knowledge and future trends. Trends Endocrinol Metab 18, 58–65. 10.1016/j.tem.2007.01.004. - DOI - PubMed

Publication types