[Preprint]. 2025 Jul 3:2025.06.27.662066.
doi: 10.1101/2025.06.27.662066.

Response of human iPSC-cardiomyocytes to adrenergic drugs assessed by high-throughput pericellular oxygen measurements

Affiliations

Response of human iPSC-cardiomyocytes to adrenergic drugs assessed by high-throughput pericellular oxygen measurements

Weizhen Li et al. bioRxiv. .

Abstract

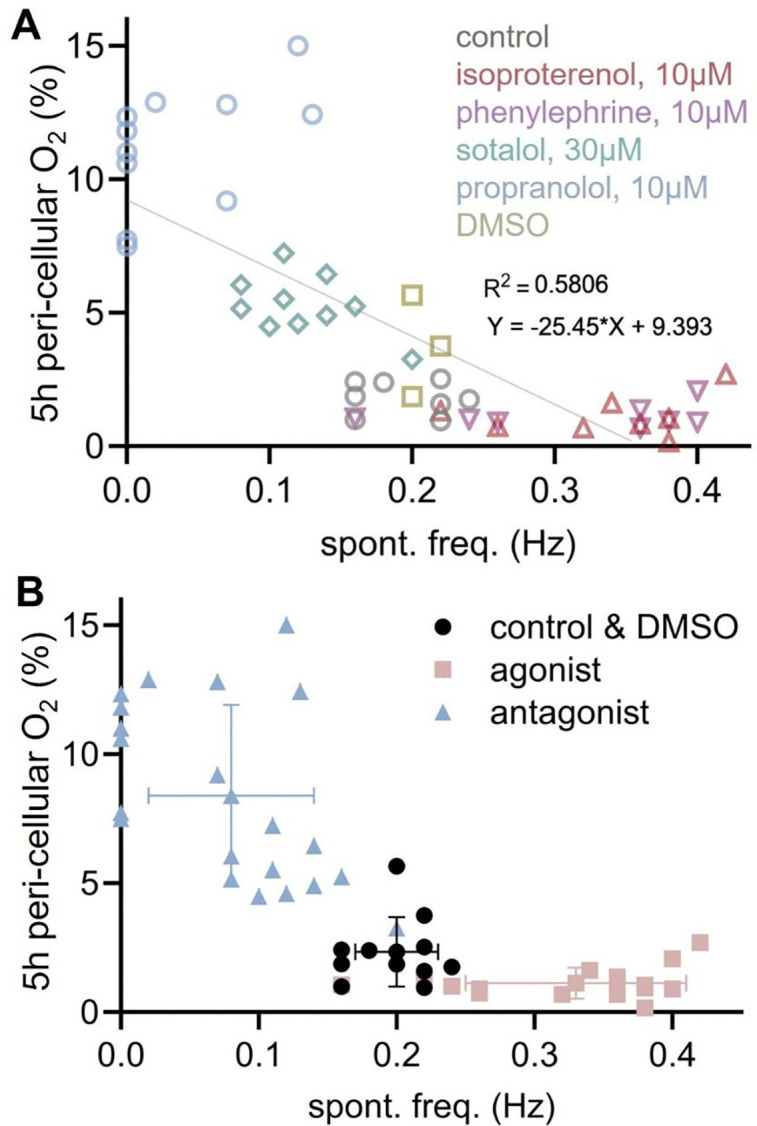
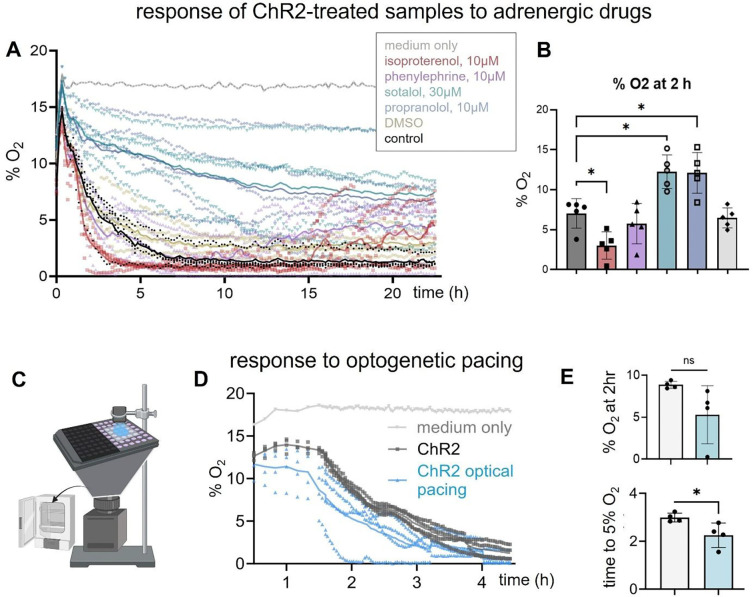
Rate-modulating drugs, such as adrenergic agonists and antagonists, are widely used in the treatment of cardiovascular conditions. Preclinical assessment of new rate and metabolism modulators can be augmented through the development of high-throughput (HT) methods that allow chronic measurements. Such approaches are best coupled with human induced pluripotent stem cell-derived cardiomyocytes (hiPSC-CMs) - a scalable experimental model of the human heart. Here, we evaluate the utility of long-term optical (label-free) measurements of pericellular oxygen in a HT format (96-well plates) for the assessment of the effectiveness of adrenergic drugs in hiPSC-CMs. Quantitative metrics were derived from these long-term measurements, e.g. steady-state pericellular oxygen and time to reach 5%, and we sought correlation to measurements performed in the same samples using all-optical electrophysiology. Adrenergic agonists significantly increased oxygen consumption rate, and this was best seen in the kinetics of initial depletion of pericellular oxygen, i.e. time to reach 5%. Adrenergic antagonists decreased oxygen consumption rate and their action was best quantified using steady-state values for pericellular oxygen after at least 5 hours. Drug type identification based on oxygen consumption rate correlated well with the acute measurements of spontaneous rate in the same samples. Furthermore, we showed that direct rate modulation with chronic optogenetic pacing detectably sped up the oxygen consumption rate and optogenetic transformation did not interfere with classification of adrenergic drugs. We conclude that HT label-free optical oxygen measurements may be a valuable approach for long-term non-invasive monitoring of the action of rate- and metabolism-modulating drugs in preclinical studies.

Keywords: adrenergic agonists; all-optical electrophysiology; beta blockers; high-throughput plates; human iPSC-CMs; optical oxygen sensors; pericellular oxygen.


Conflict of interest statement

Conflict of Interest: The authors declare no conflict of interest.

Figures

Figure 1.
Figure 1.. Study overview.
Human induced pluripotent stem cell-derived cardiomyocytes (hiPSC-CMs) cultured in 96-well plates can be used for high-throughput (HT) drug testing. This study examines if HT label-free HT optical sensing of peri-cellular oxygen can accurately capture responses of human iPSC-CMs to adrenergic agonists and antagonists and what metrics may be most useful. The study uses acute all-optical electrophysiology in the same samples to register level of activity and correlate to peri-cellular oxygen responses.
Figure 2.
Figure 2.. High-throughput optical sensing of pericellular oxygen in standard 96-well plates.
A. Top: bottom-up view of semi-circular oxygen sensor attached 96 well. Bottom: VisiSens 96-well plate oxygen measuring setup. B. Schematic of 96 well peri-cellular oxygen sensing. Cells are grown on the glass bottom on the left side for all-optical electrophysiology measuring, while on the right side, they are grown on the oxygen sensor for real-time oxygen measurements. Oxygen sensitive membrane in the oxygen sensor (pink) contains ruthenium-based oxygen-responsive dye that has fluorescent quenching with peri-cellular oxygen molecules. Under VisiSens 405nm light excitation, the 650nm red fluorescent emission indicates the oxygen level, while a 550nm reference fluorescent emission remains constant regardless of the oxygen level. C, D. Human iPSC-CMs cultured on the glass-bottom (C) and oxygen sensor(D). Alpha-actinin signal in red, and nuclei in blue, with 20μm scale bar.
Figure 3.
Figure 3.. Pericellular oxygen dynamics in response to adrenergic agonists and antagonists.
A. VisiSens 96-well plate oxygen measurement setup and color code for adrenergic agonists and antagonists. B. Pericellular oxygen readout in the first 6.5 hours of treatment with adrenergic agonists and antagonists; data presented as individual samples (wells) along with a trend line representing the average (n=5 per group, with an additional control well with culture medium only, no cells). Drug treatment was done six days after cell plating. C. Pericellular oxygen levels at 5 hours post-treatment (n=22–29 per group). One-way ANOVA with Dunnett’s multiple comparisons showed a significant difference between control and sotalol-treated groups (p = 0.001), and between control and all other treatment groups (p < 0.0001). D. Pericellular oxygen levels at 22 hours post-treatment (n=18–24 per group). One-way ANOVA with Dunnett’s test revealed significant differences between control and isoproterenol (p = 0.0173), phenylephrine (p = 0.0096), and propranolol (p < 0.0001) treated groups. E. Time to reach 5% and 2% pericellular oxygen (n=22–31 per group); some samples never reached below 5%.
Figure 4.
Figure 4.. Functional follow-up: voltage and calcium activities in hiPSC-CMs post-adrenergic modulation
A. Example traces from the whole-plate all-optical electrophysiology measurement, 24 h after treatment with adrenergic agonists and antagonists. Membrane voltage signal represented in red, while calcium transients are shown in green; these were measured sequentially. B. Normalized spontaneous beating frequency of human iPSC-CMs under adrenergic agonist and antagonist treatments (n = 8–16 per group). One-way ANOVA with Dunnett’s multiple comparisons showed significant differences between control and isoproterenol (p = 0.01), phenylephrine (p = 0.0159), and propranolol (p < 0.0001). C. Human iPSC-CMs spontaneous action potential duration (APD80) and calcium transient duration (CTD80) under adrenergic agonists and antagonists’ treatments (n=1–8 per group; some samples were completely quiescent). Statistical analysis of CTD80 using ordinary one-way ANOVA and multiple comparisons revealed adjusted p<0.0001 for control vs. sotalol and control vs. propranolol.
Figure 5.
Figure 5.. Correlation of peri-cellular oxygen measurements and cardiac cellular activity.
A. Correlation plot of peri-cellular oxygen readings at 5 h of adrenergic treatment and cell spontaneous frequency (n=3–11 per group, samples colored by treatment). B. Grouped correlation plot for adrenergic antagonists, control and adrenergic agonists (n=11–21 per group); bars represent the standard deviations in either parameter per group.
Figure 6.
Figure 6.. Active perturbation of rate through optogenetic pacing and changes in pericellular oxygen.
A. Pericellular oxygen of adrenergic treated samples after ChR2 infection (n=5 per group except medium-only group). B. Summary of steady-state pericellular oxygen values at 2 h after treatment for all groups. One-way ANOVA with Dunnett’s multiple comparisons showed significant differences between control and isoproterenol (p = 0.0198), sotalol (p = 0.0022), and propranolol (p = 0.0029). C. Diagram illustrating the setup for optical pacing within an incubator with peri-cellular oxygen measurement. D. Oxygen consumption comparison between optically paced and non-paced samples hiPSC-CMs (n=4 per group). E. Comparison of oxygen consumption metrics between optically paced and non-paced samples (top: peri-cellular oxygen level after about 2 h of optical pacing; bottom: time to reach 5% O2 level); Unpaired t test was applied for statistical analysis, p = 0.0338.

Similar articles

References

    1. Ahlquist R. P. (1948). “A STUDY OF THE ADRENOTROPIC RECEPTORS.” American Journal of Physiology-Legacy Content 153(3): 586–600. - PubMed
    1. Ahmed S. M., Shivnaraine R. V. and Wu J. C. (2023). “FDA Modernization Act 2.0 Paves the Way to Computational Biology and Clinical Trials in a Dish.” Circulation 148(4): 309–311. - PMC - PubMed
    1. Ambrosi C. M. and Entcheva E. (2014). “Optogenetic control of cardiomyocytes via viral delivery.” Methods Mol Biol 1181: 215–228. - PMC - PubMed
    1. Blazeski A., Zhu R., Hunter D. W., Weinberg S. H., Zambidis E. T. and Tung L. (2012). “Cardiomyocytes derived from human induced pluripotent stem cells as models for normal and diseased cardiac electrophysiology and contractility.” Prog Biophys Mol Biol 110(2–3): 166–177. - PMC - PubMed
    1. Blinova K., Schocken D., Patel D., Daluwatte C., Vicente J., Wu J. C. and Strauss D. G. (2019). “Clinical Trial in a Dish: Personalized Stem Cell-Derived Cardiomyocyte Assay Compared With Clinical Trial Results for Two QT-Prolonging Drugs.” Clin Transl Sci 12(6): 687–697. - PMC - PubMed

Publication types

LinkOut - more resources