[Preprint]. 2025 Jul 3:2025.06.29.662135.
doi: 10.1101/2025.06.29.662135.

High-fat diet ablates an insulin-responsive pool of GLUT4 glucose transporters in skeletal muscle

Affiliations

High-fat diet ablates an insulin-responsive pool of GLUT4 glucose transporters in skeletal muscle

Youjia Hu et al. bioRxiv. .

Abstract

To stimulate glucose uptake in muscle, insulin mobilizes GLUT4 glucose transporters to the cell surface. During fasting, GLUT4 and the transmembrane aminopeptidase IRAP are trapped in intracellular, insulin-responsive vesicles bound by TUG, AS160, and Usp25m proteins. Here we show that Usp25m, a protease, is required for the bulk of insulin-stimulated TUG cleavage and consequent vesicle mobilization and glucose uptake. Efficient TUG cleavage also requires AS160. In mice with diet-induced insulin resistance, Usp25m abundance is reduced, IRAP is mislocalized during fasting, and TUG cleavage is impaired; effects of Usp25m and TUG deletion to alter insulin-stimulated and fasting glucose uptake, respectively, are ablated. We conclude that skeletal muscle insulin resistance results in part from altered membrane trafficking of GLUT4 and IRAP during fasting. This alteration depletes the pool of insulin-responsive vesicles marked by TUG and Usp25m. Mistargeting of GLUT4 and IRAP may contribute to distinct aspects of the metabolic syndrome in humans.


Figures
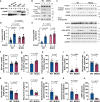
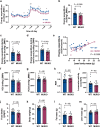
Fig. 1.
Fig. 1.. Mice with Usp25 deletion in muscle have impaired insulin-stimulated glucose uptake.
a. Immunoblotting was performed as indicated on tissues from MUKO and WT control mice. Sk. Muscle, hindlimb skeletal muscle; GWAT, gonadal white adipose tissue. b. MUKO and WT control mice were fasted 6 h, then treated with IP injection of insulin and glucose, or saline control, then euthanized after 30 min. Quadriceps muscles were isolated and immunoblotted as indicated. c. MUKO and WT control mice were treated as in (b). Quadriceps muscles were isolated and homogenized, and T-tubule enriched membrane fractions were isolated. Immunoblots were done as indicated. d.,e. Data from mice treated as in (c) were quantified. Abundances of GLUT4 (d) and IRAP (e) are shown. For GLUT4 (d), n = 13 for WT basal, 12 for WT insulin-stimulated, 12 for MUKO basal, and 13 for MUKO insulin-stimulated. For IRAP (e), n = 3 in each group. NS, not significant. f.,g. Plasma glucose was measured in 12-week-old MUKO and WT control mice with ad lib access to food (f) and after a glucose load (g). Mice in (g) were fasted for 6 h, then treated IP with 2 g/kg glucose, and measurements were made 1 h after IP injection. In (f), n = 20 WT and 27 MUKO mice. In (g), n = 6 WT and 10 MUKO mice. h.-o. Hyperinsulinemic-euglycemic clamps were performed in 12-week-old MUKO and WT control mice. Plots show fasting glucose and insulin concentrations prior to the clamp (h,i), glucose infusion rate (GINF) during steady state (6 time points at 90–140 min. of the clamp; j), whole body glucose uptake and glycolysis (k,l), and tissue-specific glucose uptake in gastrocnemius (m), quadriceps (n), and GWAT (o). n = 17 WT and 10 MUKO mice. All data are presented as mean ± s.e.m. of biologically independent samples, analyzed using a two-tailed t test or ANOVA with adjustment for multiple comparisons.
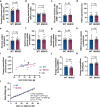
Fig. 2.
Fig. 2.. Mice with Usp25m deletion in muscle have reduced energy expenditure on regular chow
a. Energy expenditure was measured by indirect calorimetry in 13-week-old mice and is plotted over time. n = 21 WT and 17 MUKO mice. Mean ± s.e.m. is shown. Individual time points were analyzed using two-tailed t tests. *P<0.05, **P<0.01. b.-d. Energy expenditure in (a) was averaged over 24 h, during light hours (c), and during dark hours (d). n = 21 WT and 17 MUKO mice. LBM, lean body mass. e. Energy expenditure per mouse is plotted as a linear regression versus lean body mass. n = 21 WT and 17 MUKO mice. f.-m. The indicated parameters were measured in metabolic cages. n = 21 WT and 17 MUKO mice. All data are presented as mean ± s.e.m. of biologically independent samples, analyzed using a two-tailed t test (b-d,f-m) or ANCOVA (e).
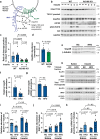
Fig. 3.
Fig. 3.. High-fat diet feeding ablates the effects of muscle Usp25m knockout on glucose uptake and energy expenditure
a.-h. Mice were treated with a high-fat diet (HFD) for 3 weeks, then studied in hyperinsulinemic-euglycemic clamps at age 15 weeks. Basal glucose and insulin concentrations were measured prior to the clamps (a,b), and the indicated parameters were measured during clamps and are plotted. n = 13 WT and 14 MUKO mice. Mean ± s.e.m. is shown, analyzed using two-tailed t tests. GINF, glucose infusion rate. EGO, endogenous glucose production. GWAT, gonadal white adipose tissue. NS, not significant. i.-k. Mice were fed a HFD for 3 weeks and studied in metabolic cages at age 12 weeks. Plots show energy expenditure per mouse as a linear regression versus lean body mass (i), energy expenditure per lean body mass (LBM, j), and energy expenditure per total body weight (k). n = 7 WT and 9 MUKO mice. Data in (i) were analyzed by ANCOVA. Data in (j,k) are shown as mean ± s.e.m., analyzed using a two-tailed t test. NS, not significant. l. Mice were fed a HFD beginning at 8 weeks of age, and body weights were measured and are plotted versus number of days on the HFD. A linear regression was used to assess the rate of weight gain, and was not significantly different in MUKO mice, compared to WT controls. n = 7 in each group, shown as mean ± s.e.m.
Fig. 4.
Fig. 4.. Proteins that regulate GLUT4 storage vesicles act together and this action is disrupted in HFD-fed mice
a. A diagram of interactions among proteins that regulate GLUT4 Storage Vesicles. Residues in the cytosolic N-terminus of IRAP are numbered, and AS160, TUG, and TNKS bind the indicated peptides. Interactions among proteins are indicated by arrows. The complex is anchored to Golgin-160 and other components at the endoplasmic reticulum-Golgi intermediate compartment (ERGIC). Modified from Ref. . b.-d. Epitrochlearis muscles were isolated from WT and AS160 knockout (KO) rats, treated with or without insulin, then lysates were prepared and immunoblotted (b). Intact TUG and its C-terminal cleavage product (TUG-C product) are indicated. The ratio of the cleavage product to intact TUG abundance was quantified (c). Usp25m abundance in unstimulated muscles was quantified (d). Data were normalized to that in WT controls. n = 6 WT unstimulated, 6 WT insulin-stimulated, 7 KO unstimulated, and 8 KO insulin-stimulated samples. e.-g. Mice were fed regular chow (RC) or high-fat diet (HFD) for 3 weeks until age 13 weeks, then hindlimb muscles were isolated and immunoblotted as indicated (e). Usp25m protein abundance was quantified, normalized to β-tubulin abundance, and plotted (f). n = 10 RC and 14 HFD samples. In parallel, Usp25m mRNA abundance was quantified and is plotted (g). 6 WT and 7 HFD samples. h.-k. Mice were fed RC or HFD for 6 weeks, beginning at 8 weeks of age. Mice (14 weeks old) were then fasted 6 h and treated with IP injection of insulin-glucose solution, or saline control. After 30 min., mice were euthanized, quadriceps muscles were homogenized, and T-tubule membrane fractions were isolated. Immunoblots were done as indicated (h). The relative abundances of GLUT4 and IRAP in T-tubule membranes as quantified and is plotted (i,j). For GLUT4 (i), n = 9 RC saline, 6 RC insulin, 6 HFD saline, and 6 HFD insulin samples. For IRAP (j), n = 11 RC saline, 7 HFD saline, 6 RC insulin, and 6 HFD insulin samples. The ratio of IRAP to GLUT4 abundances was quantified and is plotted (k). n = 8 RC saline, 4 HFD saline, 6 RC insulin, and 6 HFD insulin samples. All data are presented as mean ± s.e.m. of biologically independent samples, analyzed using a two-tailed t test (d,f,g) or ANOVA (c,I,j,k). NS, not significant.
Fig. 5.
Fig. 5.. Effects of muscle-specific TUG knockout to increase fasting glucose uptake are not observed in high-fat diet -fed mice.
a.-g. Muscle TUG knockout (MTKO) and WT control mice were previously studied and, on a RC-diet, MTKO mice had increased whole-body and muscle-specific glucose uptake. Here, MTKO and WT control mice were fed a HFD starting at 8 weeks of age, and glucose turnover studies were performed, as previously in fasting mice, after 3.5 weeks on the HFD. Basal glucose and insulin concentrations were measured prior to the study (a,b), and the indicated parameters were measured during the study (c-g) and are plotted. n = 13 WT and 7 MTKO mice. Data are presented as mean ±s.e.m., and analyzed using a two-tailed t test. GWAT, gonadal white adipose tissue. NS, not significant.
Fig. 6.
Fig. 6.. Model showing how insulin responsiveness is regulated by the size of a pool of insulin-responsive GLUT4 storage vesicles in muscle.
In insulin-sensitive muscle (left), GLUT4 storage vesicles (GSVs) accumulate during fasting. GSVs reside near the endoplasmic reticulum (ER)-Golgi intermediate compartment (ERGIC), contain GLUT4 and IRAP, and are bound by TUG and Usp25m proteins. AS160 is also bound (not shown). Insulin stimulates Usp25m-mediated TUG cleavage to mobilize the GSVs, which inserts GLUT4 and IRAP at the plasma membrane to mediate glucose uptake and vasopressin inactivation, respectively. The TUG C-terminal cleavage product enters the nucleus and regulates transcription to control thermogenesis. In insulin-resistant muscle (right), fewer GSVs are present during fasting, so that GLUT4 and IRAP are not well sequestered together. GLUT4 likely accumulates in ERGIC membranes, and IRAP travels to the plasma membrane. Usp25m protease abundance is reduced. Upon insulin stimulation, less TUG is cleaved, fewer GSVs are mobilized to translocate GLUT4, and less TUG C-terminal product enters the nucleus.

References

    1. Czech M. P. Insulin action and resistance in obesity and type 2 diabetes. Nat Med 23, 804–814 (2017). 10.1038/nm.4350 - DOI - PMC - PubMed
    1. Petersen M. C. & Shulman G. I. Mechanisms of Insulin Action and Insulin Resistance. Physiol Rev 98, 2133–2223 (2018). 10.1152/physrev.00063.2017 - DOI - PMC - PubMed
    1. James D. E., Stockli J. & Birnbaum M. J. The aetiology and molecular landscape of insulin resistance. Nat Rev Mol Cell Biol 22, 751–771 (2021). 10.1038/s41580-021-00390-6 - DOI - PubMed
    1. Vassilopoulos S. et al. A role for the CHC22 clathrin heavy-chain isoform in human glucose metabolism. Science 324, 1192–1196 (2009). 10.1126/science.1171529 - DOI - PMC - PubMed
    1. Bogan J. S. Regulation of glucose transporter translocation in health and diabetes. Annu Rev Biochem 81, 507–532 (2012). 10.1146/annurev-biochem-060109-094246 - DOI - PubMed

Publication types

LinkOut - more resources