. 2025 Sep 2;152(9):616-629.
doi: 10.1161/CIRCULATIONAHA.124.072733. Epub 2025 Jul 9.

Cellular Reprogramming by PHF7 Enhances Cardiac Function Following Myocardial Infarction

Affiliations

Cellular Reprogramming by PHF7 Enhances Cardiac Function Following Myocardial Infarction

Glynnis Garry Bann et al. Circulation. .

Abstract

Background: Direct reprogramming of fibroblasts to cardiomyocytes is a potentially curative strategy for ischemic heart disease. However, current reprogramming strategies require excessive factors due to epigenetic barriers of adult mouse and human fibroblasts. Recently, we identified the epigenetic factor PHF7 from a screen of gene-regulatory factors as the most potent activator of adult fibroblast-to-cardiomyocyte reprogramming in vitro.

Methods: Through in vitro assays coupled with genome-wide studies, we interrogated the ability of PHF7 to induce reprogramming events with minimal reprogramming factors. Using in vivo murine models of myocardial infarction and intramyocardial reprogramming factor delivery coupled with genetic fibroblast lineage tracing, we delivered retroviral PHF7 cocktails to the murine heart and interrogated reprogramming events as well as the acute and chronic functional impact of these cocktails. Deployment of 10X multiomics in vivo generated a combinatorial single-nucleus transcriptomic and epigenomic atlas of PHF7 reprogramming in the infarcted heart.

Results: Genome-wide in vitro transcriptomic analyses revealed that addition of PHF7 to Tbx5 or Mef2c and Tbx5 in fibroblasts induced global reprogramming through upregulation of unique cardiac transcriptomes. Further, PHF7 itself upregulated cardiac master regulators when overexpressed in dermal fibroblasts. Delivery of PHF7 cocktails to the infarcted murine heart induced in vivo reprogramming events and improved cardiac function and remodeling in both acute and chronic heart failure. When delivered as a single factor to the infarcted heart, PHF7 improved survival, function, and fibrosis up to 16 weeks after injury. Genetic lineage tracing analyses revealed that PHF7 induced bona fide fibroblast-to-cardiomyocyte reprogramming events in vivo. Comprehensive multiomics of PHF7 cocktails in the infarcted heart exposed the impact of PHF7 on chromatin structure, generating population-level shifts in nonmyocyte and cardiomyocyte cellular identity.

Conclusions: Here, we report the ability of a single epigenetic factor, PHF7, to induce reprogramming and improve cardiac function in the mouse heart following myocardial infarction. Together, these data support the premise that a single factor, when deployed into the infarcted mouse heart, can induce reprogramming events and recover function in the ischemic heart.

Keywords: cellular reprogramming; direct cell reprogramming techniques; epigenomics; heart failure; myocardial infarction.


Conflict of interest statement

Dr Olson is a cofounder and member of the scientific advisory board of Tenaya Therapeutics and holds equity in the company. Dr Olson is a consultant for Vertex Pharmaceuticals and Cardurion Pharmaceuticals. Drs Bann and Olson are inventors on US patent application 18/706 525 based on international patent application PCT/US2022/078854 entitled “Reprogramming of Adult Cardiac Fibroblasts Into Cardiomyocytes Using PHF7” in the name of the board of regents of the University of Texas System.

Figures
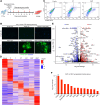
Figure 1.
Figure 1.
PHF7 reprograms adult tail-tip fibroblasts in vitro with minimal cofactors. A, Schematic of the in vitro reprogramming assay. B, Representative images of immunocytochemistry of day 7 empty virus (Empty)-, PHF7 (P)-, Tbx5 (T)-, PHF7+Tbx5 (PT)-, Mef2c+Tbx5 (MT)-, and PHF7+Mef2c+Tbx5 (PMT)–treated adult tail-tip fibroblat (TTF) induce cardiomyocyte-like cells (iCLMs) derived from the alpha-myosin heavy chain (α-MHC)-GFP transgenic mouse. α-MHC-GFP, green; Hoechst, blue. Biologically independent experiments were performed with similar results at least 3 times. (scale bar=50 µm). C, Representative flow cytometry plots of day 7 TTF iCLMs treated with empty, PT, or PMT virus. α-MHC-GFP (x axis; FITC) and cardiac troponin T (cTnT) (y axis, 647). D, Heatmap clustered by maximum unique gene expression of empty, P, T, PT, PMT, or GMT (Gata4+Mef2c+Tbx5) treatment groups, as identified by RNA-seq (coefficient of variation >0.2). E, Volcano map comparing differentially expressed transcripts between PMT-treated (upregulated, red) and GMT-treated (downregulated; blue) iCLMs (log2FC>1, padj<0.05). F, Differential fold change expression of selected cardiac markers and TFs upregulated under the PMT condition as compared to GMT (log2FC >1, padj<0.05). Inf indicates infinity.
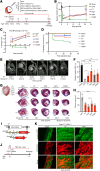
Figure 2.
Figure 2.
PHF7 cocktails improve cardiac function after myocardial infarction. A, Schematic describing permanent left anterior descending artery (LAD) ligation, retroviral delivery, and functional assessment. B, Ejection fraction (EF; percent) of mice subjected to myocardial infarction (MI) followed by intramyocardial injection of GFP, PHF7+Tbx5 (PT), PHF7+Mef2c+Tbx5 (PMT), Gata4+Mef2c+Tbx5 (GMT), PHF7+Gata4+Mef2c+Tbx5 (PGMT), as well as sham (no MI) control with injection was evaluated 24 hours, 7 days, and 21 days post-MI by echocardiography (sham n=8, GFP n=7, PT n=9, PMT n=9, GMT n=9, PGMT n=10 mice survived for inclusion in functional assessments). Statistical testing used 2-way ANOVA with modification for multiple comparisons: 24 hours post-MI, GFP vs PT ns (not significant) P=0.9997, GFP vs PMT ns P=0.9993, GFP vs GMT ns P>0.9999, GFP vs PGMT ns P>0.9999; on day 7, GFP vs PT *P=0.0108, GFP vs PMT *P=0.0415, GFP vs GMT *P=0.0360, GFP vs PGMT *P=0.0282; and on day 21, GFP vs PT ***P=0.0003, GFP vs PMT ***P=0.0005, GFP vs GMT ***P=0.0009, GFP vs PGMT ***P=0.0001. Data are presented as mean±SD. C, Quantification of percentage point change in EF 7 days and 21 days post-MI compared with 24 hours post-MI (GFP n=7, PT n=9, PMT n=9, GMT n=9, PGMT n=10 mice survived for inclusion in functional assessments). Statistical testing used 2-way ANOVA with modification for multiple comparisons: on day 7, GFP vs PT **P=0.0018, GFP vs PMT **P=0.0047, GFP vs GMT ns P=0.1021, GFP vs PGMT ns P=0.1073 and on day 21, ****P<0.0001 for all groups compared with GFP. Data are presented as mean±SEM. D, Kaplan-Meier plot demonstrating the probability of post-operative 30-day survival among mice treated with control and PHF7 cocktails (event [death] rate: sham n=0/8, GFP n=9/17, PT n=3/16, PMT n=1/13, GMT n=1/9, PGMT n=0/10 mice per group). Log-rank (Mantel-Cox) test was performed; ***P=0.0008. E, Cardiac magnetic resonance imaging (MRI) was performed on surgical groups 14 to 16 weeks after MI. Shown are representative short-axis images of sham, GFP, PT, PMT, GMT, and PGMT. The left ventricle is indicated by arrows. F, EF (percent) was calculated by cardiac MRI at 16 weeks (sham n=4, GFP n=3, PT n=4, PMT n=5, GMT n=4, PGMT n=5). ****P<0.0001, GFP vs PT *P=0.0442, GFP vs PMT *P=0.0166, GFP vs GMT ns P=0.643, GFP vs PGMT **P=0.0052; data are presented as mean±SD. G, Comparison of cardiac histology across treatment groups in GFP-, PT-, PMT-, GMT-, and PGMT-treated hearts by Masson's trichrome staining 16 weeks after MI. Cardiac fibrosis was evaluated at 500-μm intervals across 5 levels (L3–L5 shown here), with L1 beginning at the last normoxic section before suture placement. The mouse ID number is indicated at the bottom right of each series. Scale bar=1000 μm. H, Quantification of fibrotic area in heart sections stained with picosirius red, where fibrotic area is the sum of fibrotic area at L2 through L5 (GFP n=6, PT n=8, PMT n=9, GMT n=8, PGMT n=10; all surviving animals from echocardiographic analyses were included in 16-week fibrosis studies). ****P<0.0001, PMT v GMT *P=0.0107; data are presented as mean±SD. I, Schematic describing generation of PostnMCM/+;R26tdTO/+ mice for lineage tracing. J, Schematic of the lineage tracing strategy for tamoxifen (TMX) exposure, permanent LAD ligation, and retroviral cocktail delivery. K, Immunohistochemistry of sections of PostnMCM/+;R26tdTO/+ mice injected with empty virus, PT, or PMT retroviral cocktail post-MI and exposed to TMX chow for 4 weeks. α-actinin, green; tdTomato, red; DAPI, blue. Scale bar=200 μm. Normality testing was performed using Shapiro-Wilk testing before selecting statistical tests as appropriate. Empty indicates empty virus; L1-5, levels 1-5; LV, left ventricle; RV, right ventricle; and tdTO, tdTomato.
Figure 3.
Figure 3.
A single factor, PHF7, improves cardiac function through reprogramming after injury. A, Schematic describing permanent left anterior descending artery (LAD) ligation, retroviral delivery of GFP or PHF7 virus, and functional and histological assessments. B, Ejection fraction (EF; percent) of mice subjected to myocardial infarction (MI) followed by intramyocardial injection of GFP or PHF7 as well as sham (no MI) control with injection was evaluated at 24 hours, 7 days, and 21 days post-MI by echocardiography (sham n=8, GFP n=7, PHF7 n=8 mice survived for inclusion in functional assessments). Statistical analysis was performed by 2-way ANOVA with adjustment for repeated measures, with 24-hour GFP vs PHF7 ns P=0.4328, 7-day GFP vs PHF7 **P=0.0022, 21-day GFP vs PHF7 *P=0.0109; data are presented as mean±SD. C, Kaplan-Meier plot demonstrating the probability of postoperative 30-day survival among mice treated with GFP or PHF7 (event [death] rate: sham n=0/8, GFP n=9/17, PHF7 n=2/19). Log-rank (Mantel-Cox) test was performed to determine statistical significance; **P=0.0023. D, Cardiac MRI was performed on surgical groups at 14 to 16 weeks post-MI, and EF (percent) was calculated (sham n=4, GFP n=3, PHF7 n=6 mice); ****P<0.0001, GFP vs PHF7 **P=0.0030; data are presented as mean±SD. E Quantification of fibrotic area in heart sections stained with picosirius red, where fibrotic area is the sum of fibrotic area at L2 through L5 (GFP n=6, PHF7 n=7; all surviving animals from echocardiographic analyses were included in 16-week fibrosis studies). Statistical analysis was performed by 2-tailed t test, GFP vs PHF7 P***=0.0002. F, Comparison of cardiac fibrosis between GFP- and PHF7-treated hearts by Masson's trichrome staining 16 weeks after MI. Cardiac fibrosis was evaluated at 500-μm intervals across 5 levels (L1–L5), with L1 beginning at the last normoxic section before suture placement. L3 to L5 are pictured. Scale bar=1000 μm. G, Immunohistochemistry of sections of PostnMCM/+;R26tdTO/+ mice injected with PHF7 retroviral cocktail after MI and exposed to tamoxifen (TMX) chow for 4 weeks. The scar region and border zone are shown. α-Actinin, green; tdTomato, red; DAPI, blue. Scale bar=50 μm. H, Live-cell imaging of cardiomyocytes isolated by Langendorff perfusion from PostnMCM/+;R26tdTO/+ hearts treated with PHF7 after MI. Bright field, native tdTomato, red. Statistical testing used 1-way ANOVA with modification for multiple comparisons unless otherwise indicated. I, Schematic describing generation of Tcf21iCre/+;R26mTmG/+ mice for lineage tracing and strategy for TMX delivery and permanent LAD ligation. J, Immunohistochemistry of heart sections from Tcf21iCre/+;R26mTmG/+ mice treated with control or PHF7 retrovirus post-MI after exposure to TMX chow for 1 week. The scar region is shown, with arrowheads indicating pre-existing cardiomyocytes (membrane GFP [mG]−/membrane tdTomato [mT]+/α-actinin+) in the control (top) and arrowheads indicating reprogrammed induced cardiomyocyte-like cells (mG+/mT−/α-actinin+) in PHF7-treated hearts (bottom). mG, green; mT, red; α-actinin, blue. Scale bar=20 μm. K, Quantification of the percentage of Tcf21-lineage cells that had undergone fusion (mG+/mT+/α-actinin+) or reprogramming (mG+/mT−/α-actinin+) in the infarct and border zone areas (control n=2 hearts, PHF7 n=5 hearts). Statistical analysis was performed by 2-tailed t test; fusion (control vs PHF7) ns P=0.6408, reprogramming (control vs PHF7) ***P=0.0010; data are presented as mean±SD. L, Percentage of Tcf21-lineage cells with well-defined sarcomere structure (control n=2 hearts, PHF7 n=5 hearts). Statistical analysis was performed by 2-tailed t test; control vs PHF7 **P=0.0016; data are presented as mean±SD. Normality testing was performed using Shapiro-Wilk testing before selecting statistical tests as appropriate. BF indicates bright field; and tdTO, tdTomato.
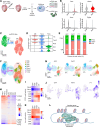
Figure 4.
Figure 4.
Multi-omic single-nucleus RNA sequencing (snRNA-seq) and ATAC sequencing (snATAC-seq) of PHF7 in vivo reprogramming. A, Schematic of the experimental design for multiomic snRNA and snATAC-seq of PostnMCM/+;R26tdTO/+ hearts injected with GFP, PHF7, PHF7+ Tbx5 (PT), or PHF7+Mef2c+Tbx5 (PMT) retroviral cocktail following myocardial infarction (MI) and exposure to tamoxifen (TMX) chow for 4 weeks. B, Violin plots demonstrating expression of Tbx5, Gata4, Nox4, and Pdgfra transcripts across GFP, PHF7, and PT treatment groups. C, snATAC-seq uniform manifold approximation and projection (UMAP) of reclustered fibroblasts (Fibro) and cardiomyocytes (CM) derived from GFP, PHF7, PT, and PMT-treated hearts, revealed a transition cluster (Trans). D, Violin plots demonstrating expression of cardiac and fibroblast transcripts across CM, Trans, and Fibro populations. E, Percentage of nuclei in reclustering analysis according to GFP, PHF7, PT, or PMT treatment group. F, snATAC-seq UMAP visualization of cardiomyocytes and fibroblasts clustered into Fibro (Fibro1 and Fibro2), Trans, and CM (CM0, CM1, CM2, and CM3) subclusters. G, The same UMAP visualization as in F, demonstrating the treatment group origin of each nucleus for control, PHF7, and PT treatment groups. Percentages of nuclei per treatment group in the Fibro2 and CM3 groups are indicated. H, Heatmap of ChromVAR motif analysis across Fibro, Trans, and CM subclusters. I, Heatmaps of CTCF motif activity as determined by ChromVAR across CM, Trans, and Fibro subclusters under every treatment condition. J, UMAP visualization of CTCF motif activity across GFP, PHF7, and PT treatment groups. K, Heatmaps of Jun motif activity as determined by ChromVAR across CM, Trans, and Fibro subclusters in every treatment condition. L, Schematic. LAD indicates left anterior descending.

References

    1. Sadek H, Olson EN. Toward the goal of human heart regeneration. Cell Stem Cell. 2020;26:7–16. doi: 10.1016/j.stem.2019.12.004 - PMC - PubMed
    1. Bozkurt B, Ahmad T, Alexander KM, Baker WL, Bosak K, Breathett K, Fonarow GC, Heidenreich P, Ho JE, Hsich E, et al. ; Writing Committee Members. Heart failure epidemiology and outcomes statistics: a report of the Heart Failure Society of America. J Card Fail. 2023;29:1412–1451. doi: 10.1016/j.cardfail.2023.07.006 - PMC - PubMed
    1. Ieda M, Fu JD, Delgado-Olguin P, Vedantham V, Hayashi Y, Bruneau BG, Srivastava D. Direct reprogramming of fibroblasts into functional cardiomyocytes by defined factors. Cell. 2010;142:375–386. doi: 10.1016/j.cell.2010.07.002 - PMC - PubMed
    1. Song K, Nam YJ, Luo X, Qi X, Tan W, Huang GN, Acharya A, Smith CL, Tallquist MD, Neilson EG, et al. Heart repair by reprogramming non-myocytes with cardiac transcription factors. Nature. 2012;485:599–604. doi: 10.1038/nature11139 - PMC - PubMed
    1. Zhou H, Dickson ME, Kim MS, Bassel-Duby R, Olson EN. Akt1/protein kinase B enhances transcriptional reprogramming of fibroblasts to functional cardiomyocytes. Proc Natl Acad Sci U S A. 2015;112:11864–11869. doi: 10.1073/pnas.1516237112 - PMC - PubMed

MeSH terms

Substances