. 2025 Jul 9;25(1):149.
doi: 10.1007/s10142-025-01658-2.

Integrated Nanopore and short-read RNA sequencing identifies dysregulation of METTL3- m6A modifications in endocrine therapy- sensitive and resistant breast cancer cells

Affiliations

Integrated Nanopore and short-read RNA sequencing identifies dysregulation of METTL3- m6A modifications in endocrine therapy- sensitive and resistant breast cancer cells

Belinda J Petri et al. Funct Integr Genomics. .

Abstract

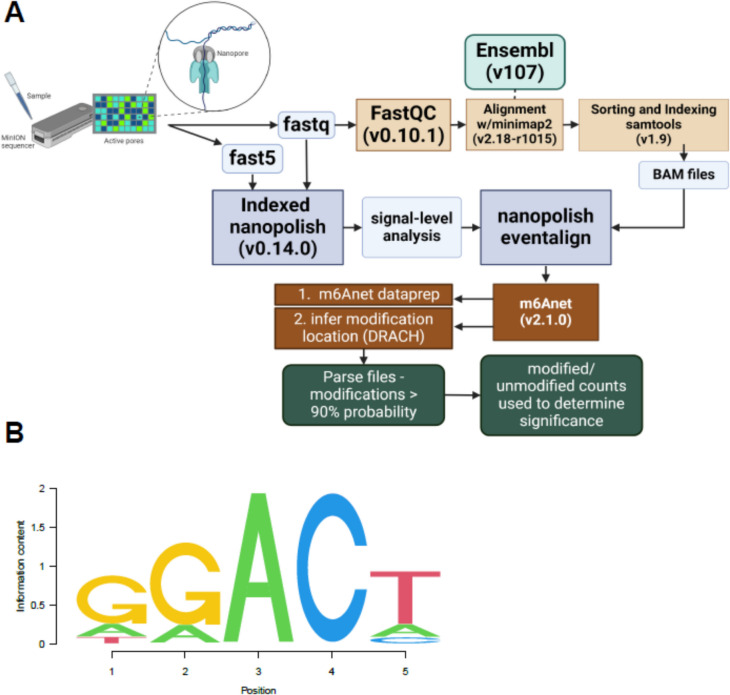
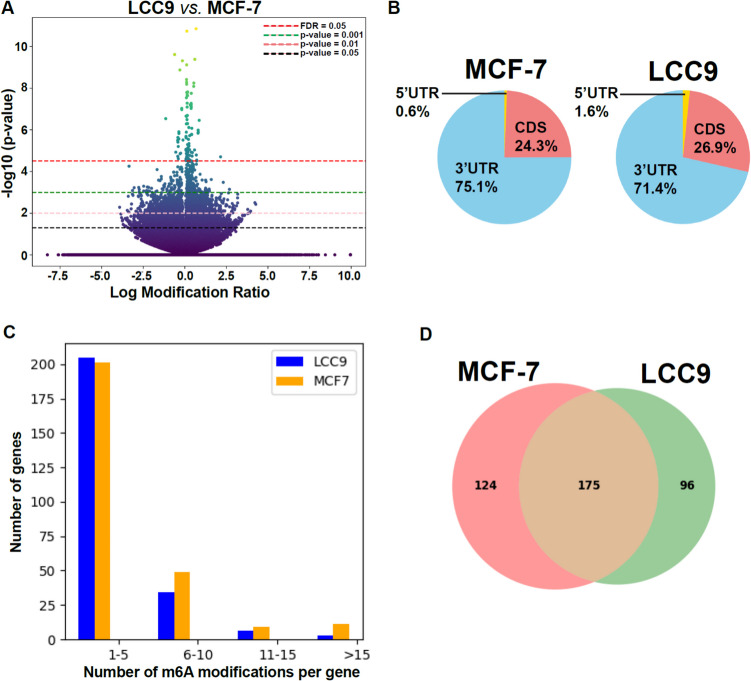
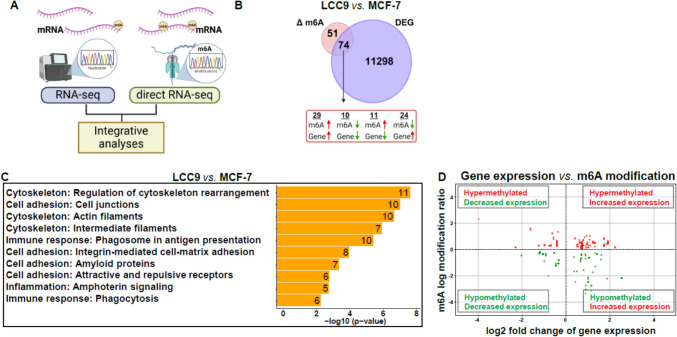
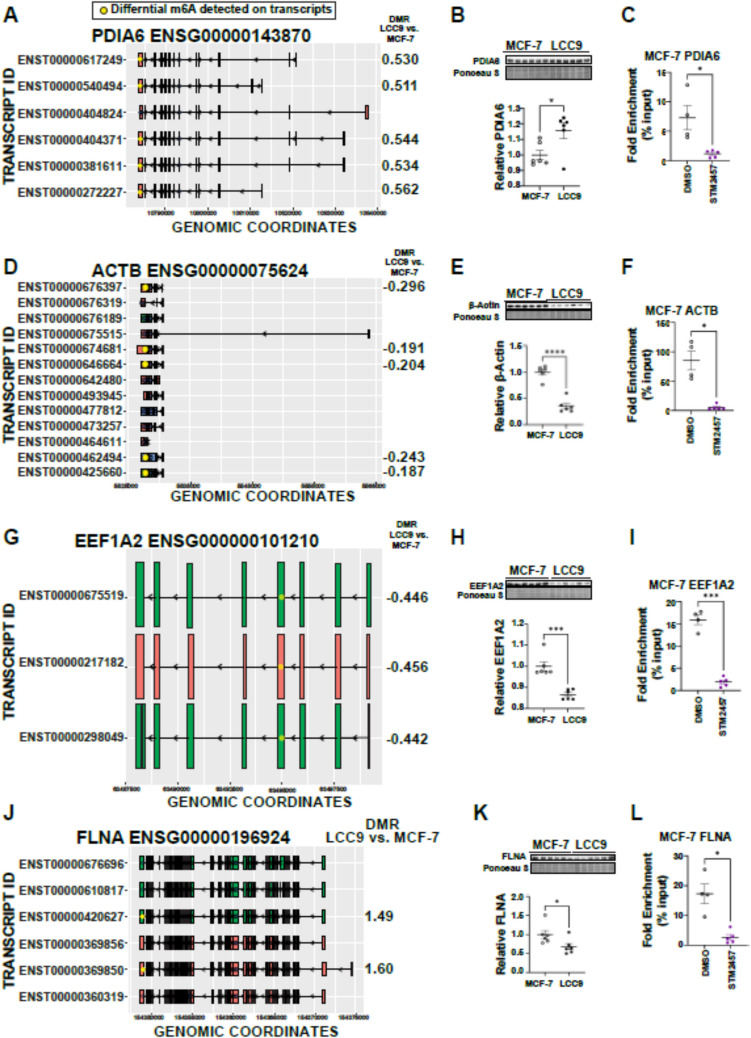
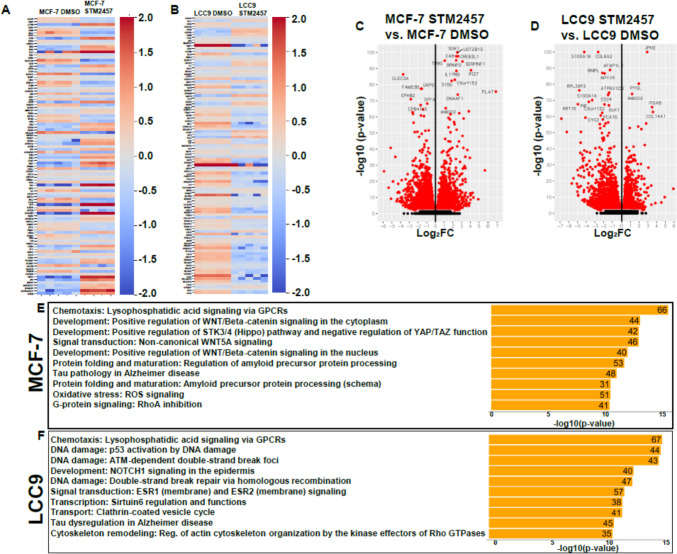
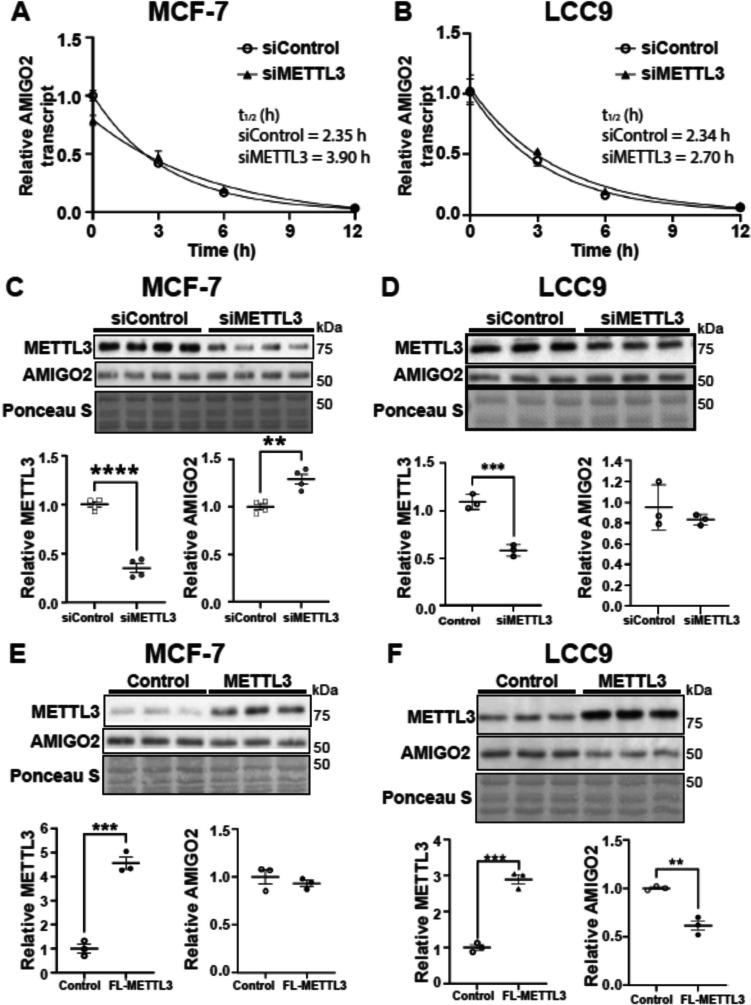
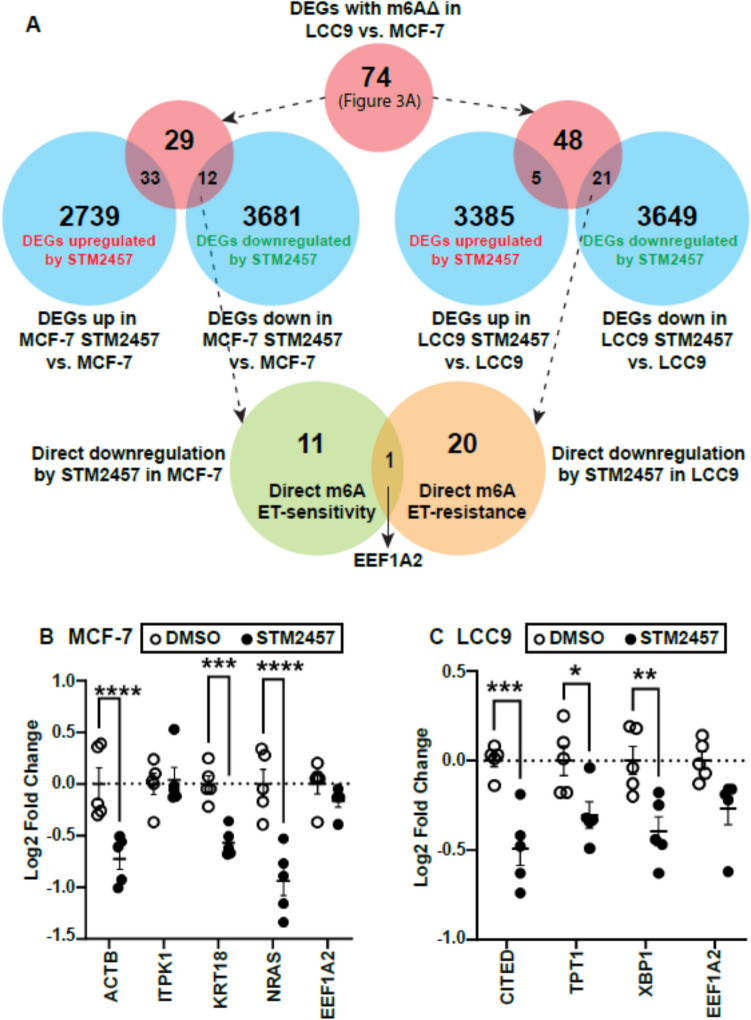
The role of epitranscriptomic changes in the development of acquired endocrine therapy (ET)- resistance in estrogen receptor α (ER) expressing breast cancer (BC) is unknown. We tested the hypothesis that inhibition of METTL3, the methyltransferase responsible for the mRNA modification N-6 methyladenosine (m6A), alters m6A modifications and differentially regulates the abundance of mRNA transcripts in ET-sensitive MCF-7 versus resistant LCC9 ER + human BC cells. Differential m6A modifications were identified using direct mRNA sequencing (DRS) performed on five replicates for each cell line ± 1 µM STM2457, a selective METTL3 inhibitor, using Nanopore MinION long read RNA-seq. Parallel short read Illumina RNA-seq quantified differential transcript abundance in the same samples. Selected results were validated by RT-qPCR, m6A-RIP-qPCR, reporter assays, and western blot analysis. Statistical analysis combined m6Anet, a machine-learning algorithm designed to call m6A modified bases, with a generalized linear model following a binomial distribution analysis to identify significant differential m6A modification ratios (DMR). Distinct METTL3 dependent m6A modification patterns in LCC9 and MCF-7 cells were observed in differentially expressed genes (DEG) associated with ET-resistance, including EEF1A2, ACTB, FLNA, PDIA6, AMIGO2, TPT1, XBP1, and CITED4. Select results were validated in additional ET-resistant BC cell lines. m6A-RIP-RT-qPCR validated specific m6A sites. We examined the proximity of m6A sites to estrogen receptor α (ER α)-mRNA binding sites reported in MCF-7 cells. ACTB, PDIA6, and XBP1 demonstrated a short-range proximity, with m6A sites located within 100 bp of ERα binding sites, suggesting a role for m6A in influencing ERα-mRNA binding. Our work provides a framework for integrating DRS and DEG omics data. Our results suggest a role for dysregulation of m6A modifications in pathways implicated in ET resistance in BC.

Keywords: Breast cancer; Endocrine-resistance; Epitranscriptome; M6A; Nanopore DRS.


Conflict of interest statement

Declarations. Conflict of interest: The authors declare no competing interests. Competing interests: The authors declare no competing interests.

Figures

Fig. 1
Fig. 1
m6A detection and quantification workflow using DRS. A Data from the Nanopore MinION DRS divided into multiple fast5 and fastq files, which were concatenated for each sample. Sequence quality was assessed and fastq files were aligned to the human transcriptome (Ensembl v107). The resulting SAM files were sorted and indexed. Nanopolish indexed the fast5 and fastq files for signal-level analysis and aligned to sequence data. m6A modifications were analyzed using m6Anet, which prepared the data and inferred modified base locations where the m6A event is predicted using a probability cutoff of 0.90. Matrices were constructed to represent modification locations and counts. Significant modifications were identified using the ratio of modified/unmodified counts. Statistical analysis was performed to determine significant differences between sample groups using a generalized linear model and Benjamini–Hochberg correction. B Representative image of motif analysis from m6Anet identifying DRACH sequences
Fig. 2
Fig. 2
m6A detection in LCC9 vs MCF-7 cells. A Volcano plot showing differences m6A modification sites between LCC9 and MCF-7 DMSO (control)-treated cells. The dotted lines show different significance thresholds. B The distribution of m6A modifications across protein-coding transcript locations: 5’ untranslated region (UTR), coding sequence (CDS), and 3’ UTR. C Comparing the distribution of m6A modifications per gene in LCC9 and MCF-7 cells. The data are categorized into four bins: 1–5, 6–10, 11–15, and > 15 m6A modifications per gene. D Venn diagram showing the distribution of m6A-modified genes identified through DRS in MCF-7 and LCC9 cells. The intersection represents genes with detected m6A modifications in both cell lines, while the non-overlapping regions indicate genes uniquely modified in either MCF-7 or LCC9. Numbers within each section denote the gene counts after removing pseudogenes and unannotated genes
Fig. 3
Fig. 3
Integration of DEGs with m6A modifications in ET-resistant LCC9 vs. ET-sensitive MCF-7 BC cells. A Schematic representing integration analysis of RNA-seq (Illumina) and direct RNA-seq (ONT). B Venn Diagram showing the overlap of DEGs with mRNA transcripts with altered numbers of m6A modifications and the direction of differential gene expression and differential m6A modification in LCC9 compared to MCF-7 DMSO control-treated cells. Four gene clusters were identified with the indicated change in m6A RNA methylation and the corresponding gene transcript expression differences between LCC9 and MCF-7 cells. Red arrows indicate an increase, and green arrows indicate a decrease in LCC9 vs. MCF-7 cells. C MetaCore analysis by Process Networks of DEGs with differential m6A modifications in LCC9 compared to MCF-7 DMSO control-treated cells. The total number of gene changes in each pathway is indicated. D Scatter plot showing the relationship between differential m6A modifications and gene expression changes in the 74 DEG with altered m6A methylation (panel B). Each point represents a gene (including all m6A modified transcripts for that gene), with the x-axis displaying the log modification ratio of m6A changes (p-value < 0.001) and the y-axis showing the log2 fold change of differential gene expression (DEG- as in panel A) (q-value < 0.05). Red indicates an increase in m6A and green indicates a decrease in m6A
Fig. 4
Fig. 4
Western blot analysis of DEGs with DMR DEGs in LCC9 compared to MCF-7 cells. The R package ggtranscript (https://dzhang32.github.io/ggtranscript/) was used to plot the m6A modifications identified with m6ANet analysis in the indicated transcripts of PDIA6, ACTB, EEF1A2, and FLNA in LCC9 vs. MCF-7 cells A, D, G, J. For the western blots B, E, H, K, six biological replicate samples of WCE from MCF-7 and LCC9 were probed with the indicated antibody and each protein’s abundance was quantified relative to Ponceau S staining of that same blot and then normalized to that protein’s abundance in MCF-7 cells. (C, F, I, L) Results MeRIP RT-qPCR for specific m6A-modified sites in C PDIA6, F ACTB, I EEF1A2, and L FLNA genes in MCF-7 cells treated with 1 μM STM2457 for 24 h. A PDIA6 transcript abundance was higher (log2FC 0.63, q-value < 0.05) and there was more m6A enrichment on the 5 transcripts in LCC9 compared to MCF-7 cells. B PDIA6 protein. D ACTB transcript abundance was downregulated (log2FC −1.18, q-value < 0.05) and there was less m6A enrichment on 5 transcripts in LCC9 compared to MCF-7 cells. E ACTB protein. G EEF1A2 transcript abundance was downregulated (log2FC −2.02, q-value < 0.05) and there was less m6A enrichment on 3 transcripts in LCC9 compared to MCF-7 cells. H EEF1A2 protein. J FLNA transcript abundance was downregulated (log2FC −1.61, q-value < 0.05) and there was more m6A enrichment on 2 transcripts in LCC9 compared to MCF-7 cells. K FLNA protein. DMR = differential modification rate, p-value < 0.001. Individual data are plotted from replicate experiments and error bars represent SEM (n = 5). Western and MeRIP-RT-qPCR data were analyzed using a two-tailed t test in Graph Pad Prism: * p < 0.05, *** p < 0.001, **** p < 0.0001
Fig. 5
Fig. 5
Identification of transcripts regulated by METTL3 inhibitor STM2457 in MCF-7 and LCC9 cells. MCF-7 and LCC9 cells were ‘serum starved’ for 72 h prior to 24 h treatment with DMSO (vehicle control) or 1 µM STM2457. A-B Heatmaps of the top 100 DEGs in STM2457-treated MCF-7 and LCC9 cells. C-D Volcano plots showing DEGs (log2FC > 0, q-value < 0.05) in MCF-7 C and LCC9 D cells treated with STM2457 vs. DMSO control. E MetaCore analysis by Pathway Maps of DEGs in STM2457-treated MCF-7 cells vs. control. F Pathway Maps of DEGs in LCC9 treated with STM2457 compared to LCC9 control. The query input was significant DEGs (log2FC > 0, q-value < 0.05) for MetaCore analysis. The number in each bar is the total number of STM2457-regulated DEGs in that pathway
Fig. 6
Fig. 6
METTL3 regulation of AMIGO2. A-B Measurement of mRNA stability (RT-qPCR) after Actinomycin D (ACTD) treatment. A MCF-7 and B LCC9 cells were transfected with siControl or siMETTL3 (72 h) and treated with 5 µg/ml ACTD to inhibit transcription. AMIGO2 mRNA levels were quantified by RT-qPCR at the indicated time post-ACTD treatment. Single phase exponential decay provided the t1/2 value ± standard deviation (std). Student's two-tailed t-test analysis of the half-lives revealed p < 0.005 for MCF-7 cells and no significant difference for LCC9 cells. Two-way ANOVA revealed significant time x treatment interactions (P < 0.001) for both MCF-7 and LCC9 cells. C MCF-7 and D LCC9 cells were transfected with siControl or siMETTL3, as above, and three or four biological replicate WCE samples were western blotted. The same blot was probed for METTL3, stripped and reprobed for AMIGO2, and Ponceau S stained for protein normalization. E MCF-7 and F LCC9 cells were transfected with FLAG-METTL3 (72 h) and three biological replicate samples of Control or FLAG-METTL3 WCE from each cell line were probed first for METTL3, then for AMIGO2, and Ponceau S stained. Each protein’s abundance was quantified relative to Ponceau S staining of that same blot and normalized to that protein’s abundance in the control. Statistical analysis was by Student's two-tailed t-test. ** p < 0.01; *** p < 0.001, **** p < 0.001
Fig. 7
Fig. 7
Overlap analysis of STM2457-regulated genes. A Venn diagrams illustrating the overlap analysis of DEGs with m6A modifications in LCC9 and MCF-7 cells (pink circles) intersected with DEGs upregulated (up) or downregulated (down) (blue circles) with STM2457 (METTL3 inhibitor) treatment in MCF-7 cells and LCC9 cells. The overlapping regions indicate the number of genes that are differentially expressed, possess m6A modifications, and are responsive to STM2457. These suggest direct target downregulation by STM2457 in ET-sensitive and ET-resistant BC cells. No overlap exists between these two groups. B-C MCF-7 and LCC9 cells were serum starved for 72 h and treated with 1 µM STM2457 for 24 h. RT-qPCR for the indicated genes was performed with 5 biological replicates/treatment. Data were analyzed by one-way ANOVA followed by Tukey’s test. * P < 0.05, **P < 0.01

Similar articles

References

    1. Achour C, Bhattarai DP, Groza P, Román ÁC, Aguilo F (2023) METTL3 regulates breast cancer-associated alternative splicing switches. Oncogene 42(12):911–925 - PMC - PubMed
    1. Anreiter I, Mir Q, Simpson JT, Janga SC, Soller M (2021) New Twists in Detecting mRNA Modification Dynamics. Trends Biotechnol 39(1):72–89 - PMC - PubMed
    1. Ariazi EA, Cunliffe HE, Lewis-Wambi JS, Slifker MJ, Willis AL, Ramos P, Tapia C, Kim HR, Yerrum S, Sharma CG et al (2011) Estrogen induces apoptosis in estrogen deprivation-resistant breast cancer through stress responses as identified by global gene expression across time. Proc Natl Acad Sci U S A 108(47):18879–18886 - PMC - PubMed
    1. Bartha Á, Győrffy B (2021) TNMplot.com: A Web Tool for the Comparison of Gene Expression in Normal, Tumor and Metastatic Tissues. Int J Mol Sci. 22(5) - PMC - PubMed
    1. Begik O, Lucas MC, Pryszcz LP, Ramirez JM, Medina R, Milenkovic I, Cruciani S, Liu H, Vieira HGS, Sas-Chen A et al (2021) Quantitative profiling of pseudouridylation dynamics in native RNAs with nanopore sequencing. Nat Biotechnol 39(10):1278–1291 - PubMed

MeSH terms

LinkOut - more resources