. 2025 Jul 9;115(4):85.
doi: 10.1007/s11103-025-01615-4.

Empirical evidence that glucan-interacting amino acid side chains within the transmembrane channel collectively facilitate cellulose synthase function

Affiliations

Empirical evidence that glucan-interacting amino acid side chains within the transmembrane channel collectively facilitate cellulose synthase function

Albert L Kwansa et al. Plant Mol Biol. .

Abstract

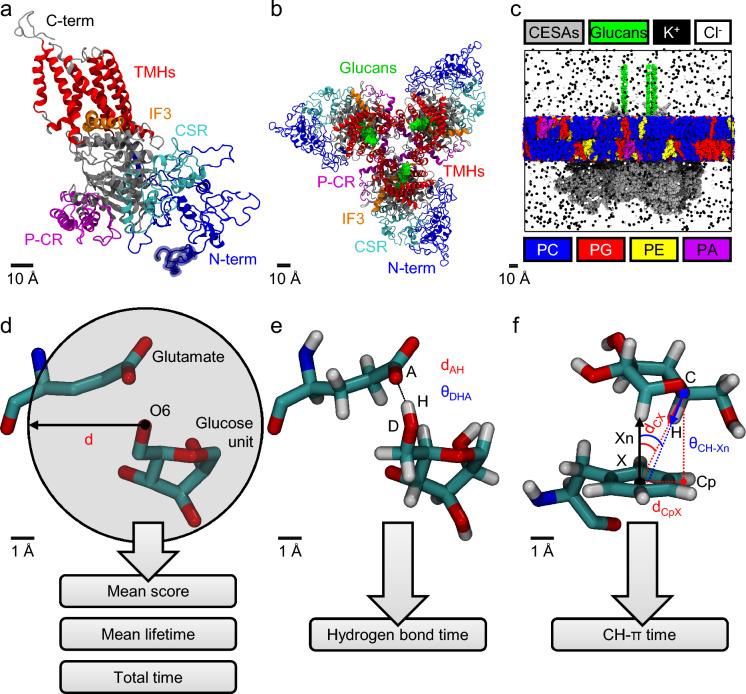
The fundamental mechanism of cellulose synthesis is widely conserved across Kingdoms and depends on cellulose synthases, which are processive, dual-function, family 2 glycosyltransferases (GT-2). These enzymes polymerize glucose on the cytoplasmic side of the plasma membrane and export the glucan chain to the cell surface through an integral transmembrane (TM) channel. Structural studies of active plant cellulose synthases (CESAs) have revealed interactions between the nascent glucan chain and the side chains of polar, charged, and aromatic amino acid residues that line the TM channel. However, the functional consequences of modifying these side chains have not been tested in vivo in CESAs or other processive GT-2s. To test this, we used an established in vivo assay based on genetic complementation of CESA5 in the moss, Physcomitrium patens. For accurate prediction of glucan-interacting amino acid residues, we generated a complete homotrimeric molecular model of PpCESA5 using a combination of homology and de novo modeling. All-atom molecular dynamics-based analyses of contact metrics and interaction energy identified 23 amino acid residues with high propensity to interact with the nascent glucan chain within the TM channel or on the apoplastic surface of PpCESA5. Mutating any one of 18 of these amino acid residues to alanine, thereby removing their side chains, abolished or impaired CESA function, with the strongest effects observed upon the loss of charged amino acid side chains. This provides direct evidence to support the hypothesis that multiple amino acid residues collectively maintain a smooth energy landscape within the TM channel to facilitate glucan translocation.

Keywords: Physcomitrium patens; Cellulose microfibril; Glycosyltransferase; Moss; Protein–carbohydrate interactions; β-d-glucose.


Conflict of interest statement

Declarations. Competing interests: The authors have no relevant financial or non-financial interests to disclose.

Figures

Fig. 1
Fig. 1
Three-dimensional PpCESA5 protein modeling, system construction, and post-simulation contact analyses. a A snapshot of the initial PpCESA5 monomeric model after merging the SWISS-MODEL homology model (30–1081 aa) and the RaptorX-Contact prediction (1–29 aa). Regions of interest are highlighted as indicated. The first 29 residues are indicated with a semi-transparent region at the start of the N-terminal domain. b A snapshot of the initial PpCESA5 homotrimeric model after 3D alignment using the cryo-EM PttCESA8 6WLB structure as a reference with 22-mer glucan chains extended from the original cellopentaoses of 6WLB. c A snapshot of the initial PpCESA5 homotrimeric model after the addition of a heterogeneous phospholipid bilayer, water, and KCl. The explicit water molecules are hidden for clarity. The system components are highlighted as indicated in the color key. The lower key elements (PC, PG, PE, and PA) represent the lipid polar head groups (phosphatidylcholine, phosphatidylglycerol, phosphatidylethanolamine, and phosphatidic acid, respectively) used to color the entirety of the lipid molecules (head and tail). d A schematic of the analysis of protein-glucan contacts based on a distance criterion “d”, which was used to obtain contact metrics including mean score, mean lifetime, and total time. The snapshot shows the heavy atoms only of a β-d-glucose unit of a glucan chain in close proximity to a glutamate residue with a spherical cutoff distance centered at oxygen atom “O6” of the glucose unit. e A schematic of the hydrogen bond analysis based on two criteria (a distance and an angle) involving an acceptor heavy atom “A”, a donor heavy atom “D”, and a donor hydrogen atom “H”. These criteria were used to obtain the hydrogen bond time. The snapshot shows all atoms for the same two structures shown in (d). f A schematic of the CH-π analysis based on three criteria (two distances and one angle) involving a glucan carbon “C”, a glucan hydrogen “H”, a centroid of an aromatic ring “X”, a vector normal to the aromatic ring “Xn”, and a projection of the glucan carbon onto the aromatic ring plane “Cp”. These criteria were used to obtain the CH-π time. The snapshot shows a β-d-glucose unit of a glucan chain in close proximity to a phenylalanine residue
Fig. 2
Fig. 2
Total contact time for all identified contacts. For each amino acid residue, up to three data points (diamonds) represent contacts involving one of the three glucan chains of the PpCESA5 homotrimer. The red boxes indicate the 23 out of 82 residues for which at least two data points met the criterion for a strong contact (≥ 80%). The blue boxes indicate the 59 out of 82 residues for which these criteria were not met
Fig. 3
Fig. 3
Structure and function of glucan contacts with polar and charged amino acid residues. a Contacts between glucose rings and amino acid side chains lining the TM channel of PpCESA5. Boxes are color-coded as red = no rescue or yellow = partial rescue. b PpCESA5 TM channel surrounded by TM helices (gray ribbons) and containing a glucan chain (gray stick, numbered starting with the acceptor glucose) with close-contact amino acid residues [stick, color-coded as in (a)]. c Complementation of cesa5/6/7KO by PpCESA5 expression vectors mutated as indicated. Numbers in parentheses indicate the TMH location of the mutations, and “T” indicates the apoplastic tail. Brackets indicate significant differences (p < 0.05, Fisher’s Exact Test) between the test vector and the positive or negative control and numbers at the bottom of each column indicate the number of independent genetic lines scored. d Properties of amino acid-glucan contacts. Column A color-coded as in (a). Glucose unit IDs are for each of the three CESAs (chains A–C) in the trimer
Fig. 4
Fig. 4
Structure and function of glucan contacts with aromatic amino acid residues. a Contacts between glucose rings and amino acid side chains lining the TM channel of PpCESA5. Boxes are color-coded as red = no rescue, yellow = partial rescue, or green = full rescue. b PpCESA5 TM channel surrounded by TM helices (gray ribbons) and containing a glucan chain (gray stick, numbered starting with the acceptor glucose) with close-contact amino acid residues [stick, color-coded as in (a)]. c Complementation of cesa5/6/7KO by PpCESA5 expression vectors mutated as indicated. Numbers in parentheses indicate the TMH location of the mutations. Brackets indicate significant differences (p < 0.05, Fisher’s Exact Test) between the test vector and the positive or negative control and numbers at the bottom of each column indicate the number of independent genetic lines scored. d Properties of amino acid-glucan contacts. Column A color-coded as in (a). Glucose unit IDs are for each of the three CESAs (chains A–C) in the trimer
Fig. 5
Fig. 5
Structure and function of glucan contacts with non-polar aliphatic amino acid residues. a Contacts between glucose rings and amino acid side chains lining the TM channel of PpCESA5. Boxes are color-coded as red = no rescue or green = full rescue. b PpCESA5 TM channel surrounded by TM helices (gray ribbons) and containing a glucan chain (gray stick, numbered starting with the acceptor glucose) with close-contact amino acid residues [stick, color-coded as in (a)]. c Complementation of cesa5/6/7KO by PpCESA5 expression vectors mutated as indicated. Numbers in parentheses indicate the TMH location of the mutations. Brackets indicate significant differences (p < 0.05, Fisher’s Exact Test) between the test vector and the positive or negative control and numbers at the bottom of each column indicate the number of independent genetic lines scored. d Properties of amino acid-glucan contacts. Column A color-coded as in (a). Glucose unit IDs are for each of the three CESAs (chains A–C) in the trimer
Fig. 6
Fig. 6
Function of glucan contacts in the P. patens cesa5KO background. a Complementation of cesa5KO by PpCESA5 expression vectors mutated as indicated. Numbers in parentheses indicate the TMH location of the mutations, and “T” indicates the apoplastic tail. Brackets indicate significant differences (p < 0.05, Fisher’s Exact Test) between the test vector and the positive or negative controls and numbers at the bottom of each column indicate the number of independent genetic lines scored. b Gametophore morphology (top panels) and leaf structure imaged by polarization microscopy (bottom panels) for cesa5KO complemented with wild-type control or mutated PpCESA5 expression vectors. Scale bar for upper panels = 1 mm and scale bar for lower panels = 200 µm. c Leaf cell area distributions for control and mutants overlapped, although the mean for S894A was significantly different from the control (p = 0.017). d Leaf cell circularity was higher for mutants compared to the control (p < 0.001). e GIWAXS intensity versus out-of-plane scattering vector qz obtained from vertical sector averages (− 17° to 17°) showed qualitative changes to diffraction near the cellulose (200) reflection for S317A and S894A when compared to the control. f Full width at half maximum of χ-pole figures [(1 1¯ 0)/(110) reflections] showed broadening of χ-pole figures (p = 0.0495) for mutants compared to controls. The pole figure width was similar between S317A and S894A complementation lines (p = 0.62) as contrasted with their differences from controls (p = 0.067 or 0.068). Replication and analysis for C–F were as follows. Biological replicates (n = 3) were lines selected independently from a transformation of cesa5KO with a wild-type control or mutated PpCESA5 expression vector. For (c) and (d), an average of 25.6 cells were measured to obtain mean cell circularity and cell area values for each leaf and values from 7–8 leaves were averaged for each biological replicate. For (d), spectra collected from six samples, two each from three biological replicates (a sample was 10 leaves from an independent culture), were averaged for each genotype. For (f), values calculated from two samples [as in (d)] were averaged for each biological replicate. Welch’s ANOVA followed by the Games Howell test was used to test significant differences between groups: for (c), F(2, 43.7) = 4.21; for (d), F(2, 42.0) = 75.17; and, for (f), F(2, 3.9) = 7.19. Statistically significant differences indicated by different letters on the graphs

Similar articles

References

    1. Anderson CT, Kieber JJ (2020) Dynamic construction, perception, and remodeling of plant cell walls. Annu Rev Plant Biol 71:39–69. 10.1146/annurev-arplant-081519-035846 - PubMed
    1. Arioli T, Peng L, Betzner AS, Burn J, Wittke W, Herth W, Camilleri C, Höfte H, Plazinski J, Birch R, Cork A, Glover J, Redmond J, Williamson RE (1998) Molecular analysis of cellulose biosynthesis in Arabidopsis. Science 279:717–720 - PubMed
    1. Baker AA, Helbert W, Sugiyama J, Miles MJ (1997) High-resolution atomic force microscopy of native Valonia cellulose I microcrystals. J Struct Biol 119:129–138. 10.1006/jsbi.1997.3866 - PubMed
    1. Baker JL, Jimison LH, Mannsfeld S, Volkman S, Yin S, Subramanian V, Salleo A, Alivisatos AP, Toney MF (2010) Quantification of thin film crystallographic orientation using X-ray diffraction with an area detector. Langmuir 26:9146–9151. 10.1021/la904840q - PubMed
    1. Bi Y, Hubbard C, Purushotham P, Zimmer J (2015) Insights into the structure and function of membrane-integrated processive glycosyltransferases. Curr Opin Struct Biol 34:78–86. 10.1016/j.sbi.2015.07.008 - PMC - PubMed

LinkOut - more resources