. 2025 Jul 15;122(28):e2500276122.
doi: 10.1073/pnas.2500276122. Epub 2025 Jul 9.

Mycophenolic acid treatment drives the emergence of novel SARS-CoV-2 variants

Affiliations

Mycophenolic acid treatment drives the emergence of novel SARS-CoV-2 variants

Toni Luise Meister et al. Proc Natl Acad Sci U S A. .

Abstract

Mycophenolic acid (MPA) is commonly used in immunosuppressive regimens following solid organ transplantation. We demonstrate that MPA treatment reproducibly inhibits the replication of a range of viruses, including severe respiratory syndrome coronavirus 2 (SARS-CoV-2). Mechanistically, we identified cellular guanosine triphosphate pool depletion as a key mediator of this antiviral effect. Strikingly, this inhibition can be overcome which was correlated with the emergence of three breakthrough mutations in the SARS-CoV-2 genome (S P812R, ORF3 Q185H, and E S6L). Subsequent analyses confirmed that the combination of these mutations conferred accelerated replication kinetics, higher viral titers, and more rapid onset of cytopathic effects, but not MPA resistance. Comparison of global transcriptional responses to infection highlighted dysregulation of specific cellular gene programs under MPA treatment prior to breakthrough mutation emergence. Together, these findings identify viral and host drivers of variant emergence under immunosuppression. They also advocate for close monitoring of immunosuppressed patients, where emergence of novel viral variants with a fitness advantage may arise.

Keywords: SARS-CoV-2; guanosine triphosphate (GTP) depletion; immunosuppression; mycophenolic acid; novel variants.


Conflict of interest statement

Competing interests statement:The authors declare no competing interest.

Figures

Fig. 1.
Fig. 1.
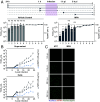
Antiviral activity of immunosuppressive drugs in hAECs over time. hAECs were treated with MPA (2.5 µg/mL), Rapamycin (6 ng/mL), Cyclosporin A (150 ng/mL), Tacrolimus (6 ng/mL), and/or Prednisolone (20 ng/mL) in indicated combinations (AF). After 1 h the cells were infected with SARS-CoV-2 (25,000 PFU) for 2 h and subsequently washed thrice with HBSS. Directly after infection as well as 24, 48, 72, and 96 h post infection, infectious progeny virus was collected from the apical site and subjected to an end-point dilution assay to determine TCID50/mL (left half of each graph). Viral titers were normalized to viral titers derived from the untreated cells (dotted line). Simultaneously, cell culture medium from the basal site was obtained to evaluate cell viability by an LDH assay (right half of each graph). All experiments were performed in three different donors (mean ± SD). MPA—mycophenolic acid. ns—not significant.
Fig. 2.
Fig. 2.
Effect of MPA on the virus life cycle. (A) Time of addition experiments were performed using full-length SARS-CoV-2 (25,000 PFU). A549-A/T cells were seeded at 8 × 10⁴ cells/mL and treated either with the vehicle control (EtOH) or MPA (2.5 µg/mL) for time periods indicated by the black arrows. Twenty-four hours post infection the supernatant was collected, and infectious progeny production was assessed by an end-point dilution assay to determine TCID50/mL. The long dashed line indicates viral loads calculated for the UTC. Cell viability was monitored by an MTT assay (Right). Statistical significance was estimated by one-way ANOVA with Dunnett’s multiple comparison (*P ≤ 0.05; **P ≤ 0.01; ***P ≤ 0.001, ****P ≤ 0.0001). All experiments were performed in triplicates (mean ± SD). Dots indicate technical replicates. (B) A549-A/T cells were seeded at 8 × 10⁴ cells/mL and incubated until attached. One-third of the cells were treated with 25 µg/mL MPA 10 h before infection (preMPA). All cells were infected with SARS-CoV-2 (25,000 PFU) for 1 h and subsequently washed thrice with 1× PBS. The cells were then left untreated or treated with indicated concentrations of MPA. At the indicated time points the supernatant was collected and the cells were subjected to two freeze-and-thaw cycles. Extracellular and intracellular viral titers were determined by an end-point dilution assay. (C) Representative fluorescence images of infected A549-A/T cells stained for the nucleocapsid. All experiments were performed in triplicates (mean ± SD). ns—not significant. TCID50—50% tissue culture infectious dose. p.i. = post infection.
Fig. 3.
Fig. 3.
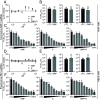
The antiviral effect of MPA is reversible by ectopic substitution of guanosine (G) and/or GMP. Experiments were performed on Huh7 cells for 229E (AC) and HEp-2 cells for RSV (DE). Cells were seeded at 8 × 10⁴ cells/mL and incubated until fully attached. (A and D) Afterward the cells were treated with GMP and/or G (100 µM to 0.78 µM) and cell viability was assessed 24 h post treatment. Additionally, cells were infected with HCoV-229E and RSV (MOI 0.1) for 1 h. To remove the inoculum the cells were washed thrice with 1× PBS. Afterward the cells were treated with (B and E) solely GMP and/or G (100 µM) or with (C and F) GMP and/or G (100 µM to 0.78 µM) in combination with 2.5 µg/mL MPA. The supernatant was harvested 24 h post infection. Infectious viral titers were determined by an end-point dilution assay (TCID50/mL). Statistical significance was estimated by one-way ANOVA with Dunnett’s multiple comparison (*P ≤ 0.05; **P ≤ 0.01; ***P ≤ 0.001, ****P ≤ 0.0001). All experiments were performed in triplicates (mean ± SD). ns—not significant. TCID50—50% tissue culture infectious dose. UTC—untreated control. GMP—guanosine monophosphate. G—guanosine. MPA—mycophenolic acid.
Fig. 4.
Fig. 4.
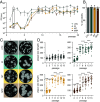
SARS-CoV-2 passaging under the presence of MPA in physiological concentrations. A549-A/T cells were seeded in 75 cm2 flasks and treated with solely MPA (2.5 µg/mL; M), MPA, and Tacrolimus (6 ng/mL; MT), MPA, Tacrolimus and Prednisolone (20 ng/mL; MTP) or left untreated (UTC). One hour later the cells were inoculated with 200,000 PFU for 1 h. Hereafter, the inoculum was removed and replaced with fresh MPA, Tacrolimus and/or Prednisolone-containing DMEM. The cells were then incubated for 24 h and considered as the first passage of virus (p1). For the following passages, pretreated A549-A/T cells were inoculated with supernatant from the previous passage for 1 h. Hereafter the inoculum was replaced by fresh 5% FCS-containing DMEM with the applicable treatment. (A) For every passage infectious progeny production was determined as PFU/mL. (B) Cell viability was assessed 24 h post treatment. (C) Phenotypic changes of plaques were documented and (D) quantified using ImageJ. Statistical significance was estimated by one-way ANOVA with Dunnett’s multiple comparison (*P ≤ 0.05; **P ≤ 0.01; ***P ≤ 0.001, ****P ≤ 0.0001). PFU—plaque forming units.
Fig. 5.
Fig. 5.
Sensitivity of passaged SARS-CoV-2 toward clinically relevant drugs. A549-A/T cells were seeded at 8 × 10⁴ cells/mL and incubated until fully attached. The cells were infected with SARS-CoV-2 (25,000 PFU) for 1 h. The inoculum was removed and the cells were washed thrice with 1× PBS. Hereafter, the cells were treated with the indicated concentrations of Molnupiravir (Mol), Paxlovid® (Pax) and Remdesivir (Rem). Twenty-four hours post infection (A) cell viability was assessed by MTT assay and (B and C) the supernatant was collected for subsequent determination of infectious viral titers performing an end-point dilution assay. (D) A neutralization assay was performed to calculate the neutralization efficacy of the WHO standard against the passaged viruses. The 50% neutralization dose (ND50) was calculated by a linear regression model.
Fig. 6.
Fig. 6.
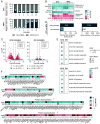
Transcriptional profiling of MPA treated cells. SARS-CoV-2 was serially passaged in naïve A549-A/T cells either in combination with MPA, or in UTC cells. Subsequently, total RNA was isolated from infected cells from selected passage (p1, p3, p5, p9, p15, and p20) and subjected to next generation sequencing. (A) Reads were mapped to both the human (Hg38) and SARS-CoV-2 genome. Based on the virus mapped read numbers for MPA treated cells, passages were divided into early cell passages (p1, p3, and p5) and later cell passages (p9, p15, and p20) for subsequent analyses of host cell gene dysregulation. (B) The abundance of SARS-CoV-2 entry factor mRNAs, as well as lung, hepatocyte, and brain markers were determined. (C) The cellular response to virus infection is displayed as volcano plots. gray—n.s. and low L2FC, dark green—n.s. and L2FC > 1, light blue—P ≤ 0.05 and low L2FC, light red—P ≤ 0.05 and L2FC > 1. (D) Differentially expressed genes (RPKM > 1, FDR P < 0.05) and enriched gene ontology categories (FDR P < 0.05) were determined. (E) Selected GO categories colored according to the mean L2FC. Circle size indicates gene ratio. No outline—n.s.; blue outline—P ≤ 0.05. (F) Genes of interest belonging to enriched gene ontology categories. UTC—untreated control. Early passages—p1, p3, and p5. Late passages—p9, p15, and p20. DEG—differentially expressed gene. GO—gene ontology. L2FC- log2 fold change.
Fig. 7.
Fig. 7.
Analysis of SARS-CoV-2 variant emergence. SARS-CoV-2 was passaged during exposure to different drug combinations. Subsequently, viral RNA was isolated from the supernatant and A549-A/T cells of selected passage and subjected to RNA-seq. (A) SARS-CoV-2 genome coverage for intracellular virus is plotted in correlation to the genome position. (B) SNV frequencies were determined for extracellular virus and (C) variants that exceeded a frequency of 50% in at least one passage are depicted in the heatmaps. The virus used for the initial inoculation was set as a reference. ORF—open reading frame. SNV—single nucleotide variant. E—envelope. S—spike.
Fig. 8.
Fig. 8.
Characterization of MPA-selected variants. (A) A549-A/T cells were seeded at 8 × 10⁴ cells/mL and infected with SARS-CoV-2 variants (WT, S P812R, ORF3 Q185H, E S6L, and the combined triple variant; 25,000 PFU) for 1 h. After 24 h the supernatant was collected and infectious viral titers were determined by plaque assay. (B) Similarly, A549-A/T cells were infected with the different variants and the number of nucleocapsid expressing cell was quantified by immunofluorescence staining at 8 and 24 h p.i. (C) Virus induced cell death (cytopathic effects) was monitored. Representative images were taken using bright field microscopy. (D) Additionally, representative images of the plaque assay performed for (A) are displayed in a gray scale image. (E) Plaque size was quantified using ImageJ. (F) Sensitivity toward MPA was evaluated by dose dependency assay. WT—wild-type. NP—nucleocapsid protein. PFU—plaque forming units. UTC—untreated control. MPA—mycophenolic acid. IC50—50% inhibitory concentration.

References

    1. Kirk M. D., et al. , World Health Organization estimates of the global and regional disease burden of 22 foodborne bacterial, protozoal, and viral diseases, 2010: A data synthesis. PLoS Med. 12, e1001921 (2015), 10.1371/journal.pmed.1001921. - DOI - PMC - PubMed
    1. Toor J., et al. , Lives saved with vaccination for 10 pathogens across 112 countries in a pre-COVID-19 world. Elife 10, e67635 (2021), 10.7554/eLife.67635. - DOI - PMC - PubMed
    1. de Clercq E., Li G., Approved antiviral drugs over the past 50 years. Clin. Microbiol. Rev. 29, 695–747 (2016), 10.1128/CMR.00102-15. - DOI - PMC - PubMed
    1. Clark A., et al. , Global, regional, and national estimates of the population at increased risk of severe COVID-19 due to underlying health conditions in 2020: A modelling study. Lancet Glob. Health 8, e1003–e1017 (2020), 10.1016/S2214-109X(20)30264-3. - DOI - PMC - PubMed
    1. Burrell C. J., Howard C. R., Murphy F. A., “Epidemiology of viral infections” in Fenner and White’s Medical Virology, Burrell C. J., Howard C. R., Murphy F. A., Eds. (Elsevier/AP Academic Press is an imprint of Elsevier, Amsterdam, Boston, ed. 5, 2017), pp. 185–203.

Supplementary concepts