. 2025 Jul 9;20(7):e0326522.
doi: 10.1371/journal.pone.0326522. eCollection 2025.

Signals of complexity and fragmentation in accelerometer data

Affiliations

Signals of complexity and fragmentation in accelerometer data

Els Weinans et al. PLoS One. .

Abstract

There is a growing interest to analyze physiological data from a complex systems perspective. Accelerometer data is one type of data that is easy to obtain but often difficult to analyze for insights beyond basic levels of description. Previous work hypothesizes that an individual's activity pattern can be seen as a complex dynamical system. Here, we explore this hypothesis further by investigating whether complexity-based measures quantifying repetitiveness and fragmentation of activity captured via accelerometer can detect health differences beyond traditional measures. Our results demonstrate that healthy individuals have a higher regularity (indicated by a lower correlation dimension), a higher probability of activity after a period of rest, and a lower probability of a period of rest after a period of activity compared with patients living with Myotonic Dystrophy type I (DM1), a chronic, progressive, complex, multisystem disease. For the correlation dimension, this difference was independent of the average, coefficient of variation and autocorrelation of the activity signals. This suggests that the correlation dimension can extract clinically relevant information from accelerometer data. Therefore, our results corroborate the idea that a complexity perspective may help to reveal the emergent characteristics of health and disease.


Conflict of interest statement

The authors have declared that no competing interests exist.

Figures
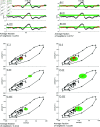
Fig 1
Fig 1. Calculating the correlation integral from a time series.
A and B illustrate the time series with a diamond for every data point for d = 1 (dimension 1). For a fixed r, we denote for every point how many points are within a distance r. The green area depicts the distance of r from the filled diamonds (points 1 (panels I), 25 (panels II) and 51 (panels III)). All red diamonds are within the distance r from the filled diamond (i.e. they are within the green shaded area). The average fraction of points that are neighbors are 0.2251 for r = 0.01 and 0.3757 for r = 0.02. Next, in C and D, we calculate the correlation integral for d = 2 (dimension 2). Here, we do not just look if a point is visited repeatedly, but we look if sets of 2 consecutive points are visited repeatedly. We plot every point in the time series against the next point of the time series (C and D). The green shaded ares shows the area for which points are considered neighbors for point 1 (panels I), point 25 (panels II) and point 51 (panels III). As r increases from 0.01 to 0.02 (from C to D), the average fraction of neighbors increases from 0.1012 to 0.2220.
Fig 2
Fig 2. The correlation integral for various values of r and d form the foundation for other complexity measures such as correlation dimension and sample entropy.
Top panel illustrates the development of the fraction of neighbors as r and d increase. Bottom panel shows the same but on log-log scale. The correlation dimension is defined as the slope of the line as r increases. The sample entropy is defined as the distance between two lines as d increases. The points from Fig 1 are all on these lines.
Fig 3
Fig 3. Calculation of transition probability pAR(t) for a single healthy participant.
(A) Shows 7 days of accelerometer data; a zoom-in of a 12-hour period (shaded region above); and the binary active-rest classification. (B) Shows a histogram of active bout durations observed across the 7 days. (C) Shows the number of active runs, N, of duration t for t = 1, 2,..., tmax. The values of N1 and N2 as plotted in panel C are the areas under the curve in panel B from times 1 and 2 onward, respectively as indicated by the black lines in panel B. (D) Shows the active-rest transition probabilities, pAR(t), after being active for each duration. Adapted from [9].
Fig 4
Fig 4. Extracting fragmentation values.
Using the transition probabilities resulting from the procedure in Fig 3, the rest-active (kRA) and active-rest (kAR) fragmentation values are calculated by taking the average of the transition probabilities within the constant region – defined as the longest stretch within which the LOWESS curve fit to the pAR(t) or pRA(t) data varied by no more than 1 SD of their respective curves – weighted by the number of observations used to estimate the probability. Adapted from [9].
Fig 5
Fig 5. Traditional analysis of accelerometer data: Average, coefficient of variation and autocorrelation
Healthy individuals have a higher average activity, a higher coefficient of variation, and a higher lag-1 autocorrelation than individuals with Myotonic Dystrophy type I.
Fig 6
Fig 6. Dynamic indicators for healthy individuals and individuals with Myotonic Dystrophy type I.
Healthy individuals have a lower correlation dimension, a lower active-to-rest transition probability and a higher rest-to-active transition probability than individuals with Myotonic Dystrophy type I.
Fig 7
Fig 7. Binary logistic regression for correlation dimension, kAR and kRA,
the factors that constitute the logistic model that distinguishes between healthy subjects and patients with myotonic dystrophy type I.

References

    1. Salomon JA, Mathers CD, Chatterji S, Sadana R, Ustun TB, Murray CJ. Quantifying individual levels of health: definitions, concepts and measurement issues. Health systems performance assessment: debate, methods, and empiricism. 2003. p. 301–18.
    1. Hughner RS, Kleine SS. Views of health in the lay sector: a compilation and review of how individuals think about health. Health (London). 2004;8(4):395–422. doi: 10.1177/1363459304045696 - DOI - PubMed
    1. Buchman TG. The community of the self. Nature. 2002;420(6912):246–51. doi: 10.1038/nature01260 - DOI - PubMed
    1. Scheffer M, Bolhuis JE, Borsboom D, Buchman TG, Gijzel SMW, Goulson D, et al. Quantifying resilience of humans and other animals. Proc Natl Acad Sci U S A. 2018;115(47):11883–90. doi: 10.1073/pnas.1810630115 - DOI - PMC - PubMed
    1. Burger J, van der Veen DC, Robinaugh DJ, Quax R, Riese H, Schoevers RA, et al. Bridging the gap between complexity science and clinical practice by formalizing idiographic theories: a computational model of functional analysis. BMC Med. 2020;18(1):99. doi: 10.1186/s12916-020-01558-1 - DOI - PMC - PubMed

LinkOut - more resources