. 2025 Jul 11;11(28):eads6613.
doi: 10.1126/sciadv.ads6613. Epub 2025 Jul 9.

Synthetic efferocytic receptor microglia enhances anti-inflammatory clearance of amyloid-β for AD treatment in mice

Affiliations

Synthetic efferocytic receptor microglia enhances anti-inflammatory clearance of amyloid-β for AD treatment in mice

Lijuan Shao et al. Sci Adv. .

Abstract

Monoclonal antibody immunotherapy targeting the clearance of amyloid-β (Aβ) has shown promise in Alzheimer's disease (AD). However, current antibody treatments trigger Fc receptors and induce proinflammatory responses, in turn exacerbating neuronal damage. Here, we report a synthetic efferocytic receptor (SER) integrating Aβ-targeting scFv, efferocytosis receptor backbone based on TIM4 and downstream signal for microglia (MG) reprogramming, which enabled selective elimination of Aβ without inducing an inflammatory response. Specifically, our in-house-customized MG-editing mRNA lipid nanoparticles (MERLINs) efficiently introduced SER mRNA into MG to generate Aβ-specific SER-MG in situ. SER-MG exhibited robust Aβ-specific phagocytosis and stimulated anti-inflammatory efferocytosis typical signaling in vitro. In a mouse model of AD, SER expression in the MG markedly increased the clearance of Aβ and dampened inflammation, resulting in improved behavioral outcomes along with substantially reduced synapse elimination. Our findings establish that AD-associated aberrant MG can be in situ reprogrammed with SER for Aβ clearance in an anti-inflammatory manner, with broad application in other inflammation-related diseases.


Figures
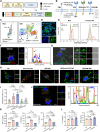
Fig. 1.
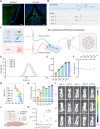
Fig. 1.. SER-MG mediate the phagocytosis of Aβ without inducing proinflammatory responses.
(A) Schematic of SER mRNA design. (B) Schematic illustrating structural design of SER and its variants. (C) Structural simulation of TIM4 and SER with AlphaFold2. (D) Immunofluorescence images of BV2 cells expressing the SER with a GFP tag. Blue, DAPI; green, SER. Scale bar, 10 μm. (E) Flow cytometry profiles of SER expression in BV2 cells and primary MG with a G4S linker of anti-Aβ scFv. (F) Immunofluorescence results for SER-MG incubated with Aβ for 1 hour (left) and corresponding linear scan of fluorescence intensity along white dotted line (right). Blue, DAPI; green, SER; red, dock180. Scale bar, 2 μm. (G) Immunofluorescence results (left) and enlarged images (right) for SER-MG incubated with Aβ for 1 hour. Blue, DAPI; green, phalloidin; red, Aβ. Scale bars, 2 μm (left) and 0.5 μm (right). (H and I) Immunofluorescence results (H) and calculated phagocytic index (I) for BV2 cells in different treatment groups after phagocyting Aβ plaques for 2 hours. Blue, DAPI; red, Aβ; green, WGA. Scale bar, 1 μm (n = 10). (J) Fluorescence images of BV2 cells after incubation with Aβ for 6 hours (left) and corresponding linear scan of fluorescence intensity along white dotted line (right). Blue, DAPI; green, LysoTracker; red, Aβ. Scale bar, 5 μm. (K) Quantitative analysis of secreted TNF-α, IL-6, and IL-1β in Aβ-coincubated MG with different treatments (n = 9). (L) Quantitative analysis of secreted IL-10 and TGF-β in Aβ-coincubated MG with different treatments (n = 6). The data are presented as the means ± SD. The statistical comparisons in (I), (K), and (L) were performed via one-way ANOVA (ns = not significant, *P < 0.05, **P < 0.01, ***P < 0.001, ****P < 0.0001). (D), (F), (G), (H), and (J) show representative images of the corresponding independent biological samples.
Fig. 2.
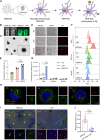
Fig. 2.. Construction and characterization of brain-penetrating LNPs.
(A) Expression of Mfsd2a in the meninges and ventricles according to immunofluorescence staining. The white dashed line indicates the surface of the cerebral parenchyma; blue, DAPI; green, Mfsd2a. Scale bar, 25 μm. (B) LPC-oleate library. (C) Schematic of LNP preparation. (D) Particle diameter distribution of LNPs using LPC-oleate equipped with saturated fatty acid chain ranging from C10 to C18 as helper lipids. (E) Average particle diameter of LNP-10, LNP-12, LNP-14, LNP-16, and LNP-18 (n = 3). (F) Zeta potentials of LNP-10, LNP-12, LNP-14, LNP-16, and LNP-18 (n = 3). (G) Flow cytometry results after the transfection of GFP-mRNA with LNPs based on different LPC-oleates. (H) Quantitative fluorescence assay of cells transfected with different LNPs (n = 3). (I to K) Scheme for intrathecal injection in mice (J), visualization of luciferase expression distribution (I), and quantitative analysis of brain bioluminescence intensity (BLI) (K) after the injection of different luciferase mRNA-laden LNPs into nude mice (n = 3). The data are presented as the means ± SD. The statistical comparisons in (H) and (K) were performed via one-way ANOVA (*P < 0.05, ****P < 0.0001).
Fig. 3.
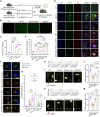
Fig. 3.. MERLINs selectively target MG and achieve intracellular mRNA release.
(A) Schematic diagram of the process by which MGs internalize MERLINs and express the SER on the surface of the cell membrane for the clearance of Aβ. (B) Transmission of LNPs detected by a 532-nm laser. (C) TEM image showing the morphology of the constructed LNPs. (D and E) Fluorescence images (D) and corresponding intensity (E) of BV2 cells after treatment with PBS, LNP-Cy7, and MERLIN-Cy7 (n = 3). Scale bar, 20 μm. (F and G) Flow cytometry profiles (F) and corresponding quantitative analysis (G) of GFP fluorescence intensity after administration of GFP-mRNA, LNP, and MERLINs encapsulating GFP-mRNA to BV2, C8-D1A, and bEnd3 cells, respectively (n = 3). (H) Representative immunofluorescence images of BV2 cells after 2, 4, and 6 hours of incubation with MERLINs. Blue, DAPI; green, LysoTracker; red, Cy5-mRNA. Scale bars, 1 μm (left) and 2 μm (right). (I) Immunofluorescence showing the distribution of MERLIN-Cy7 and LNP-Cy7 within the cerebral parenchyma (white arrows, colocalization between MG and MERLIN-Cy7). Blue, DAPI; green, IBA1; red, MERLINs/LNPs. Scale bars, 100 μm (top) and 10 μm (bottom). (J) Quantitative analysis of MG internalizing MERLINs or LNPs (n = 10). The data are presented as the means ± SD. The statistical comparisons in (E) and (G) were performed via one-way ANOVA and two-way ANOVA, respectively. The statistical comparison in (J) was calculated using Student’s t test (**P < 0.01, ****P < 0.0001). (D), (H), and (I) show representative images of the corresponding independent biological samples.
Fig. 4.
Fig. 4.. SER-MG mediates Aβ clearance and behavior rescue in APP/PS1 mice.
(A) Schematic illustration of the experimental design. WT, wild type. (B and C) Thioflavin T staining (B) and statistical analysis of fluorescence intensity (C) of brain sections from normal and APP/PS1 mice after various treatments. Scale bar, 200 μm (n = 3). (D and E) Representative immunofluorescence images (D) and statistical analysis (E) of Aβ burden and neuron damage in wild-type or APP/PS1 mice from different groups. Blue, DAPI; green, LAMP1; red, Aβ. Scale bars, 100 μm (left) and 30 μm (right) (n = 3). (F and G) Immunofluorescence staining of wild-type and AD mouse brain sections (F) from different treatment groups to observe Aβ phagocytosis by MG and quantitative analysis of fluorescence intensity (G). Scale bars, 50 μm (left) and 10 μm (right) (n = 20). (H to J) Graphical illustration of the novel object location (NOL) test (H) and representative pictures of the locomotor trajectories of mice in different treatment groups (I) with statistical analysis (J) (n = 6). (K to M) Graphical illustration of the novel object recognition (NOR) test (K) and representative pictures of the movement trajectories of mice in different treatment groups (L) with statistical analysis (M) (n = 6). The data are presented as the means ± SD. The statistical comparisons in (C), (E), (G), (J), and (M) were performed via one-way ANOVA (ns = not significant, *P < 0.05, **P < 0.01, ***P < 0.001, ****P < 0.0001). (B), (D), (F), (I), and (L) show representative images of the corresponding independent biological samples.
Fig. 5.
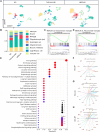
Fig. 5.. Single-cell sequencing analysis reveals the mechanism of SER-MG treatment in APP/PS1 mice.
(A) Single-cell sequencing analyses of the brain hippocampal region of AD mice in the PBS, aducanumab, and MERLIN treatment groups and the corresponding UMAP plots of cells depicting separation into nine clusters. (B) Cluster fractions of cells from the hippocampus of each treatment group. (C and D) GSEA comparing MERLIN and aducanumab treatment. Gene set terms are indicated as follows: FDR, false discovery rate; NeS, normalized enrichment score. (E) KEGG enrichment analysis of signaling pathway enrichment of neurons in the MERLIN versus aducanumab treatment groups. (F to H) GO enrichment analysis of neurons based on sequencing results from different treatment groups.
Fig. 6.
Fig. 6.. Intracranial generation of SER-MG for anti-inflammatory clearance of Aβ.
(A) Schematic of MERLIN-enabled in situ generation of SER-MG for alleviating AD via Aβ clearance and inflammation resolution. (B) Transport of MERLINs penetrating the meninges or ventricles. (C) MG selectively internalize MERLINs via CD206 and express the SER on their surface, subsequently activating downstream signals to reorganize the cytoskeleton and mediate anti-inflammatory responses.

References

    1. Duyckaerts C., Delatour B., Potier M. C., Classification and basic pathology of Alzheimer disease. Acta Neuropathol. 118, 5–36 (2009). - PubMed
    1. Long J. M., Holtzman D. M., Alzheimer disease: An update on pathobiology and treatment strategies. Cell 179, 312–339 (2019). - PMC - PubMed
    1. Kawas C., Gray S., Brookmeyer R., Fozard J., Zonderman A., Age-specific incidence rates of Alzheimer’s disease: The Baltimore longitudinal study of aging. Neurology 54, 2072–2077 (2000). - PubMed
    1. Masters C. L., Bateman R., Blennow K., Rowe C. C., Sperling R. A., Cummings J. L., Alzheimer’s disease. Nat. Rev. Dis. Primers 1, 15056 (2015). - PubMed
    1. Rhodius-Meester H. F. M., Tijms B. M., Lemstra A. W., Prins N. D., Pijnenburg Y. A. L., Bouwman F., Scheltens P., van der Flier W. M., Survival in memory clinic cohort is short, even in young-onset dementia. J. Neurol. Neurosurg. Psychiatry 90, 726–728 (2019). - PMC - PubMed

Substances