. 2025 Aug:118:105830.
doi: 10.1016/j.ebiom.2025.105830. Epub 2025 Jul 8.

GWAS meta-analysis identifies five susceptibility loci for endometrial cancer

Dhanya Ramachandran  1 Xuemin Wang  2 Triin Laisk  3 Ying Zheng  4 Nathan Ingold  2 Daffodil M Canson  5 Pik Fang Kho  2 Bianca J Naumann  6 Carly J Chapman  2 Kristine Bousset  1 Anna V Krause  1 Peter Schürmann  1 Britta Wieland  1 Patricia Hanel  1 Fabienne Hülse  1 Norman Häfner  7 Ingo Runnebaum  8 Natalia Dubrowinskaja  9 Nurzhan Turmanov  10 Tatyana Yugay  11 Zura Berkutovna Yessimsiitova  12 Frédéric Amant  13 Daniela Annibali  14 Matthias W Beckmann  15 Clara Bodelon  16 Daniel D Buchanan  17 Chu Chen  18 Megan A Clarke  19 Linda S Cook  20 Immaculata De Vivo  21 Wout De Wispelaere  14 Mengmeng Du  22 Douglas F Easton  23 Julius Emons  15 Peter A Fasching  15 Christine M Friedenreich  24 Grace Gallagher  22 Graham G Giles  25 Ellen L Goode  26 Holly R Harris  27 David J Hunter  28 David L Kolin  29 Peter Kraft  30 James V Lacey  31 Diether Lambrechts  32 Lingeng Lu  33 George L Mutter  34 Jeffin Naduparambil  22 Kelli O'Connell  22 Alpa V Patel  16 Paul D P Pharoah  35 Timothy R Rebbeck  36 Fulvio Ricceri  37 Harvey A Risch  33 Matthias Ruebner  15 Carlotta Sacerdote  38 Rodney J Scott  39 V Wendy Setiawan  40 Xiao-Ou Shu  41 Melissa C Southey  42 Emma Tham  43 Ian Tomlinson  44 Constance Turman  45 Nicolas Wentzensen  19 Wanghong Xu  46 Herbert Yu  47 Wei Zheng  41 Amanda B Spurdle  5 Yosef Yarden  48 Estonian Biobank Research Team  3 Reedik Mägi  3 Peter Hillemanns  1 Dylan M Glubb  6 Thilo Dörk  49 Tracy A O'Mara  50
Affiliations

GWAS meta-analysis identifies five susceptibility loci for endometrial cancer

Dhanya Ramachandran et al. EBioMedicine. 2025 Aug.

Abstract

Background: Endometrial cancer is the most common gynaecological cancer in high-income countries. In addition to environmental risk factors, genetic predisposition contributes towards endometrial cancer development but is still incompletely defined.

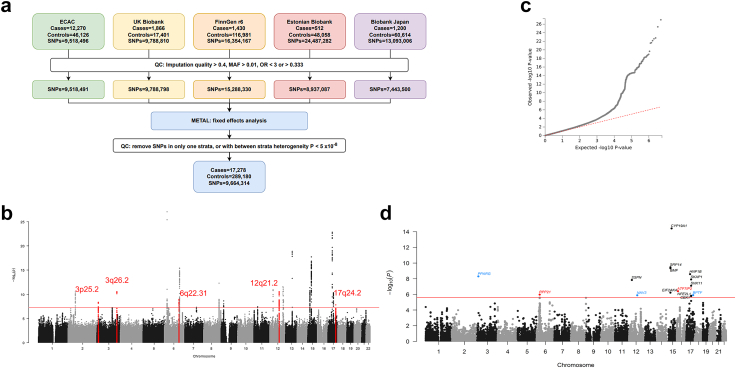
Methods: Building on genome-wide association studies (GWASs) by the Endometrial Cancer Association Consortium, we conducted a GWAS meta-analysis of 17,278 endometrial cancer cases and 289,180 controls, incorporating biobank samples from the UK, Finland, Estonia and Japan.

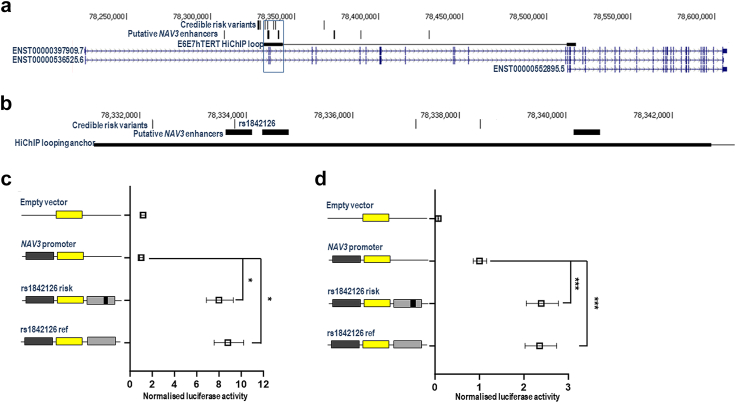
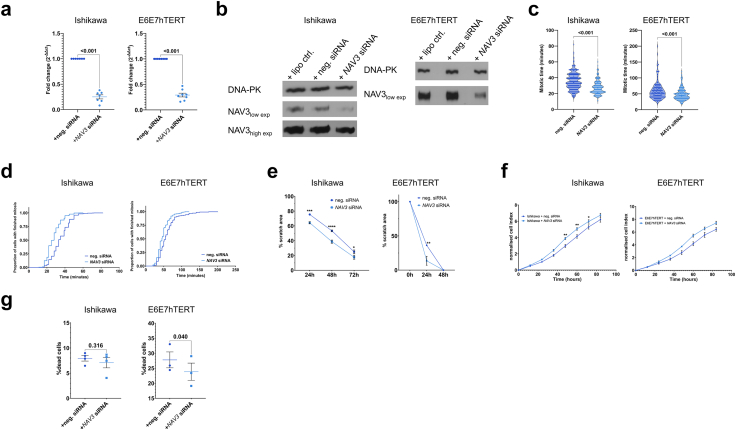
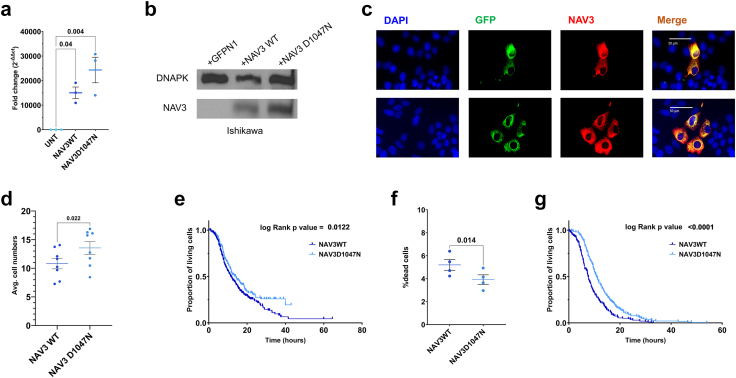
Findings: GWAS analysis identified five additional risk loci (3p25.2, 3q25.2, 6q22.31, 12q21.2, and 17q24.2). Corresponding gene-based analyses supported findings for three of the five loci, at NAV3 (12q21.2), PPARG (3p25.2), and BPTF (17q24.2), as well as two additional candidate risk regions at ATF7IP2 (16p13.2-p13.13) and RPP21 (6p22.1). Validation genotyping in further independent case-control series replicated the most significant locus at 12q21.2 and corroborated risk variants located intronic to NAV3, the gene for Neuron Navigator 3. Downregulation of NAV3 in endometrial cell lines accelerated cell division and wound healing capacity whereas NAV3 overexpression reduced cell survival and increased cell death, indicating that NAV3 acts as a tumour suppressor in endometrial cells.

Interpretation: Our large study extends the number of genome-wide significant risk loci identified for endometrial carcinoma by about one-third and proposes a role of NAV3 as a tumour suppressor in this common cancer.

Funding: This study was mainly supported by funding from the Wilhelm Sander Foundation, Germany, and the National Health and Medical Research Council (NHMRC) of Australia. A complete list of funding organisations is provided in the acknowledgements.

Keywords: Endometrial carcinoma; GWAS; Luciferase; NAV3; eQTL.


Conflict of interest statement

Declaration of interests D. Ramachandran received intramural funding from Hannover Medical School. M. Clark. has stock options in AbbVie and is employed by AbbVie on work not related to current manuscript. 1U01CA250476-01A1 to I. De Vivo and G. L. Mutter. NCI P30CA008748, U01CA250476 to M. Du. J. Emons receives honoraria for lectures from Pfizer, Eisai, AstraZeneca, Novartis, participates in the advisory board for these and MSD, receives travel money from AstraZeneca. Grant awards 3U01-CA199277-07S1 and 3U01-CA199277-08S1 from the NCI to J. V. Lacey for whole genome sequencing for participants in the California Teachers Study, which contributed data to this manuscript. P. A. Fasching receives grants from BioNTech, Cepheid, Pfizer; consulting fees, honoraria for lectures, and participates in an advisory board for Novartis, Pfizer, Roche, Daiichi-Sankyo, AstraZeneca, Lilly, Eisai, Merck Sharp & Dohme, Pierre Fabre, SeaGen, Agendia, Sanofi Aventis, Gilead, Mylan. D. L. Kolin holds stocks of Abbott laboratories, Alcon Inc., Becton Dickinson, Novartis, Pfizer, and UnitedHealth Group. G. L. Mutter received consulting fees from Bayer as personal consultant in pathology to perform diagnostic safety reads for clinical trials. A. V. Patel is on the NCI board of scientific counsellors. NIH funding to H. Risch. E. Tham received grants from Region Stockholm, the Swedish Childhood Cancer Fund (Barncancerfonden) and the Swedish Cancer Fund (Cancerfonden). E. Tham is a board member of Anna Dahlbäck’s memorial fund. Grants from CRUK and Genome Canada to D. Easton. NIH grant to P. Kraft. CRUK grants to P. Pharoah. D. Lambrechts receives annual funding from VIB. D. Glubb received payment from the University of Sharjah for grant reviewing. Grant from Wilhelm Sander Foundation to T. Dörk and P. Hillemanns. T. A. O’Mara received funding from the US Department of Defence and Worldwide Cancer Research. None of the sponsors had any role in the design, data generation or result interpretation in this study. All other authors declare no competing interests.

Figures

Fig. 1
Fig. 1
GWAS meta-analysis for endometrial cancer. (a) Workflow showing the different studies that contributed summary statistics and QC steps involved, (b) Manhattan plot displaying chromosomes on the x-axis in alternating black and light grey tones, with -log10 p values after meta-analysis on the y-axis, genome-wide significance threshold is set at 5 × 10⁻⁸ in a red line, and variants underlying the five genomic loci identified in this study are coloured as red dots, (c) Quantile-quantile plot of expected versus observed p values from the GWAS summary statistics, (d) Manhattan plot after genome-wide gene-based MAGMA analysis displays chromosomes on the x-axis in alternating black and light grey hues, with -log10 p values on the y-axis. Genome-wide significance threshold is set to 2.45 × 10⁻⁶ and all significant genes above this threshold are labelled, with the gene names coloured in red and blue. Loci that only come up in the MAGMA analysis are labelled in red whereas loci that were identified in both the meta-analysis and MAGMA analysis are in blue.
Fig. 2
Fig. 2
Five genomic loci for endometrial cancer. LocusZoom plots at (a) 3p25.2, (b) 3q26.2, (c) 6q22.31, (d) 12q21.2, and (e) 17q24.2 show chromosomal position on the x-axis, genes located within 1 Mbp of the lead SNP, −log10 p values on the left y-axis, recombination rate on the right y-axis, and linkage with the lead SNP is colour coded according to the legend (r2 ≥ 0.8 in red, 0.6–08 in yellow, 0.4–0.6 in green, 0.2–0.4 in light blue and 0–0.2 in dark blue).
Fig. 3
Fig. 3
Functional genetic analysis of the 12q21.2 risk locus. (a) Mapping of credible risk variants, protein coding NAV3 transcripts and promoter/enhancer HiChIP looping data at the 12q21.2 locus reveals colocalisation of risk variants with a HiChIP anchor that loops to the promoter region of a NAV3 transcript (ENST00000552895.5). (b) Zooming into the highlighted box in Panel A, this panel illustrates that a risk variant (rs1842126) within the HiChIP anchor localises to a putative NAV3 enhancer identified in endometrial tumours. Panels (c) and (d) show normalised luciferase activity from reporter gene assays involving the empty pGL3-Basic vector, a reporter gene construct containing the promoter of the ENST00000552895.5 NAV3 isoform, and NAV3 promoter reporter gene constructs with the putative enhancer carrying risk or reference alleles of rs1842126 in E6E7hTERT and Ishikawa cells, respectively. Error bars denote 95% confidence intervals for experiments conducted in triplicate. p values were determined by two-way ANOVA followed by Dunnett’s multiple comparisons test (∗p < 0.05, ∗∗∗p < 0.001).
Fig. 4
Fig. 4
Functional assessment after NAV3 silencing in Ishikawa and E6E7hTERT cells. (a) Fold changes after qRT-PCR for NAV3 levels in Ishikawa cells (left panel), and E6E7hTERT cells (right panel). Each dot represents a biological replicate. p value indicated after paired t-test, (b) Western blot for NAV3 in Ishikawa cells (left panel), and E6E7hTERT cells (right panel) after silencing using siRNA, together with DNA-PK as housekeeper, high exp indicates higher exposure time, whereas low exp indicates lower exposure time, (c) Mitotic time per cell (in minutes) after silencing NAV3 in Ishikawa cells (left panel), and E6E7hTERT cells (right panel). Each dot represents a cell in three biological experiments. p value indicated after unpaired t-test, (d) Proportion of cells that finished mitosis on the y-axis, time (in minutes) on the x-axis, after silencing NAV3 in Ishikawa cells (left panel), and E6E7hTERT cells (right panel). Data shown from three biological experiments, (e) Percentage reduction of scratch area (relative to 0 h) on the y-axis and time (in hours) on the x-axis, after silencing NAV3 in Ishikawa cells (left panel), and E6E7hTERT cells (right panel). Three biological experiments were performed in Ishikawa cells, and a single biological experiment was taken for E6E7hTERT cells. p value indicated with asterisk in multiple comparisons after ANOVA. ∗p < 0.05, ∗∗p < 0.01, ∗∗∗p < 0.001, ∗∗∗∗p < 0.0001, (f) Normalised cell index showing impedance in xCELLigence experiments after silencing NAV3 in Ishikawa cells (left panel), and E6E7hTERT cells (right panel). Time in hours on the x-axis. Data shown from a single biological experiment with five technical replicates in both cell lines. p value indicated with asterisk in multiple comparisons after ANOVA. ∗p < 0.05, ∗∗p < 0.01, ∗∗∗p < 0.001, ∗∗∗∗p < 0.0001, (g) Percentage of dead cells after propidium iodide staining after silencing NAV3 in Ishikawa cells (left panel), and E6E7hTERT cells (right panel). Treatment on the x-axis. Data shown from four biological experiments in Ishikawa and three biological replicates in E6E7hTERT cells. p value indicated after paired t-test.
Fig. 5
Fig. 5
Functional assessment after NAV3 overexpression in Ishikawa cells. (a) Fold changes after qRT-PCR for NAV3 levels in Ishikawa cells transfected with pEGFPN1-NAV3WT and pEGFPN1-NAV3D1047N plasmids versus untreated controls. Each dot represents a biological replicate. p value indicated after paired t-test, (b) Immunoblotting of NAV3 and DNAPK in Ishikawa cells transfected with pEGFPN1, pEGFPN1-NAV3WT and pEGFPN1-NAV3D1047N, (c) Immunocytochemistry to visualize NAV3 overexpression in pEGFPN1-NAV3WT (upper panel) or pEGFPN1-NAV3D1047N (lower panel) transfected Ishikawa cells (NAV3 in red), with DAPI (for nuclear staining, in blue), and GFP fluorescence (in green), with the last panel showing the merged overlay, (d) Average cell numbers after transfecting Ishikawa cells with pEGFPN1-NAV3WT and pEGFPN1-NAV3D1047N plasmids at 72 h after transfection. Each dot represents a biological replicate. p value indicated after paired t-test, (e) Proportion of green cells remaining after transfecting Ishikawa cells with pEGFPN1-NAV3WT and pEGFPN1-NAV3D1047N plasmids. Each dot represents a cell from three biological experiments, with log rank p value shown, (f) Percentage of dead cells after DAPI staining after overexpression of pEGFPN1-NAV3WT and pEGFPN1-NAV3D1047N plasmids in Ishikawa cells. Data shown from four biological experiments. p value indicated after paired t-test, (g) Time to death in non-surviving green cells after transfecting Ishikawa cells with pEGFPN1-NAV3WT and pEGFPN1-NAV3D1047N plasmids. Each dot represents a cell from three biological experiments, with log rank p value shown.

Similar articles

References

    1. Sung H., Ferlay J., Siegel R.L., et al. Global cancer statistics 2020: GLOBOCAN estimates of incidence and mortality worldwide for 36 cancers in 185 countries. CA Cancer J Clin. 2021;71(3):209–249. https://onlinelibrary.wiley.com/doi/10.3322/caac.21660 Available from: - DOI - PubMed
    1. Siegel R.L., Miller K.D., Wagle N.S., Jemal A. Cancer statistics, 2023. CA Cancer J Clin. 2023;73(1):17–48. https://acsjournals.onlinelibrary.wiley.com/doi/10.3322/caac.21763 Available from: - DOI - PubMed
    1. Makker V., MacKay H., Ray-Coquard I., et al. Endometrial cancer. Nat Rev Dis Prim. 2021;7(1) - PMC - PubMed
    1. Urick M.E., Bell D.W. Clinical actionability of molecular targets in endometrial cancer. Nat Rev Cancer. 2019;19(9):510–521. doi: 10.1038/s41568-019-0177-x. - DOI - PMC - PubMed
    1. Morice P., Leary A., Creutzberg C., Abu-Rustum N., Darai E. Endometrial cancer. Lancet. 2016;387(10023):1094–1108. https://linkinghub.elsevier.com/retrieve/pii/S0140673615001300 Available from: - PubMed

LinkOut - more resources