. 2025 Jul 3;104(10):105507.
doi: 10.1016/j.psj.2025.105507. Online ahead of print.

The effect of Lupinus angustifolius supplementation in laying hens on the liver proteome profiles and the concentration of acute phase proteins in serum and liver

Affiliations

The effect of Lupinus angustifolius supplementation in laying hens on the liver proteome profiles and the concentration of acute phase proteins in serum and liver

Sebastian Grabowski et al. Poult Sci. .

Abstract

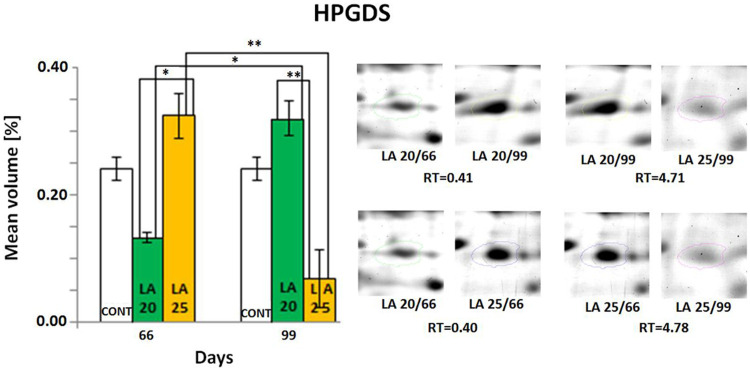
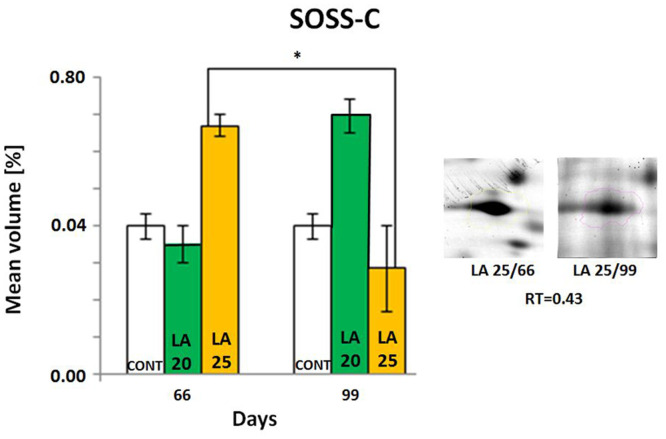
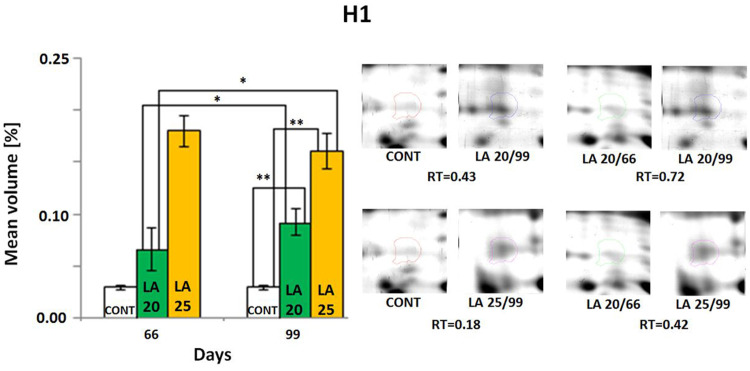
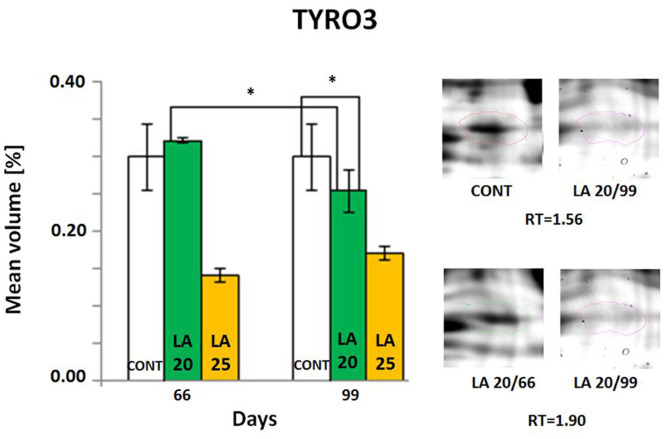
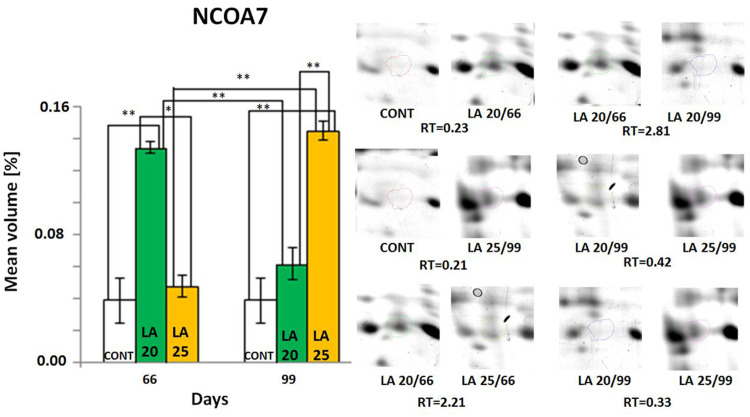
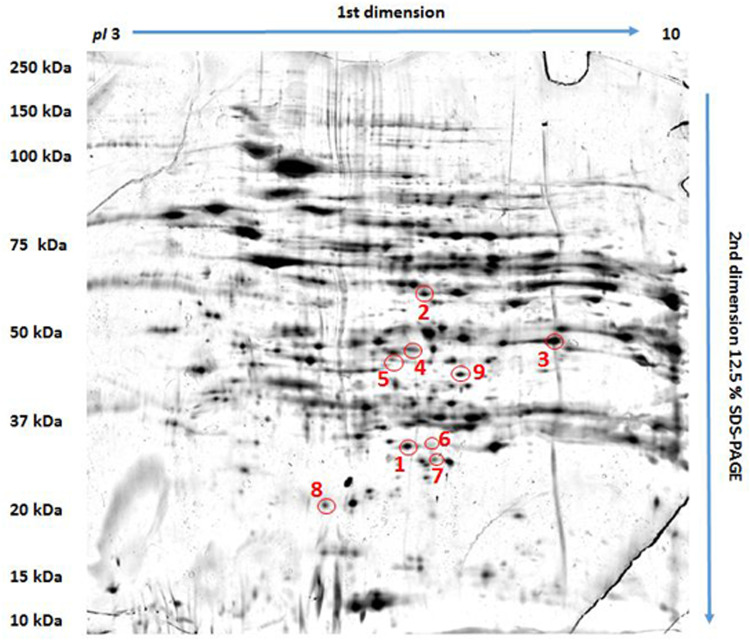
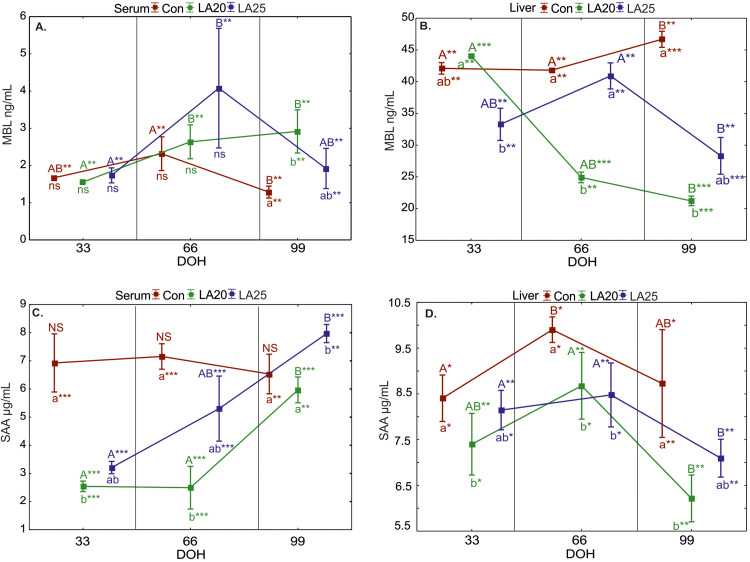
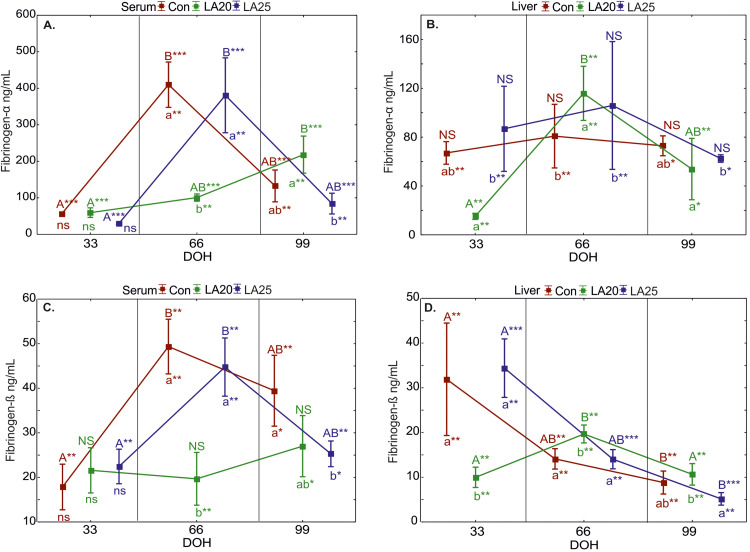
In the search for alternative protein sources for laying hens that meet production criteria and are an alternative to soybean meal, increasing attention is being paid to the lupine seeds which have high content of proteins, essential amino acids and low content of starch and low glycaemic index. Furthermore, the effect of lupin seed supplementation to the diet of laying hens on liver protein expression and acute phase protein synthesis has not yet been determined. The aim of the study was to identify proteins synthesized in the liver of laying hens fed a diet with a high content of Lupinus angustifolius (20 % and 25 %), to determine differences in their expression, and to evaluate the concentration of acute phase proteins in serum and liver of laying hens. The obtained results indicate that supplementation of lupin at a dose of 20 % and 25 % increases the expression of proteins such as hematopoietic prostaglandin-D synthetase, SOSS complex subunit C, DNA repair protein RAD25 homolog and basic histone H1 protein in the liver, with statistically significant differences being particularly visible in the case of a dose of 25 % lupin on day 99 of the study. Moreover, the use of high doses of lupin in the diet of hens, containing various bioactive substances, caused changes in the concentration of acute phase proteins in the liver, and especially an increase in the synthesis of serum amyloid A component and haptoglobin, which may also affect the synthesis and expression of other proteins in the body, including the liver.

Keywords: Acute phase proteins; Laying hens; Lupinus angustifolius, Liver proteomics; MALDI-TOF MS.


Figures

Fig 1
Fig. 1
Mean volumes (%) of protein spots in the experimental (LA20, LA25) and control (CONT) groups. Statistically different are compared, and ratio parameters (Rt) are given. HPGDS – hematopoietic prostaglandin D synthase. Significant differences assessed using a t-test are marked with asterisks: *P ≤ 0.05, **P ≤ 0.01.
Fig 2
Fig. 2
Mean volumes (%) of protein spots in the experimental (LA20, LA25) and control (CONT) groups. Statistically different are compared, and ratio parameters (Rt) are given. SOSS-C – SOSS complex subunit C. Significant differences assessed using a t-test are marked with asterisks: *P ≤ 0.05.
Fig 3
Fig. 3
Mean volumes (%) of protein spots in the experimental (LA20, LA25) and control (CONT) groups. Statistically different are compared, and ratio parameters (Rt) are given. H1 – histone H1. Significant differences assessed using a t-test are marked with asterisks: *P ≤ 0.05, **P ≤ 0.01.
Fig 4
Fig. 4
Mean volumes (%) of protein spots in the experimental (LA20, LA25) and control (CONT) groups. Statistically different are compared, and ratio parameters (Rt) are given. GS – glutamine synthetase. Significant differences assessed using a t-test are marked with asterisks: **P ≤ 0.01.
Fig 5
Fig. 5
Mean volumes (%) of protein spots in the experimental (LA20, LA25) and control (CONT) groups. Statistically different are compared, and ratio parameters (Rt) are given. EXOC8 – exocyst complex component 8. Significant differences assessed using a t-test are marked with asterisks: *P ≤ 0.05.
Fig 6
Fig. 6
Mean volumes (%) of protein spots in the experimental (LA20, LA25) and control (CONT) groups. Statistically different are compared, and ratio parameters (Rt) are given. TYRO3 – tyrosine-protein kinase receptor 3. Significant differences assessed using a t-test are marked with asterisks: *P ≤ 0.05.
Fig 7
Fig. 7
Mean volumes (%) of protein spots in the experimental (LA20, LA25) and control (CONT) groups. Statistically different are compared, and ratio parameters (Rt) are given. GLRX – glutaredoxin. Significant differences assessed using a t-test are marked with asterisks: **P ≤ 0.01.
Fig 8
Fig. 8
Mean volumes (%) of protein spots in the experimental (LA20, LA25) and control (CONT) groups. Statistically different are compared, and ratio parameters (Rt) are given. NCOA7 – nuclear receptor coactivator 7. Significant differences assessed using a t-test are marked with asterisks: *P ≤ 0.05, **P ≤ 0.01.
Fig 9
Fig. 9
Mean volumes (%) of protein spots in the experimental (LA20, LA25) and control (CONT) groups. Statistically different are compared, and ratio parameters (Rt) are given. RAD52 – DNA repair protein RAD52 homolog. Significant differences assessed using a t-test are marked with asterisks: *P ≤ 0.05.
Fig 10
Fig. 10
Fused image showing the condensed spot patterns from the experiment. The differentially expressed proteins are marked with a circle. Proteins were separated in the first dimension by isoelectric focusing over the isoelectric point (pI) range 3–10. The second dimension was performed using 12.5 % sodium dodecyl sulphate polyacrylamide gel. Gels were silver stained, digitised, and processed in Delta2D software (version 4.7 DECODON Greifswald, Germany).
Fig 11
Fig. 11
One-way Kruskal–Wallis ANOVA and post-hoc tests (p < 0.05) for acute phase proteins (α−1-AGP - alpha-1-acid glycoprotein, ceruloplasmin, haptoglobin) concentration in serum (A, C, F), and liver tissue (B, D, G) of hens at 33 day of experiment (29 week of age), 66 day of experiment (34 week of age) and 99 days of experiment (39 week of age). The same letter designations indicating no statistically significant differences. Statistical differences (p ≤ 0.05.) are marked with different letters and is designated as follows: ns – statistically non-significant difference; statistically significant differences * for p ≤ 0.05; ** for p ≤ 0.001; *** for p ≤ 0.0001. Capital letters were used to denote statistically significant differences between a group across the three-time intervals, and lowercase letters were used to denote differences between groups within a given time interval. CONT – (control group) — basal feed, LA20 — basal feed + 20 % raw lupin seeds (Lupinus angustifolius), LA25 — basal feed + 25 % raw lupin seeds (Lupinus angustifolius). ± SD — standard deviation.
Fig 12
Fig. 12
One-way Kruskal–Wallis ANOVA and post-hoc tests (p < 0.05) for acute phase proteins (MBL - mannose-binding lectin, SAA – serum amyloid A) concentration in serum (A, C), and liver tissue (B, D) of hens at 33 day of experiment (29 week of age), 66 day of experiment (34 week of age) and 99 days of experiment (39 week of age). The same letter designations indicating no statistically significant differences. Statistical differences (p ≤ 0.05.) are marked with different letters and is designated as follows: ns – statistically non-significant difference; statistically significant differences * for p ≤ 0.05; ** for p ≤ 0.001; *** for p ≤ 0.0001. Capital letters were used to denote statistically significant differences between a group across the three-time intervals, and lowercase letters were used to denote differences between groups within a given time interval. CONT – (control group) — basal feed, LA20 — basal feed + 20 % raw lupin seeds (Lupinus angustifolius), LA25 — basal feed + 25 % raw lupin seeds (Lupinus angustifolius). ± SD — standard deviation.
Fig 13
Fig. 13
One-way Kruskal–Wallis ANOVA and post-hoc tests (p < 0.05) for acute phase proteins (fibrinogen-α, fibrinogen-β) concentration in serum (A, C), and liver tissue (B, D) of hens at 33 day of experiment (29 week of age), 66 day of experiment (34 week of age) and 99 days of experiment (39 week of age). The same letter designations indicating no statistically significant differences. Statistical differences (p ≤ 0.05.) are marked with different letters and is designated as follows: ns – statistically non-significant difference; statistically significant differences * for p ≤ 0.05; ** for p ≤ 0.001; *** for p ≤ 0.0001. Capital letters were used to denote statistically significant differences between a group across the three-time intervals, and lowercase letters were used to denote differences between groups within a given time interval. CONT – (control group) — basal feed, LA20 — basal feed + 20 % raw lupin seeds (Lupinus angustifolius), LA25 — basal feed + 25 % raw lupin seeds (Lupinus angustifolius). ± SD — standard deviation.
Fig 14
Fig. 14
Diagram of probable interactions between proteins synthesized in hens liver after Lupinus angustifolius administration, using STRING software version 12 (STRING: functional protein association networks. Version 12.0 https://string-db.org).

Similar articles

References

    1. Bloothooft M., Cremers P., Güven S., Stoutjesdijk S.J., Jiron M., Wessel M., Van Der Heyden M.A.G. Lupin poisoning: a review. Front. Toxicol. 2025;7 doi: 10.3389/ftox.2025.1547535. - DOI - PMC - PubMed
    1. Bridges P.J., Jeoung M.., Shim S., Park J.Y., Lee J.E., Sapsford L.A., Trudgen K., Ko C., Gye M.C., Jo M. Hematopoetic prostaglandin D synthase: an ESR1-dependent oviductal epithelial cell synthase. Endocrinology. 2012;153:1925–1935. doi: 10.1210/en.2011-1900. - DOI - PMC - PubMed
    1. Bryden W.L., Li X.., Ruhnke I., Zhang D., Shini S. Nutrition, feeding and laying hen welfare. Anim. Prod. Sci. 2021;61:893–914. doi: 10.1071/AN20396. - DOI
    1. Burns M., Rizvi S.H.M., Tsukahara Y., Pimentel D.R., Luptak I., Hamburg N.M., Matsui R., Bachschmid M.M. Role of glutaredoxin-1 and glutathionylation in cardiovascular diseases. Int. J. Mol. Sci. 2020;21:6803. doi: 10.3390/ijms21186803. - DOI - PMC - PubMed
    1. Chen L.R., Lee S..C., Lin Y.P., Hsieh Y.L., Chen Y.L., Yang J.R., Liou J.F., Chen C.F., Lee Y.P., Shiue Y.L. Prostaglandin-D synthetase induces transcription of the LH beta subunit in the primary culture of chicken anterior pituitary cells via the PPAR signaling pathway. Theriogenology. 2010;73:367–382. doi: 10.1016/j.theriogenology.2009.09.020. - DOI - PubMed