. 2025 Jul 4:85:103752.
doi: 10.1016/j.redox.2025.103752. Online ahead of print.

SENP1-Sirt3 axis regulates type II alveolar epithelial cell activity to confer resistance against oxidative damage in lung tissue

Affiliations

SENP1-Sirt3 axis regulates type II alveolar epithelial cell activity to confer resistance against oxidative damage in lung tissue

Mingming Zhang et al. Redox Biol. .

Abstract

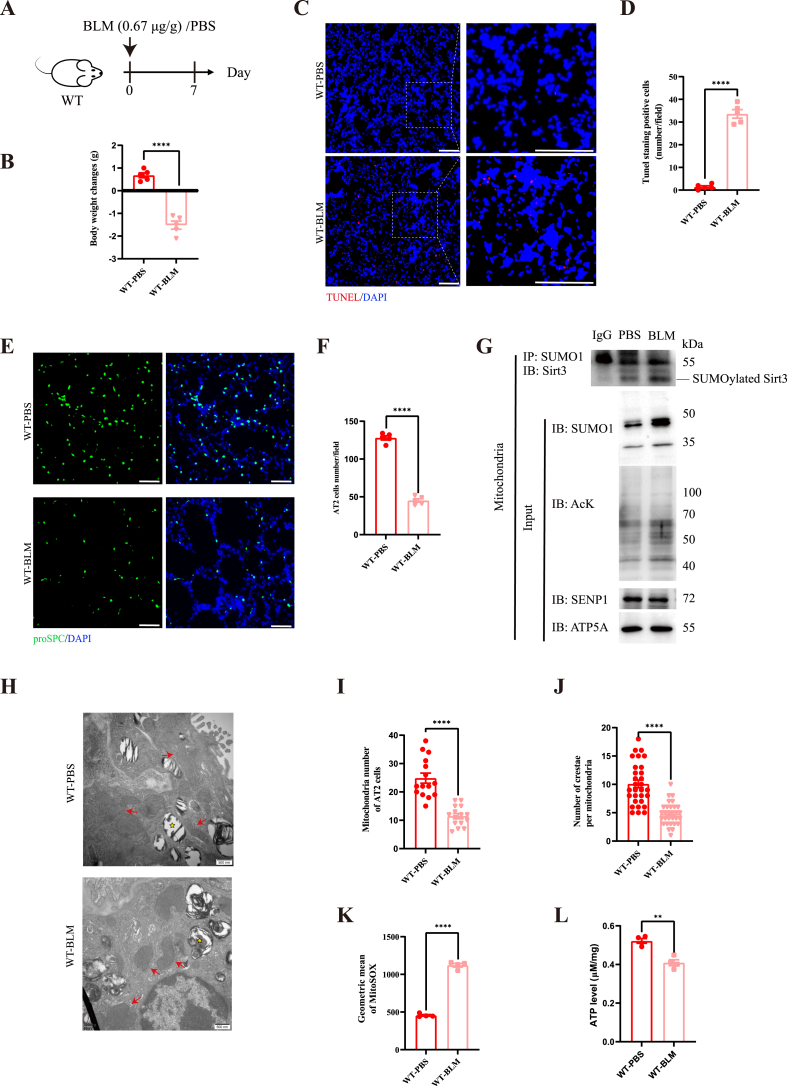
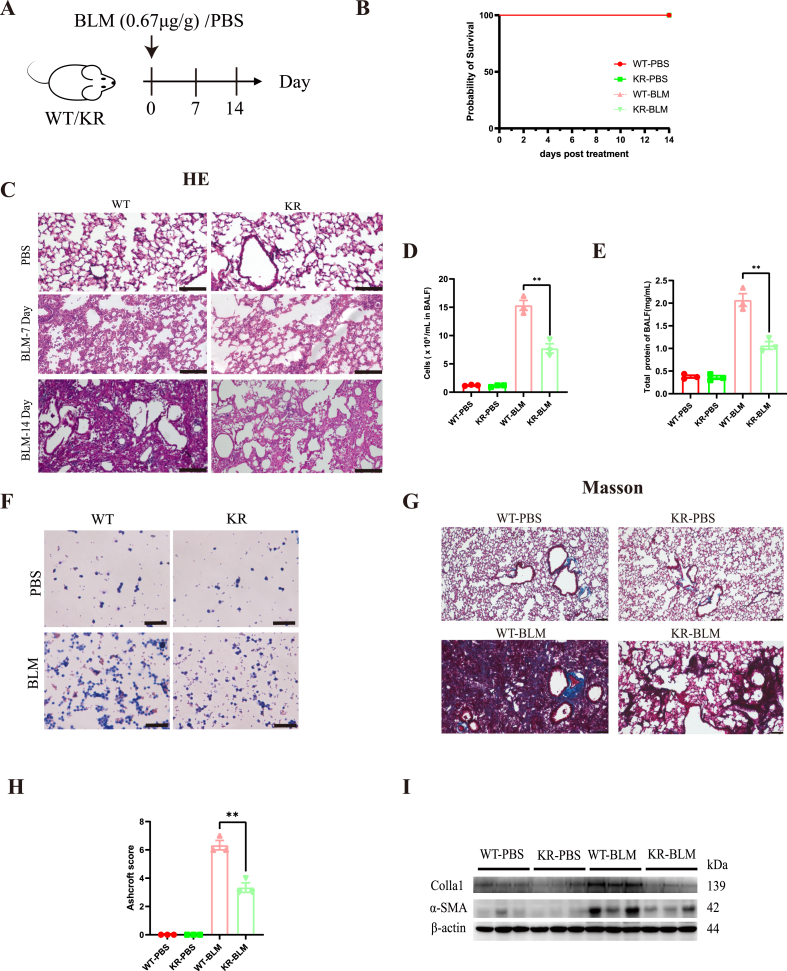
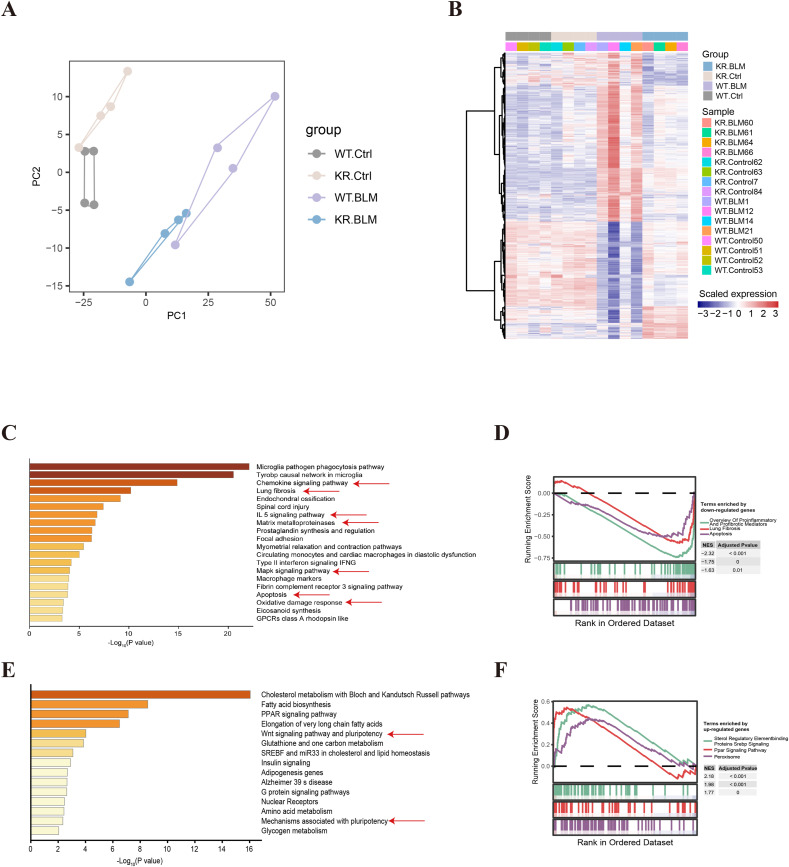
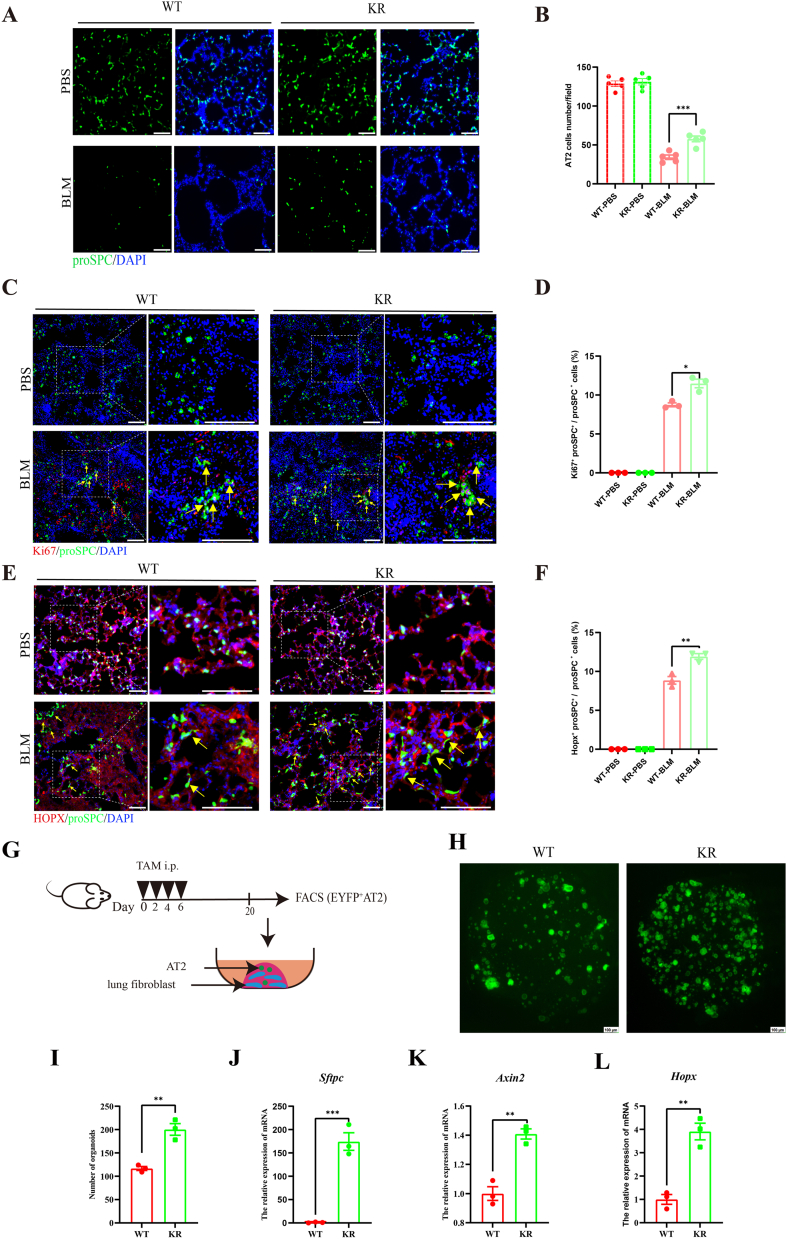
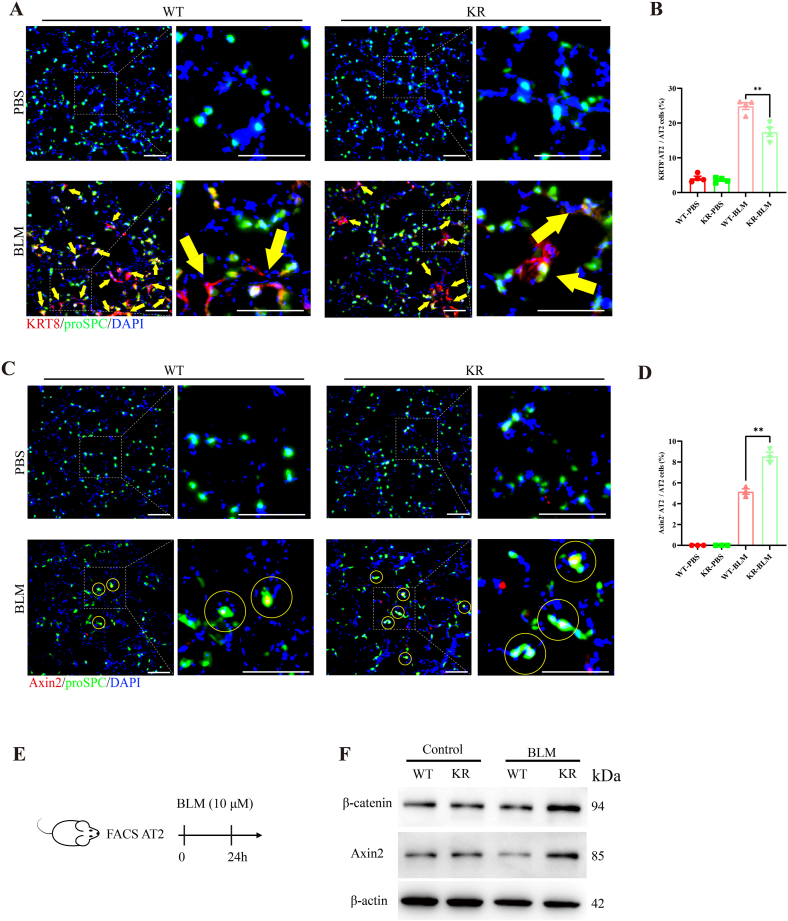
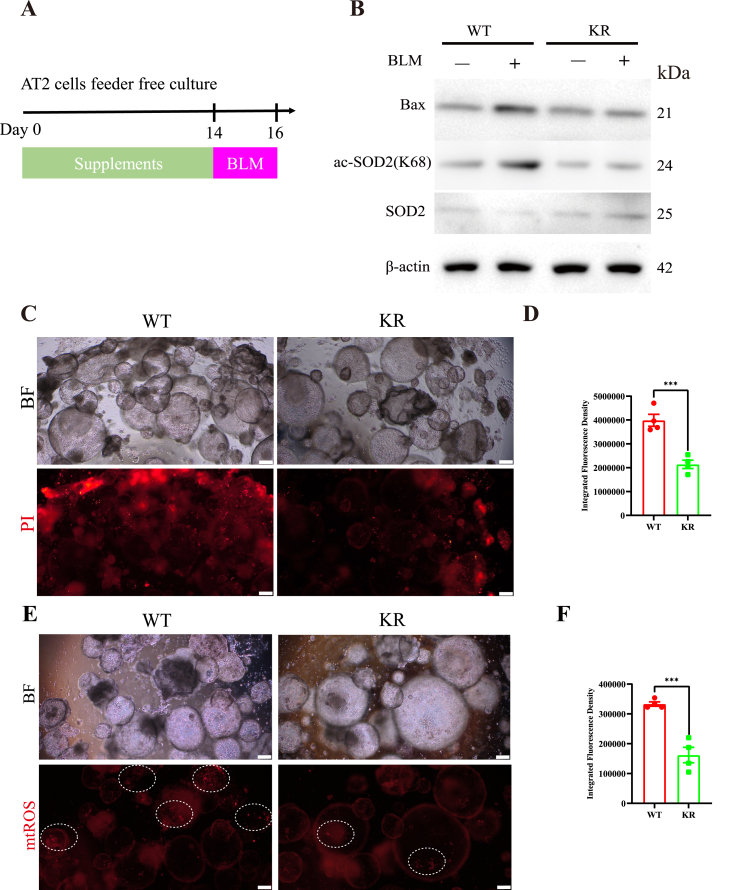
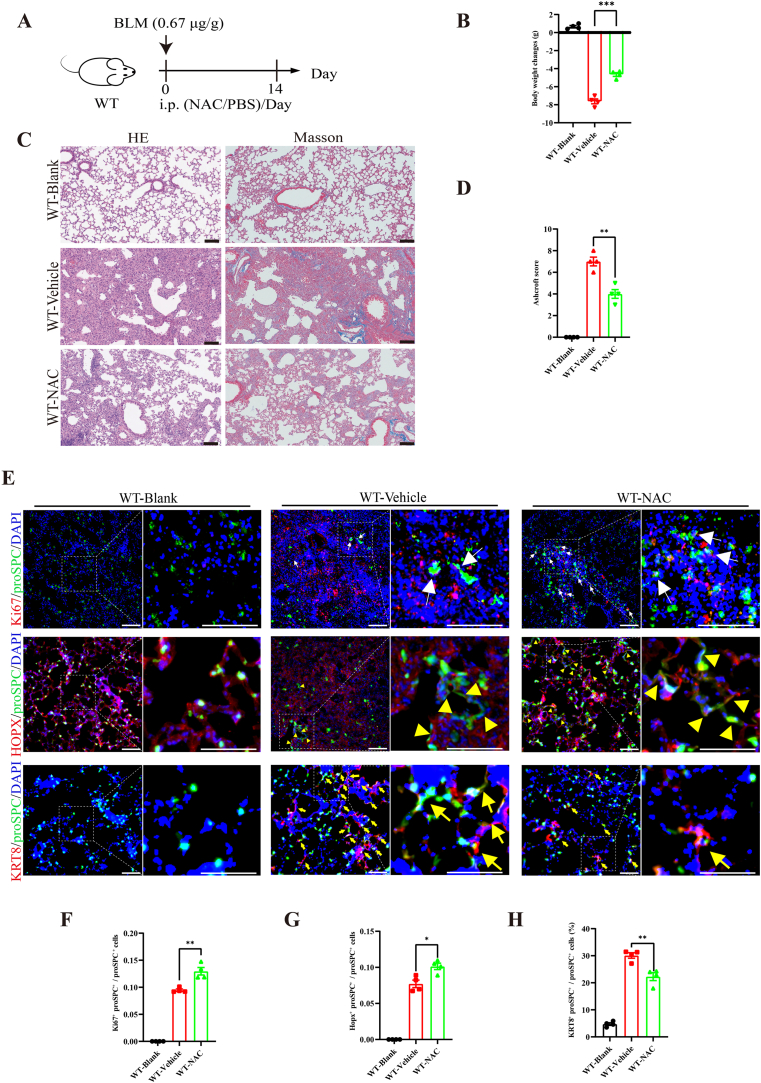
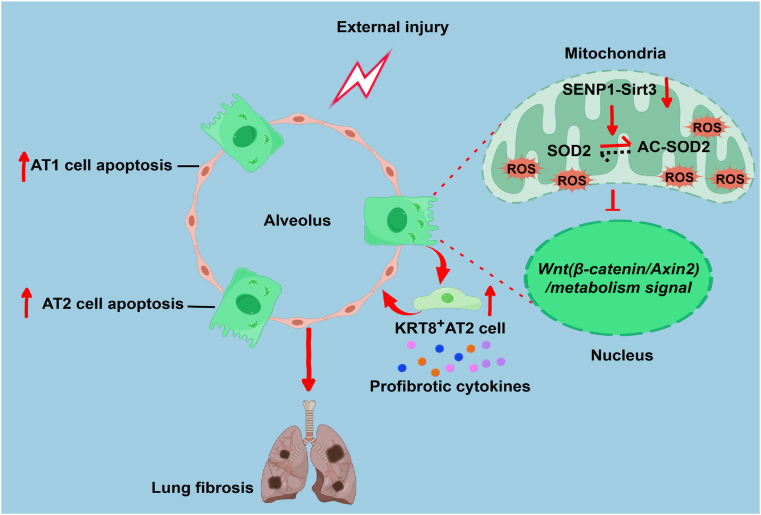
Oxidative damage exacerbates pulmonary fibrosis by impairing alveolar type II epithelial (AT2) cell function. This study demonstrates that the SUMO-specific protease 1 (SENP1)-Sirtuin 3 (Sirt3) axis, critical for mitochondrial redox regulation, is suppressed in AT2 cells during lung injury. In bleomycin-induced pulmonary fibrosis models, activating the SENP1-Sirt3 axis via Sirt3 SUMOylation site mutation (Sirt3 K223R) reduced Superoxide Dismutase 2 (SOD2) acetylation, thereby lowering mitochondrial reactive oxygen species (mtROS) accumulation and apoptosis. This intervention increased AT2 cell proliferation and differentiation into alveolar type I cells while reducing Keratin 8 (KRT8)+ transitional cell number, a profibrotic population. Additionally, SENP1-Sirt3 activation attenuated inflammation and fibrosis in lung tissue. Transcriptomic analysis linked the axis to enhanced Wnt signaling and lipid metabolism pathways, promoting AT2 stemness. Antioxidant N-acetylcysteine (NAC) supplementation mirrored these benefits, reinforcing ROS clearance as a therapeutic mechanism. These findings highlight SENP1-Sirt3 as a pivotal regulator of AT2 resilience, offering a potential strategy to mitigate fibrosis by targeting mitochondrial oxidative stress and cellular plasticity.

Keywords: AT2 cell; Lung fibrosis; Mitochondria; Oxidative damage; SENP1-Sirt3 axis.


Conflict of interest statement

Declaration of competing interest The authors declare the following financial interests/personal relationships which may be considered as potential competing interests: Jinke Cheng reports financial support was provided by the National Key Research and Development Program of China. Jinke Cheng reports financial support was provided by National Natural Science Foundation of China. Tianshi Wang reports financial support was provided by National Natural Science Foundation of China. If there are other authors, they declare that they have no known competing financial interests or personal relationships that could have appeared to influence the work reported in this paper.

Figures

Fig. 1
Fig. 1
BLM-induced pulmonary injury leads to downregulation of the SENP1-Sirt3 axis and mitochondrial morphological disruption. (A) Schematic of BLM challenge. (B) Analysis of WT-PBS and WT-BLM mice body weight change, n = 5. (C) Representative images of lung tissues in mice treated with or without BLM with TUNEL staining. Scale bars, 100 μm. (D) Statistical analysis of TUNEL staining positive cells, each data point represents in an individual mouse (n = 5/group). (E) Representative images of lung tissues in mice treated with or without BLM with immunofluorescence (IF) staining. The AT2 cells were stained with Surfactant protein C (proSPC); the nuclei were stained with DAPI. Scale bars, 100 μm. (F) Statistical analysis of proSPC positive cells, each data point represents in an individual mouse (n = 5/group). (G) Western blot was used to detect the changes in SENP1-Sirt3 axis in mitochondrial lysates of A549 cells treated with BLM (10 μM) for 48 h. The Sirt3 SUMOylation was detected with Sirt3 antibody after immunoprecipitation by SUMO1 antibody. Mitochondrial pan-SUMOylation and pan-acetylation was detected by SUMO1 antibody and acetyl-Lysine (AcK) antibody, respectively. (H) Transmission electron microscopy observation of AT2 cell mitochondria with and without BLM challenge, red arrows indicate mitochondria, yellow stars indicate lamellar bodies. Scale bars, 500 nm. (I) Statistical analysis of mitochondrion number of AT2 cells, each data point represents in an individual AT2 cell (n = 15/group). (J) Statistical analysis of the cristae number per mitochondria in AT2 cells, each data point represents in an individual mitochondrion (n = 30/group). (K) Mitochondrial ROS level detected by flow cytometry and labeled with MitoSOX in AT2 cells in mice treated with or without BLM, each data point represents in an individual mouse (n = 4/group). (L) ATP level detected in AT2 cells in mice treated with or without BLM, each data point represents in an individual mouse (n = 4/group). Data are presented as the means ± SEM. ∗∗p < 0.01; ∗∗∗∗p < 0.0001.
Fig. 2
Fig. 2
Sirt3 KR mice reduce BLM-induced pulmonary inflammation and fibrosis. (A) Schematic of BLM challenge. (B) Survival curve (n = 5/group). (C) HE staining of mouse lung tissue sections. Scale bars, 100 μm. (D) Statistical analysis of cell number in BALF, each data point represents in an individual mouse (n = 3/group). (E) Statistical analysis of protein concentration in BALF, each data point represents in an individual mouse (n = 3/group). (F) Giemsa staining of BALF. Scale bars, 100 μm. (G) Masson staining of mouse lung tissue sections. Scale bars, 100 μm. (H) Ashcroft score analysis, each data point represents in an individual mouse (n = 3/group). (I) Western blot was used to detect the protein expression of collagen1 (Colla1) and α-SMA in the lung tissue, each lane represents in an individual mouse (n = 3/group). Data are presented as the means ± SEM. ∗∗p < 0.01.
Fig. 3
Fig. 3
Transcriptome analysis of WT and Sirt3 KR AT2 cells after BLM challenge. (A) Principal component analysis. (B) Heat map of gene expression in each group. (C) Pathways enrichment analysis results of down-regulated differential gene in Sirt3 K223R AT2 cells compared with WT AT2 cells after BLM challenge. (D) Gene Set Enrichment Analysis of down-regulated differential gene in Sirt3 K223R mice compared with Sirt3 WT mice after BLM challenge. (E) Pathways enrichment analysis results of up-regulated differential gene in Sirt3 K223R mice compared with Sirt3 WT mice after BLM challenge. (F) Gene Set Enrichment Analysis of up-regulated differential gene in Sirt3 K223R mice compared with Sirt3 WT mice after BLM challenge.
Fig. 4
Fig. 4
Analysis of the number and function of WT and Sirt3 KR AT2 cells in vivo and in vitro. (A) Representative IF images of detecting the expression of proSPC of mouse lung on day 3 after BLM challenge. Scale bars, 100 μm. (B) Statistical analysis of AT2 cells number, each data point represents in an individual mouse (n = 3/group). (C) Representative IF images of detecting the expression of Ki67 in AT2 cells of mouse lung on day 14 after BLM challenge. Scale bars, 100 μm. Yellow arrows point to AT2 cells that express the proliferation marker Ki67. (D) Statistical analysis of Ki67+ AT2 cells in AT2 cells of mouse lung on day 14 after BLM challenge, each data point represents in an individual mouse (n = 3/group). (E) Representative IF images of detecting the expression of HOPX+ in AT2 cells of mouse lung on day 14 after BLM challenge, yellow arrows point to AT2 cells that express the AT1 cells marker HOPX. Scale bars, 100 μm. (F) Statistical analysis of HOPX+ AT2 cells in AT2 cells of mouse lung on day 14 after BLM challenge, each data point represents in an individual mouse (n = 3/group). (G) Schematic of AT2 cell co-culture with lung fibroblast organoid. (H) Representative results of AT2 cell co-culture with lung fibroblast organoid. Scale bars, 100 μm. (I) Statistical analysis of AT2 cell co-culture with lung fibroblast organoid number, each data point represents in an individual mouse (n = 3/group). (J) qPCR detecting the expression of Sftpc (K) Axin2 (L) Hopx, each data point represents in an individual mouse (n = 3/group). Data are presented as the means ± SEM. ∗p < 0.05; ∗∗p < 0.01; ∗∗∗p < 0.001.
Fig. 5
Fig. 5
Sirt3 KR reduces KRT8+ cells and promotes Wnt signaling. (A) Representative IF images of detecting the expression of KRT8 in AT2 cells of mouse lung on day 7 after BLM challenge. Yellow arrows point to AT2 cells that express KRT8. Scale bars, 100 μm. (B) Statistical analysis of KRT8+ cells in AT2 cells of mouse lung on day 7 after BLM challenge, each data point represents in an individual mouse (n = 4/group). (C) Representative IF images of detecting the expression of Axin2 in AT2 cells of mouse lung on day 7 after BLM challenge, yellow circles indicate AT2 cells that express Axin2. Scale bars, 100 μm. (D) Statistical analysis of KRT8+ cells in AT2 cells of mouse lung on day 7 after BLM challenge, each data point represents in an individual mouse (n = 3/group). (E) Schematic diagram of the experiment. (F) Western blot was used to detect the protein expression of β-catenin and Axin2 in AT2 cells after BLM challenge. Data are presented as the means ± SEM. ∗∗p < 0.01.
Fig. 6
Fig. 6
Sirt3 KR alleviates mitochondrial ROS level in AT2 cells. (A) Schematic of feeder free organoids treated with BLM. (B) Western blot was used to detect the protein expression of Bax, SOD2 and ac-SOD2 (K68) in AT2 cells feeder free organoids after BLM challenge. (C) PI staining of AT2 cells feeder free organoids after BLM challenge. Scale bars, 200 μm. (D) Statistical analysis of PI staining fluorescence intensity, each data point represents in an individual mouse (n = 4/group). (E) mtROS staining of AT2 cells feeder free organoids after BLM challenge. Dashed circles indicate mtROS stained by mitoSOX Red. Scale bars, 200 μm. (F) Statistical analysis of mtROS staining fluorescence intensity, each data point represents in an individual mouse (n = 4/group). Data are presented as the means ± SEM. ∗∗∗p < 0.001.
Fig. 7
Fig. 7
NAC treatment promotes AT2 cells proliferation and differentiation. (A) Schematic of experiment, each mouse received 100 μL of NAC/PBS solution at a concentration of 60 mg/μL via intraperitoneal injection. (B) Analysis of body weight change in mice, each data point represents in an individual mouse (n = 4/group). (C) HE & Masson staining of mouse lung tissue sections after BLM challenge. Scale bars, 100 μm. (D) Ashcroft score, each data point represents in an individual mouse (n = 4/group). (E) Representative IF images showing that NAC supplementation promoted the proliferation and differentiation of AT2 cells (day 14 lung tissue sections after BLM challenge) and reduced the production of KRT8+AT2 cells (day 7 lung tissue sections after BLM challenge). White arrows point to AT2 cells that express the proliferation marker Ki67. Yellow arrowheads point to AT2 cells that express the AT1 cells marker HOPX. Yellow arrows point to AT2 cells that express KRT8. Scale bars, 100 μm. (F) The proportion of Ki67-expressing AT2 cells in each group was statistically analyzed, each data point represents in an individual mouse (n = 4/group). (G) The proportion of HOPX+AT2 cells in each group was statistically analyzed, each data point represents in an individual mouse (n = 4/group). (H) The proportion of KRT8+AT2 cells in each group was statistically analyzed, each data point represents in an individual mouse (n = 4/group). Data are presented as the means ± SEM. ∗p < 0.05; ∗∗p < 0.01; ∗∗∗p < 0.001.
Fig. 8
Fig. 8
Activation of the SENP1-Sirt3 axis protects against pulmonary oxidative damage by regulating the activity of AT2 cells. External injury stimuli trigger apoptosis in alveolar epithelial cells, compromising alveolar structural integrity. Within AT2 cell mitochondria, reduced activity of the SENP1-Sirt3 axis leads to increased acetylation of SOD2. This promotes the accumulation of mtROS, impairs AT2 cell function, and reduces Wnt signaling and metabolic activity. Consequently, more differentiation-arrested KRT8+ transitional AT2 cells are generated. These cells release pro-fibrotic cytokines, ultimately inducing the development of pulmonary fibrosis.

Similar articles

References

    1. Barkauskas C.E., Cronce M.J., Rackley C.R., Bowie E.J., Keene D.R., Stripp B.R., Randell S.H., Noble P.W., Hogan B.L. Type 2 alveolar cells are stem cells in adult lung. J. Clin. Investig. 2013;123:3025–3036. - PMC - PubMed
    1. Wu H., Yu Y., Huang H., Hu Y., Fu S., Wang Z., Shi M., Zhao X., Yuan J., Li J., Yang X., Bin E., Wei D., Zhang H., Zhang J., Yang C., Cai T., Dai H., Chen J., Tang N. Progressive pulmonary fibrosis is caused by elevated mechanical tension on alveolar stem cells. Cell. 2020;180:107–121 e117. - PubMed
    1. Desai T.J., Brownfield D.G., Krasnow M.A. Alveolar progenitor and stem cells in lung development, renewal and cancer. Nature. 2014;507:190–194. - PMC - PubMed
    1. Strunz M., Simon L.M., Ansari M., Kathiriya J.J., Angelidis I., Mayr C.H., Tsidiridis G., Lange M., Mattner L.F., Yee M., Ogar P., Sengupta A., Kukhtevich I., Schneider R., Zhao Z., Voss C., Stoeger T., Neumann J.H.L., Hilgendorff A., Behr J., O'Reilly M., Lehmann M., Burgstaller G., Konigshoff M., Chapman H.A., Theis F.J., Schiller H.B. Alveolar regeneration through a Krt8+ transitional stem cell state that persists in human lung fibrosis. Nat. Commun. 2020;11:3559. - PMC - PubMed
    1. Enomoto Y., Katsura H., Fujimura T., Ogata A., Baba S., Yamaoka A., Kihara M., Abe T., Nishimura O., Kadota M., Hazama D., Tanaka Y., Maniwa Y., Nagano T., Morimoto M. Autocrine TGF-beta-positive feedback in profibrotic AT2-lineage cells plays a crucial role in non-inflammatory lung fibrogenesis. Nat. Commun. 2023;14:4956. - PMC - PubMed

LinkOut - more resources