. 2025 Sep;645(8079):228-234.
doi: 10.1038/s41586-025-09340-0. Epub 2025 Jul 9.

Feline infectious peritonitis epizootic caused by a recombinant coronavirus

Affiliations

Feline infectious peritonitis epizootic caused by a recombinant coronavirus

Charalampos Attipa et al. Nature. 2025 Sep.

Abstract

Cross-species transmission of coronaviruses (CoVs) poses a serious threat to both animal and human health1-3. While the large RNA genome of CoVs shows relatively low mutation rates, recombination within genera is frequently observed4-7. Companion animals are often overlooked in the transmission cycle of viral diseases; however, the close relationship of feline (FCoV) and canine CoV (CCoV) to human hCoV-229E5,8, as well as the susceptibility of these animals to SARS-CoV-29, highlight their importance in potential transmission cycles. While recombination between CCoV and FCoV of a large fragment spanning orf1b to M has been previously described5,10, here we report the emergence of a highly pathogenic FCoV-CCoV recombinant responsible for a rapidly spreading outbreak of feline infectious peritonitis (FIP) originating in Cyprus11. The minor recombinant region, spanning spike (S), shows 96.5% sequence identity to the pantropic canine coronavirus NA/09. Infection has rapidly spread, infecting cats of all ages. Development of FIP appears to be very frequent and sequence identities of samples from cats in different districts of the island are strongly supportive of direct transmission. A near-cat-specific deletion in the domain 0 of S is present in more than 90% of cats with FIP. It is unclear as yet whether this deletion is directly associated with disease development, and it may be linked to a biotype switch12. The domain 0 deletion and several amino acid changes in S, particularly the receptor-binding domain, indicate potential changes to receptor binding and cell tropism.


Conflict of interest statement

Competing interests: Laboklin is a veterinary laboratory offering diagnostic services, including bacteriological and molecular biological examinations. Vet Dia Gnosis offers veterinary pathology diagnostic services only. M.G. is employed by Laboklin. C.A. and S.L. are the co-founders of Vet Dia Gnosis. C.A. is an external collaborator of Vet Dia Gnosis and S.L. and A.Z. are employed by Vet Dia Gnosis.

Figures

Fig. 1
Fig. 1. Epidemiology and pathology of the FIP outbreak in Cyprus, January 2023 to June 2024.
a, The distribution of RT–qPCR or IHC-confirmed FIP cases across Cyprus. The first image shows Cyprus within the Eastern Mediterranean. The darker colours indicate higher numbers of confirmed cases over time within each district as highlighted in the overview heat map with key. The maps were generated using mapchart.net. n = 215. b, RT–qPCR/IHC-confirmed case rates resolved by time and province. A 6 knot spline interpolation highlights the three waves observed to date. c, Clinical presentation of cats with FIP due to FCoV-23. Left, a cat with the effusive form of FIP showing abdominal distention due to peritoneal effusion, an unkept coat, low body-condition score and poor muscle condition. Right, a cat presenting with jaundice evidenced by yellow/orange discoloration of the mucous membranes and mucocutaneous junctions. Images courtesy of E. Georgiadi. d, Representative peritoneal effusion smear photomicrograph from one Cypriot cat with confirmed FIP due to FCoV-23 infection. Non-degenerative neutrophils are present on a protein-rich background shown using a modified Wright’s stain. Scale bar, 20 µm. e, Representative photomicrographs showing a section of colonic mucosa and submucosa from one cat with confirmed FIP due to FCoV-23 infection. Top, haematoxylin and eosin (H&E)-stained histology section showing coalescing infiltration of predominantly the submucosa by aggregates of primarily neutrophils and macrophages surrounded by fewer lymphocytes and plasma cells. The muscularis mucosae is disrupted by the inflammation. Bottom, IHC staining against FCoV in a histology section mirroring the above section. There is extensive positive FCoV cytoplasmic staining for cells at the centre of each aggregate/pyogranuloma in cells with macrophage-like morphology. Scale bars, 250 µm.
Fig. 2
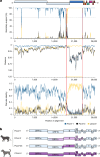
Fig. 2. Genomic sequence analysis of Cypriot and UK-import FCoV cases.
Sequences from three different genomic regions (orf1b, S and orf3c/E/M), as indicated by the grey regions marked on the overview of the genome, were obtained through Nanopore sequencing of 45, 63 and 42 Cypriot and UK-import samples, respectively. After initial BLAST analysis, maximum-likelihood trees were generated including other FCoV and CCoV strains to assess the genetic similarity of each region. CCoV-2 genomes are highlighted in blue with pCCoV-2 genomes within this region displayed in a darker blue. FCoV-1 genomes are highlighted in pink and FCoV-2 genomes are shown in purple. Samples from Cyprus (green) and one UK-imported Cypriot cat (dark green) can be seen clustered with FCoV-1 sequences in the orf1b and orf3c/E/M regions. However, the S gene clusters with CCoV-2, most closely with pCCoV-2. Different numbers of sequences are present in each tree due to missing sequence or poor sequence quality and/or alignments in genomes downloaded from NCBI, and due to not all regions being sequenced in all individuals from our samples. Silhouettes representing cats, dogs and foxes were created using BioRender.
Fig. 3
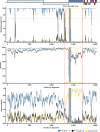
Fig. 3. Recombination analysis.
a, Visualizations of a recombination analysis carried out on the assembled FCoV-23 genome 2-C11 Re 10276 (PQ133182) and representative genomes of FCoV-1 (blue), FCoV-2 (black) and pCCoV (yellow). The section highlighted in yellow shows the likely recombination break region, with a red vertical line showing the likely breakpoint. The first panel shows the results of the bootscan analysis; the second panel shows the sequence distance; and the third panel shows the RDP pairwise identity analysis. All three panels show good support for the recombination between FCoV-1 and pCCoV. These results are further supported by a high statistical likelihood of recombination shown in Supplementary Table 21. Recombination analysis of a representative ΔD0 FCoV-23 is shown in Extended Data Figs. 3 and 4. b, Schematic of the major recombinations observed in FCoV and CCoV. A common-ancestral-origin virus is thought to have given rise to the original FCoV-1 and CCoV-1 types with further evolution in CCoVs yielding CCoV-2 and CCoV-1/2 serotypes. FCoVs are thought to have recombined with CCoV-2 to form FCoV-2. FCoV-2 and CCoV-2 recombinations have been shown to have different recombination points as highlighted by the different colorations (reviewed previously). The Cypriot FCoV strain, termed FCoV-23, is a recombinant between an FCoV-1 strain and a S recombination with a pantropic CCoV-2, pCCoV. Furthermore, deletion variants are observed in the majority of sequenced cases (white box; Fig. 4). The diagram in b was created using BioRender.
Fig. 4
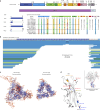
Fig. 4. Protein sequence and structural analysis of FCoV-23 spike.
a, Analysis of the different domains of FCoV-23 S. D0 shows high similarity to CB/05 pCCoV with a prominent, variable deletion between amino acids (AA) 11–265 resembling the deletion previously observed in TGEV and PRCV S. Multisequence alignment mirroring sequences used for computational analysis previously is shown. Amino acids with side-chain type changes against FCoV-2s, and changes at position 546, where a leucine is more predominant in the FIPV rather than the FECV sequences, are shown. Colours were assigned according to the RasMol amino acid scheme. Amino acid changes that could potentially be associated with biotype change are highlighted in bold. The schematic of spike was created using BioRender. b, D0 S deletions in 57 cats (8 full length) are shown from the beginning of S to amino acid 267. Sequences are ordered by the shortest N-terminal sequence. Identical deletions are highlighted in shades of green. All deletions are in-frame. c, Structural modelling of the full-length or long S version, represented by sample G8, and the ΔD0 or short version, represented by sample C10. The samples were modelled against CCoV-HuPN-2018, experimentally determined S in the swung-out confirmation 7usa.1.A. The proximal confirmation and comparisons are shown in Extended Data Fig. 8. Colours indicate the confidence, with blue highlighting strong and red highlighting weak confidence. d, Modelling of amino acid changes on a structural prediction of the FCoV-23 RBD against CCoV-HuPN-2018 7u8I.1.B. Side-chain type amino acid changes as identified in a are highlighted; side chains are shown in blue for variations in FCoV-2s that are distant from the RBD, red for variations that are close to the RBD, orange for the variations at amino acid 546, similar to FIPV-2, and olive for variation differing both from FCoV-2 and pCCoV. A comparison showing a confidence model of the FCoV-23 RBD structure prediction paired with the CCoV-HuPN-2018-canine aminopeptidase N (APN) is shown for orientation and binding visualization at the top right.
Extended Data Fig. 1
Extended Data Fig. 1. Relationship to other pCCoV viruses.
Maximum likelihood tree of pantropic CCoV spikes (~450 bp region). Alignments were done with Muscle in MEGA7, and maximum likelihood tree was made in MEGA7 with default settings. Tree was visualized in iTOL. Extended Data Fig. 1 shows a maximum likelihood tree generated from the alignment of known pCCoV spike amplicons with the non-deletion form of the FCoV-23 amplicon. The alignment was carried out with Muscle in MEGA7 and the maximum likelihood tree was generated with MEGA7 on default settings. The tree was visualized with iTOL. The region targeted is ~450 bp with longer sequences trimmed down. The FCoV-23 spike with the deletion could not be used as the deleted region heavily overlaps with the region in the alignment. The FCoV-23 amplicon clusters among the pCCoV sequences.
Extended Data Fig. 2
Maximum likelihood tree of FCoV-23 with other alphacoronavirus 1 full genome sequences.
Extended Data Fig. 3
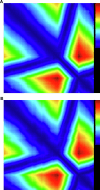
Extended Data Fig. 3. MaxChi breakpoint matrix from RDP5 analysis for A) spike full-lenth FCoV-23 genome 2-C11 Re 10276 and B) domain 0-deletion FCoV-23 genome 2-F12 BW 11350.
MaxChi breakpoint matrix generated with default settings in RDP5. Extended Data Fig. 3 shows the MaxChi7 breakpoint matrix generated in RDP58. The dark red region highlights the likely recombination breakpoints, which align with the breakpoints described in the main text.
Extended Data Fig. 4
Extended Data Fig. 4. Recombination analysis of domain 0-deletion FCoV-23 genome 2-F12 BW 11350.
A) Visualizations of a recombination analysis carried out on the assembled FCoV-23 genome and representative genomes of FCoV-1 (blue), FCoV-2 (black) and pCCoV (yellow). The yellow panel shows the likely recombination break region, with a red vertical line showing the likely break point. The first panel shows the results of the Bootscan analysis, the second panel shows the sequence distance, and the third panel shows the RDP pairwise identity analysis. All three panels show good support for the recombination between FCoV-1 and pCCoV. These results are further supported by high statistical likelihood of recombination shown in Supplementary Table 22.
Extended Data Fig. 5
Extended Data Fig. 5. Protein structure modelling.
Structural modelling of A) G8 full-length and B) C10 domain 0 deletion (short) spike using the 7us6.1.A proximal confirmation ofCCoV-HuPN-2018 as a template. C&D) Comparison between the G8 full-length and the C10 domain 0 deletion (short) spike structure prediction. C) represents the swung out (modelled against the 7usa.1.A template) and D) the proximal confirmation (modelled against the 7us6.1.A template). Colors represent consistency with red being inconsistent and green consistent between the two structures.
Extended Data Fig. 6
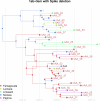
Extended Data Fig. 6. Bayesian time-resolved phylogenetic trees for orf1ab and orf3-E-M with annotation of correlated spike D0 deletion lengths.
Origin of the virus sample in Cyprus are given different colors as indicated in the legend. Sequences of the FCoV “backbone” orf1ab and orf3-E-M regions fall somewhat into regional clades, with the inferred epidemic origin in Nicosia, and subsequent transmissions into most other regions (Famagousta, Larnaca, and Limassol), although transmissions into Paphos are inferred to come from Famagousa. The tips are labelled according to how many amino acids remain in affected genomic region of spike, these range from nAA_24 (24 amino acids) to Full (270 amino acids). Orf1ab+3em sequences with unknown spike length are denoted with “?”. The number of amino acids remaining does not appear to show an evolutionary pattern, for example the figure does not show that the number of amino acids decreases over time within a clade. Instead, the figure shows a more random pattern of spike deletions, which would be indicative of individually occurring within-host processes, such as in-cat recombination.
Extended Data Fig. 7
Extended Data Fig. 7. Sequence identity/divergence of FCoV-23 full genome sequences.
The number of base substitutions/identical bases per site from between sequences are shown. Analyses were conducted using the Maximum Composite Likelihood model using 20 full-genome FCoV-23 sequences using 29,144 base positions. All Codon positions (1/2/3 + NC) were included. Ambiguous positions were removed using the pairwise deletion option. Evolutionary analyses were conducted in MEGA X and are displayed (bottom) with or without sequences H9 and E8, which display poorer sequence quality (lower coverage and bigger gaps) and should be treated with caution.
Extended Data Fig. 8
Extended Data Fig. 8. Clustal W whole genome alignment.
10 gap-free FCoV-23 genome sequences were multi-genome aligned using ClustalW with JN183883 (closest FCoV-2, UU54), KP981644 (pantropic CCoV CB/05), and MW591993 (CCoV-HuPn-2018) for context.

References

    1. Olival, K. J. et al. Host and viral traits predict zoonotic spillover from mammals. Nature546, 646–650 (2017). - PMC - PubMed
    1. Zhou, P. et al. Fatal swine acute diarrhoea syndrome caused by an HKU2-related coronavirus of bat origin. Nature556, 255–258 (2018). - PMC - PubMed
    1. Nova, N. Cross-species transmission of coronaviruses in humans and domestic mammals, what are the ecological mechanisms driving transmission, spillover, and disease emergence? Front. Publ. Health9, 717941 (2021). - PMC - PubMed
    1. Muller, N. F., Kistler, K. E. & Bedford, T. A Bayesian approach to infer recombination patterns in coronaviruses. Nat. Commun.13, 4186 (2022). - PMC - PubMed
    1. Herrewegh, A. A., Smeenk, I., Horzinek, M. C., Rottier, P. J. & de Groot, R. J. Feline coronavirus type II strains 79-1683 and 79-1146 originate from a double recombination between feline coronavirus type I and canine coronavirus. J. Virol.72, 4508–4514 (1998). - PMC - PubMed

MeSH terms

Substances

LinkOut - more resources