. 2025 Jul 9;16(1):6328.
doi: 10.1038/s41467-025-61443-4.

Early-life exercise extends healthspan but not lifespan in mice

Affiliations

Early-life exercise extends healthspan but not lifespan in mice

Mengya Feng et al. Nat Commun. .

Abstract

It is well-known that physical activity exerts health benefits, yet the potential impacts of early-life regular exercise on later-life health and lifespan remains poorly understood. Here, we demonstrate that 3 months of early-life exercise in mice results in lasting health benefits, extending healthspan, but not lifespan. C57BL/6J mice underwent swimming exercise from 1 to 4 months of age, followed by detraining for the remainder of their lives. While early-life exercise did not extend the overall lifespan, it significantly improved healthspan in both male and female mice, as evidenced by enhanced systemic metabolism, cardiovascular function, and muscle strength, as well as reduced systemic inflammation and frailty in aged mice. Multiple-organ transcriptome analyses identified enhanced fatty acid metabolism in skeletal muscles as a major feature in aged mice that underwent early-life exercise. These findings reveal the enduring long-term health benefits of early-life exercise, highlighting its pivotal role in improving healthspan.


Conflict of interest statement

Competing interests: The authors declare no competing interests.

Figures

Fig. 1
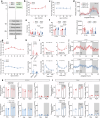
Fig. 1. Early-life exercise does not extend lifespan in mice.
a Experimental timeline. Mice were subjected to sedentary or swimming exercise at 1 to 4 months of age and then reared without exercise training in the rest of the life. b and c Body weight over the indicated age in female (b) and male (c) mice. n = 14, 29, 28, 20, 20, 28, 19, and 4 for 1, 4, 9, 14, 19, 24, 29, and 34 months of ages for sedentary mice in (b) respectively. n = 16, 40, 38, 15, 20, 29, 24, and 11 for 1, 4, 9, 14, 19, 24, 29, and 34 months of ages for exercise mice in (b) respectively. n = 20, 37, 19, 15, 32, 16, 7, and 0 for 1, 4, 9, 14, 19, 24, 29, and 34 months of ages for sedentary mice in (c) respectively. n = 20, 49, 29, 29, 30, 16, 11 and 4 for 1, 4, 9, 14, 19, 24, 29, and 34 months of ages for exercise mice in (c) respectively. d and e Survival curves of female (d) and male (e) mice. Data are presented as mean ± SEM. Data are analyzed by two-tailed unpaired Student’s t test (b and c) and the overall survival was tested by Tarone-Ware test (d and e).
Fig. 2
Fig. 2. Early-life exercise increases lean mass and decreases circulating insulin in aged mice.
a Experimental timeline. b and c Food intake over the indicated ages in female (b) and male (c) mice. n = 9, 9, 8, 8, and 4 for 4, 11, 18, 25, and 32 months of ages for sedentary mice in (b) respectively. n = 10, 12, 8, 8, and 7 for 4, 11, 18, 25, and 32 months of ages for exercise mice in (b) respectively. n = 11, 11, 8, 6, and 0 for 4, 11, 18, 25, and 32 months of ages for sedentary mice in (c) respectively. n = 11, 11, 9, 8, and 3 for 4, 11, 18, 25, and 32 months of ages for exercise mice in (c) respectively. d Voluntary physical activity within one day at 20-month age (up) and voluntary physical activity per day over the indicated ages (down, 14 mo, SED female n = 12, EXE female n = 19, SED male n = 15, EXE male n = 32; 20 mo, SED female n = 8, EXE female n = 11, SED male n = 8, EXE male n = 16). e and f Absolute fat mass (e) and lean mass (f) over the indicated ages (14 mo, SED female n = 15, EXE female n = 15, SED male n = 13, EXE male n = 14; 24 mo, SED female n = 9, EXE female n = 9, SED male n = 10, EXE male n = 10). g–i Fasting blood glucose (g, up, n = 25, 16, 16, 23, 21, 13, and 0 for 4, 9, 14, 19, 24, 29, and 34 months of ages for sedentary female mice in (g) respectively. n = 25, 20, 15, 19, 19, 19, and 6 for 4, 9, 14, 19, 24, 29, and 34 months of ages for exercise female mice in (g) respectively. down, n = 45, 18, 15, 16, 13, 3, and 0 for 4, 9, 14, 19, 24, 29, and 34 months of ages for sedentary male mice in (g) respectively. n = 49, 30, 28, 25, 17, 10, and 1 for 4, 9, 14, 19, 24, 29, and 34 months of ages for exercise male mice in (g) respectively.), serum insulin (h, up, n = 9 per group; down, SED n = 8, EXE n = 11), glucose tolerance, and insulin tolerance (i) in female and male mice. j Energy expenditure normalized to body mass within 48 h under feeding or fasting condition in mice at 24-month age. k Quantified exergy expenditure, carbohydrate oxidation, and fat oxidation under feeding condition. l Quantified exergy expenditure, carbohydrate oxidation, and fat oxidation under fasting condition. Data are presented as mean ± SEM. Data are analyzed using unpaired, two-tailed Student’s t test (h) and two-way ANOVA with Šídák’s multiple comparisons test (e and f, l).
Fig. 3
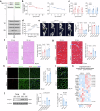
Fig. 3. Early-life exercise attenuates cardiovascular aging in aged mice.
a Experimental timeline. b Systolic blood pressure (SBP) over the indicated ages in female and male mice (up, n = 10, 8 and 10 for 5, 19 and 26 months of ages for sedentary female mice in (b) respectively. n = 10, 8 and 10 for 5, 19 and 26 months of ages for exercise female mice in (b) respectively. down, n = 10, 8 and 10 for 5, 19 and 26 months of ages for sedentary male mice in (b) respectively. n = 10, 8, and 10 for 5, 19, and 26 months of ages for exercise male mice in (b) respectively). c Cardiac systolic function over the indicated ages in female and male mice (up, n = 8, 10, 11, and 8 for 5, 20, 24, and 28 months of ages for sedentary female mice in (c) respectively. n = 7, 10, 10, and 8 for 5, 20, 24, and 28 months of ages for exercise female mice in (c) respectively. down, n = 8, 10, 8, and 2 for 5, 20, 24, and 28 months of ages for sedentary male mice in (c) respectively. n = 8, 8, 8, and 4 for 5, 20, 24, and 28 months of ages for exercise male mice in (c) respectively). d Cardiac diastolic function in male mice at the age of 19 months (n = 8). e Heart weight/body weight over the indicated age (SED female n = 6, EXE female n = 7, SED male n = 6, EXE male n = 6). f Cardiac fibrosis stained by Masson at 25-month age for female mice (n = 6) and 24-month age for male mice (n = 6). g Heart-carotid pulse wave velocity (hcPWV) in mice at 19-month age (female, n = 6 per group; male, n = 10 per group). h Common carotid artery (CCA) diameter in mice at 19-month age (SED female n = 6, EXE female n = 6, SED male n = 7, EXE male n = 10). i and j H&E-stained thoracic aorta sections in female (25-month-old) (i) and male (24-month-old) (j) mice. k and l Acetylcholine (ACh)- and sodium nitroprusside (SNP)-induced vasodilation in isolated thoracic aortas in female (k, SED n = 7, EXE n = 6) and male (l, n = 7 per group) mice. m Immunofluorescence of CD31 and α-smooth muscle actin (α-SMA) in thoracic aorta sections in female and male mice (n = 6). Endothelium integrity was quantified. Data are presented as mean ± SEM. Data are analyzed using unpaired, two-tailed Student’s t test (d, f and g) and two-way ANOVA with Šídák’s multiple comparisons test (k and l).
Fig. 4
Fig. 4. Early-life exercise improves musculoskeletal health in aging.
a Experimental timeline. b Grip strength over the indicated ages in female and male mice (left, n = 25, 15, 8, 22, and 19 for 5, 11, 17, 23, and 29 months of ages for sedentary female mice in (b) respectively. n = 25, 15, 8, 25, and 24 for 5, 11, 17, 23, and 29 months of ages for exercise female mice in (b) respectively. right, n = 25, 15, 8, 25, and 3 for 5, 11, 17, 23, and 29 months of ages for sedentary male mice in (b) respectively. n = 25, 15, 8, 25, and 7 for 5, 11, 17, 23, and 29 months of ages for exercise male mice in (b) respectively.). c Motor coordination over the indicated ages (left, n = 9, 10, and 9 for 5, 11, and 24 months of ages for sedentary female mice in (c) respectively. n = 10, 10, and 8 for 5, 11, and 24 months of ages for exercise female mice in (c) respectively. right, n = 10, 10, and 13 for 5, 11, and 24 months of ages for sedentary male mice in (c) respectively. n = 10, 10 and 15 for 5, 11, and 24 months of ages for exercise male mice in (c) respectively). d Tetanic force-frequency relationships of tibialis anterior muscles from male mice at the ages of 16 months (n = 6). e Kyphosis index (SED female n = 5, EXE female n = 6, SED male n = 6, EXE male n = 8) and bone mineral density (BMD) in aged mice (SED female n = 5, EXE female n = 5, SED male n = 3, EXE male n = 4). f H&E-stained gastrocnemius muscle sections and quantified myofiber cross-section area (CSA) at the indicated age (n = 6). g Masson-stained gastrocnemius muscle sections and quantified fibrosis (n = 6). The collagen volume fraction (%) was calculated as the ratio of collagen volume to fiber volume. h CD31 immunofluorescence in gastrocnemius muscle sections from aged male mice (n = 6). i CD11b immunofluorescences in the gastrocnemius muscle from aged mice (n = 5). Arrows indicated CD11b-positive cells. j Atrogin 1 contents in gastrocnemius muscles from young and aged mice (Young, 4 mo; old, 18 mo; n = 6). k Expressions of genes encoding exerkines in gastrocnemius muscles from aged male mice. n = 4. Data are presented as mean ± SEM. Data are analyzed using unpaired, two-tailed Student’s t test (ei, k), one-way ANOVA with Tukey’s multiple comparisons test (j) and two-way ANOVA with Šídák’s multiple comparisons test (d).
Fig. 5
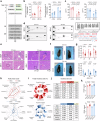
Fig. 5. Early-life exercise decreases frailty and inflammation in aging.
a Experimental timeline. b Fraction of granulocytes among circulating leukocytes in young and aged mice (n = 10). c Percentage of lymphocytes among circulating leukocytes in young and aged mice (n = 10). d Cytokine array of serum from old male and female mice (n = 3, *P < 0.05). Typical images and heatmap of quantified serum cytokines were shown. e Representative images of H&E-stained liver sections from aged mice (n = 6). Perivascular and perinecrotic immune cell infiltrates were enlarged in boxed areas. f Typical mice photos at 24-25 months old. g Frailty indexes over the indicated ages (up, n = 23, 19, and 17 for 24, 26, and 28 months of ages for sedentary female mice in (g), respectively. n = 29, 24, and 19 for 24, 26, and 28 months of ages for exercise female mice in (g), respectively. down, n = 20, 15, and 8 for 24, 26, and 28 months of ages for sedentary male mice in (g), respectively. n=29, 18, and 13 for 24, 26, and 28 months of age for exercise male mice in (g), respectively). h Average frailty index score in different types of frailty phenotypes in mice at the age of 26 months (SED female n = 19, EXE female n = 24, SED male n = 15, EXE male n = 18; *P < 0.05, **P < 0.01). i Incidence of frailty phenotypes in mice at the age of 26 months (SED female n = 19, EXE female n = 24, SED male n = 15, EXE male n = 18; *P < 0.05, **P < 0.01). j Tumor burden in mice that died of natural causes. Presence of apparent neoplastic lesions at the time of sacrifice was recorded. k Early-life exercise extended the healthspan of mice as evaluated by FAMY and GRAIL (SED female n = 18, EXE female n = 24, SED male n = 15, EXE male n = 18). Data are presented as mean ± SEM. Data are analyzed using unpaired, two-tailed Student’s test (d and h), Chi-square test (i and j), one-way ANOVA with Tukey’s multiple comparisons test (k) and two-way ANOVA with Šídák’s multiple comparisons test (b, c and g).
Fig. 6
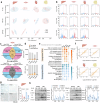
Fig. 6. mRNA sequencing reveals an attenuated aging by early-life exercise.
a PCA analyses of the transcriptome data of the liver, gastrocnemius muscle, heart, and eWAT from 4-month-old, 18-month-old, and 24-month-old male mice. n = 3 for heart of 18 mo SED and EXE, others n = 4. b Volcano plot for differently expressed genes (DEGs) (EXE vs. SED) in different tissues from mice over the indicated ages. Red denotes upregulated genes; blue denotes downregulated genes. c Venn diagrams showing the overlapped DEGs between Aging DEGs and Exercise DEGs in skeletal muscles based on RNA-seq data from 4 mo (Young) and 18 mo (Old) mice. Aging DEGs is defined as Old-SED vs. Young-SED and Exercise DEGs is defined as Old-EXE vs. Old-SED. If a DEG was increased in aging, but decreased between early-life exercise group, it belongs to “Rev-aging DEGs” group. If changed in the same manner, the gene belongs to “Pro-aging DEGs” group. d Bar plots showing the ratio (up) and number (down) of Rev-aging, Pro-aging and Aging-specific DEGs in different tissues based on RNA-seq data from 4 and 18 mo mice. Aging DEGs excluding Rev-aging and Pro-aging DEGs are defined as Aging-specific DEGs. e Heatmaps showing the enriched GO pathways for upregulated and downregulated Rev-aging DEGs by early-life exercise among multiple tissues based on RNA-seq data from 4 and 18 mo mice. f Spearman correlation plots comparing changes in DEGs expression between SED and EXE groups based on RNA-seq data from 4 mo and 18 mo mice. g Senescence-associated beta galactosidase staining analysis (SA-β-gal) in liver sections from aged male (18 mo) and female (18 mo) mice (n = 6). h Immunoblotting analyses of senescence biomarkers (p53, p21, and p16) in liver and muscle from young (4 mo) and old (18 mo) mice (n = 6). Data are presented as mean ± SEM. Data are analyzed using hypergeometric test (e), one-way ANOVA with Tukey’s multiple comparisons test (g) and two-way ANOVA with Šídák’s multiple comparisons test (h).
Fig. 7
Fig. 7. Early-life exercise improves fatty acid utilization in skeletal muscles in aging.
a KEGG enrichment analysis identifying the effects of early-life exercise on metabolic pathways in aged mice (18 mo). Size and color of dot indicate number and significance of genes mapped to specific pathways. Significant (p < 0.05) pathways are shown with color. Rich factor refers to the ratio of DEG numbers annotated in this pathway term to all gene numbers annotated in this pathway term. b Gene set enrichment analysis showing relative gene expression involved in lipid and fatty acid metabolic processes in muscle (left) and liver (right) tissues from aged mice based on 18 mo RNA-seq data. c Pathway diagrams involving glycolysis, fatty acid transport, lipolysis, lipogenesis, fatty acid oxidation, TCA cycle and oxidative phosphorylation, showing gene expression changes induced by early-life exercise in muscles and livers from aged mice (18 mo). d Immunoblotting analyses of lipid metabolic proteins and mitochondrial function biomarkers in muscles and livers from young (4 mo) and old (18 mo) male mice (n = 6). FASN, fatty acid synthase; CPT1A/B, carnitine palmitoyltransferase 1A/B; ACADL, acyl-Coenzyme A dehydrogenase, long chain; PGC-1α, PPARγ coactivator-1α. e Representative records of O2 consumption rate and quantified respiration of permeabilized muscle fibers from male mice (16 mo) using octanoylcarntine and malate as substrates. Adenosine diphosphate (ADP) was added to stimulate fatty acid oxidation respiration. To achieve maximal physiological oxidative phosphorylation capacity, succinate was added (n = 3). f Representative records of O2 consumption rate and quantified respiration of permeabilized muscle fibers from male mice (16 mo) using pyruvate as substrates (n = 3). Data are presented as mean ± SEM. Data are analyzed using hypergeometric test (a), permutation test (b) and two-way ANOVA with Šídák’s multiple comparisons test (d and e).
Fig. 8
Fig. 8. Schematic depicting long-term effects of early-life exercise on lifespan and healthspan.
Early-life exercise exerts enduring long-term health benefits, improving healthspan, but not lifespan, in both male and female mice. Enhanced fatty acid metabolism in skeletal muscles is identified as a major feature in aged mice that underwent early-life exercise.

References

    1. WHO. Global status report on physical activity 2022. (World Health Organization, 2022).
    1. Kohl, H. W. et al. The pandemic of physical inactivity: global action for public health. Lancet380, 294–305 (2012). - PubMed
    1. Lee, I. M. et al. Effect of physical inactivity on major non-communicable diseases worldwide: an analysis of burden of disease and life expectancy. Lancet380, 219–229 (2012). - PMC - PubMed
    1. Chow, L. S. et al. Exerkines in health, resilience and disease. Nat. Rev. Endocrinol.18, 273–289 (2022). - PMC - PubMed
    1. Zhang, X. & Gao, F. Exercise improves vascular health: role of mitochondria. Free Radic. Biol. Med177, 347–359 (2021). - PubMed

LinkOut - more resources