. 2025 Jul 9;16(1):6332.
doi: 10.1038/s41467-025-61547-x.

Combining phenomics with transcriptomics reveals cell-type-specific morphological and molecular signatures of the 22q11.2 deletion

Affiliations

Combining phenomics with transcriptomics reveals cell-type-specific morphological and molecular signatures of the 22q11.2 deletion

Matthew Tegtmeyer et al. Nat Commun. .

Abstract

Neuropsychiatric disorders remain difficult to treat due to complex and poorly understood mechanisms. NeuroPainting is a high-content morphological profiling assay based on Cell Painting and optimized for human stem cell-derived neural cell types, including neurons, progenitors, and astrocytes. The assay quantifies over 4000 features of cell structure and organelle organization, generating a dataset suitable for phenotypic screening in neural models. Here, we show that, in studies of the 22q11.2 deletion-a strong genetic risk factor for schizophrenia-we observe cell-type-specific effects, particularly in astrocytes, including mitochondrial disruption, altered endoplasmic reticulum organization, and cytoskeletal changes. Transcriptomic analysis shows reduced expression of cell adhesion genes in deletion astrocytes, consistent with post-mortem brain data. Integration of RNA and morphology data suggests a link between adhesion gene dysregulation and mitochondrial abnormalities. These results illustrate how combining image-based profiling with gene expression analysis can reveal cellular mechanisms associated with genetic risk in neuropsychiatric disease.


Conflict of interest statement

Competing interests: B.C., S.S., and A.E.C. serve as scientific advisors for companies that use image-based profiling and Cell Painting (A.E.C.: Recursion, SyzOnc, Quiver Bioscience, B.C.: Marble Therapeutics, and S.S.: Waypoint Bio, Dewpoint Therapeutics, Deepcell) and receive honoraria for occasional scientific visits to pharmaceutical and biotechnology companies. All other authors declare no competing interests.

Figures

Fig. 1
Fig. 1. Study overview.
a Representative images of astrocytes stained with the Cell Painting dyes. Scale bar = 50 μm. b Schematic of strategy for capturing NeuroPainting high-dimensional image-based profiles from a large cohort of iPSCs. In batches of 44, iPSCs were differentiated into NPCs, neurons, and astrocytes and then plated in 384-well microplates in a randomized orientation for downstream image acquisition. CellProfiler was used to process images and extract morphological features. We imaged one batch for each cell type.
Fig. 2
Fig. 2. Cell-type-specific morphological signatures.
a Representative image of cell types included in this study. Scale bar = 50 μm. b Accuracy of Random Forest classifiers in predicting cell type from image-based features. Each point represents the mean classification accuracy from 5-fold cross-validation using all features, grouped by cell type. Error bars represent 95% confidence intervals obtained from n = 1000 bootstrap replicates. c Barplot of feature categories for the 100 most important features based on our Random Forest classifier. The fractions of the features marked as important are indicated for each category. d Classification accuracy for each feature category, calculated as in (b). e Violin plot for Nuclei_RadialDistribution_MeanFrac_Mito_1of4 across cell types (p = 1.37e-35, ANOVA, n = 176 per cell type, two-sided). Feature values are INT scores for each morphology trait. f Violin plot for Cytoplasm_Correlation_RWC_AGP_ER across cell types (p = 1.64e-15, ANOVA, n = 176 per cell type, two-sided), presented like Fig. 2e. In both panels (e, f), boxplots within violins show the median (line), first and third quartiles (box limits), and whiskers extend to the most extreme data point within 1.5 times the interquartile range (IQR) from the box. g Schematic representation of two distinguishing cell morphology characteristics across the four cell types. (top) Nuclei_RadialDistribution_MeanFrac_Mito_1of4 is related to the intensity of the mitochondrial dye near the inner-most region of the cell. A greater value for this feature indicates more of a cell’s mitochondria are present near the nucleus. (bottom) Cytoplasm_Correlation_RWC_AGP_ER refers to the co-presence of the AGP and ER dyes for a given location in the cytoplasm of the cell. A greater feature value indicates that there is stronger overlap for the AGP and ER stains when compared to lower values.
Fig. 3
Fig. 3. Genotype-specific morphological signatures in 22q11.2 deletion syndrome.
a Correlation matrix of NeuroPainting profiles for iPSCs, progenitors, neurons, and astrocytes from control and 22q11.2 deletion cell lines. The green and purple notation on the left of the plot indicates control versus deletion genotype. The rainbow notation corresponds to individual cell line aliases. b Barplot for significantly different features as measured by the Wilcoxon rank sum-test between control and 22q11.2 deletion carriers across each cell type. Features were significant if they passed an FDR threshold of 5%. c Venn diagram showing the number of significant features that overlap across the different cell types. d Dotplot of feature characteristics for 72 overlapping significant features. e Dotplot of feature values for Cytoplasm_Correlation_RWC_ER_Mito across each cell type (n = 22 per genotype, per cell type). Error bars represent the standard error of the mean. f Representative images for min/max values for Cytoplasm_Correlation_RWC_ER_Mito in control (top) and 22q11.2 (bottom) astrocytes. Minimum and maximum values are based on per-well INT transformed feature values. Images were selected based on the highest and lowest average feature value for both control and 22q11.2 deletion carriers. Scale bar is 50 μm.
Fig. 4
Fig. 4. Dysregulation of cell-adhesion mRNA in 22q11.2 astrocytes.
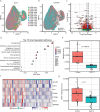
a UMAP projection of single-cell RNA-sequencing (scRNAseq) data from astrocytes colored by donor. b UMAP projection of astrocytes scRNAseq data colored by genotype. c Volcano plot for DEGS (Wald test with Benjamini–Hochberg correction, Log2FC cutoff = 0.05, padj > 0.05). d Gene set enrichment for downregulated genes (Enrichment significance was assessed using a hypergeometric test with Benjamini–Hochberg correction.). e. Metagene score analysis for genes in downregulated pathways (Two-sample T-test, p = 1.065e-6, n = 48, 24 control/24 22q11.2). f Heatmap of logCPM expression for cell-adhesion genes. g Metagene score analysis for top 25 SNAP-a genes (NRXN1, SLC1A2, RNF219-AS1, NTM, ZNF98, GPC5, GRM3, HPSE2, NKAIN3, SLC4A4, CTNND2, NCKAP5, SGCD, LSAMP, GPM6A, LRRC4C, LRRTM4, EPHB1, PREX2, RORA, TMEM108, ARHGAP24, SYNE1, TENM2, AC091826.2) (Two-sample T- test-test, p = 0.0111, n = 48, 24 control/24 22q11.2). In both panels (e, g), boxplots within violins show the median (line), first and third quartiles (box limits), and whiskers extend to the most extreme data point within 1.5 times the IQR from the box.
Fig. 5
Fig. 5. Integration of RNA-seq and NeuroPainting data links cell adhesion gene expression to mitochondrial morphology.
a Scatter plot of first CCA variables (CV1) for RNA-seq and NeuroPainting profiles, colored by condition (control = green, 22q11.2 = purple). b Heatmap of correlation coefficients between gene expression and morphology feature values for the top 100 genes and the top 100 features from CCA loadings. Correlation difference is measured as the absolute value between the control and deletion coefficients. c Scatter plot of absolute differences in correlation coefficients against fold change coefficients between control and 22q11.2 deletion astrocytes for gene-feature pairs. d Barplot for morphology feature categories for cell adhesion gene-feature pairs (chi-square test, Two-sided, χ² = 28.655, df = 6, p-value = 7.069e-05). e The Dotplot highlights the absolute difference in correlation coefficients between control and 22q11.2 astrocytes for cell adhesion gene-mitochondrial feature pairs.

Update of

References

    1. Bessonova, L., Ogden, K., Doane, M. J., O’Sullivan, A. K. & Tohen, M. The economic burden of bipolar disorder in the United States: a systematic literature review. Clinicoecon. Outcomes Res.12, 481–497 (2020). - PMC - PubMed
    1. Kadakia, A. et al. The economic burden of schizophrenia in the United States. J. Clin. Psychiatry83, 14458 (2022). - PubMed
    1. Cohen, B. M. & Öngür, D. The urgent need for more research on bipolar depression. Lancet Psychiatry5, e29–e30 (2018). - PubMed
    1. Kuperberg, M. et al. Psychotic symptoms during bipolar depressive episodes and suicidal ideation. J. Affect. Disord.282, 1241–1246 (2021). - PubMed
    1. McIntyre, R. S. et al. Bipolar disorders. Lancet396, 1841–1856 (2020). - PubMed

MeSH terms

LinkOut - more resources