. 2025 Jul 9;12(1):1164.
doi: 10.1038/s41597-025-05487-7.

A species-level multi-trophic metaweb for Switzerland

Affiliations

A species-level multi-trophic metaweb for Switzerland

Merin Reji Chacko et al. Sci Data. .

Abstract

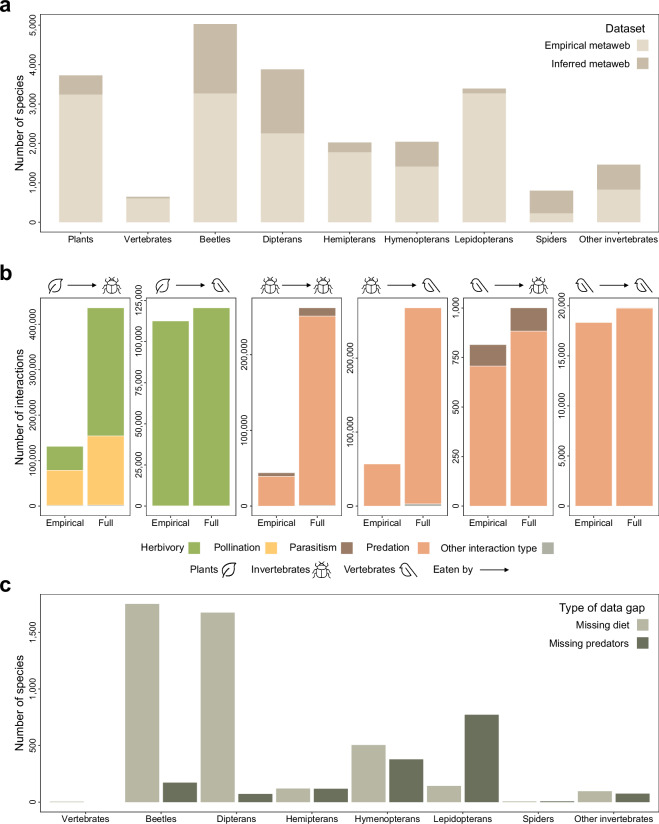
Understanding how species interact within ecological networks is essential for predicting the consequences of environmental change, from trophic cascades to broader changes in species distributions and ecosystem functioning across large spatial scales. To facilitate such explorations, we constructed trophiCH: a country-level trophic meta-food web (henceforth "metaweb") that includes vertebrates, invertebrates, and vascular plants within Switzerland, based on literature published between 1862 and 2023. Our comprehensive dataset catalogues 1,112,073 trophic interactions involving 23,151 species and 125 feeding guilds (e.g., fungivores). Thirty percent of species-level interactions were empirically documented. Additional species-level interactions were inferred by resolving coarser taxonomic records (e.g., inferring links from "species A feeds on genus B") based on habitat co-occurrences. While explorations of large-scale food webs have often relied on modelling approaches due to data gaps, this empirically based metaweb paves the way for data-driven studies of real-world food webs across space and time. By integrating the metaweb with local species assemblages knowledge, future studies can gain insights into broad patterns of food web structure across spatial scales.


Conflict of interest statement

Competing interests: The authors declare no competing interests.

Figures

Fig. 1
Fig. 1
Distribution of species, interactions and data gaps within the metaweb. (a) The distribution of taxa covered by the empirical and full metawebs, (b) the distribution of interactions in the empirical and full metaweb, separated by interactions between plants, invertebrates and vertebrates, and interaction types (herbivory, pollination, parasitism, predation and other interactions missing information on interaction types). (c) the distribution of data gaps in the metaweb by broad taxonomic groups, separated by species missing diets and species missing predators. Icon attribution: Flaticon.com.
Fig. 2
Fig. 2
Construction and expansion of the metaweb. (a) Initial compilation of a species checklist, as well as their upstream taxonomic information for genera and families, and creation of feeding guilds, such as fungi. (b) Empirical data collection process, focusing on information at the species, genus and family level. (c) We expanded links where species were known to consume an organism at the genus level to include all species within the genus (link 1). We additionally inferred links where species were known to consume an organism at the family level, for generalist predators, and filtered by their associations to habitat and vertical stratum within the environment (link 2). Links were also inferred where it was explicitly known that a family of organisms were generalist feeders on feeding guilds, such as fungi (link 3). (d) A final metaweb is assembled using all empirical and inferred links. Icon attribution: Flaticon.com.
Fig. 3
Fig. 3
Validation of the data extraction process. The diagram outlines the sequential steps, beginning with the division of raw datasets into analogue and digital data, then random sampling, error checking, and consolidation across multiple data sources, culminating in the Wilson Score Confidence Interval computation.
Fig. 4
Fig. 4
Comparison of trophiCH to other metawebs. The scatterplots compare log species richness to the residual variation from mixed linear effects models predicting mean degree (left) and standard deviation of degree (right), treating the type of network as a random effect. The colours of the data points represent the type of ecosystem (aquatic: purple, marine: blue, terrestrial: green and terrestrial, aquatic, semiaquatic: orange). The shapes represent the type of network (circle: bitrophic, triangle: multi-trophic). The dark beige rectangles represent the first(±σ) and the light beige rectangles represent the second (±2σ) standard deviations from the mean(x̄).

References

    1. Chen, I.-C., Hill, J. K., Ohlemüller, R., Roy, D. B. & Thomas, C. D. Rapid Range Shifts of Species Associated with High Levels of Climate Warming. Science333, 1024–1026 (2011). - PubMed
    1. Stephens, P. A. et al. Consistent response of bird populations to climate change on two continents. Science352, 84–87 (2016). - PubMed
    1. Montoya, J. M., Pimm, S. L. & Solé, R. V. Ecological networks and their fragility. Nature442, 259–264 (2006). - PubMed
    1. Bascompte, J. Disentangling the web of life. Science325, 416–419 (2009). - PubMed
    1. Thompson, R. M. et al. Food webs: reconciling the structure and function of biodiversity. Trends in Ecology & Evolution27, 689–697 (2012). - PubMed

LinkOut - more resources