. 2025 Jul 9;15(1):24738.
doi: 10.1038/s41598-025-05305-5.

Spatial variation of skin-associated microbiota in a green salamander metapopulation

Affiliations

Spatial variation of skin-associated microbiota in a green salamander metapopulation

Daniel Malagon et al. Sci Rep. .

Abstract

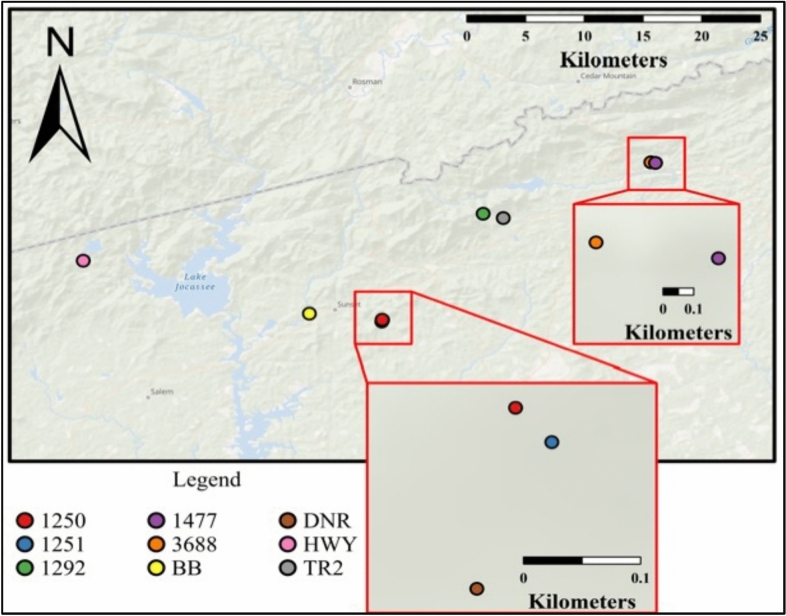
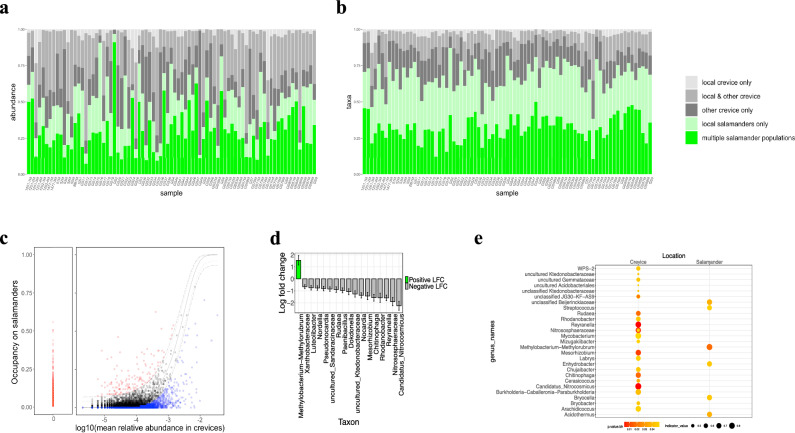
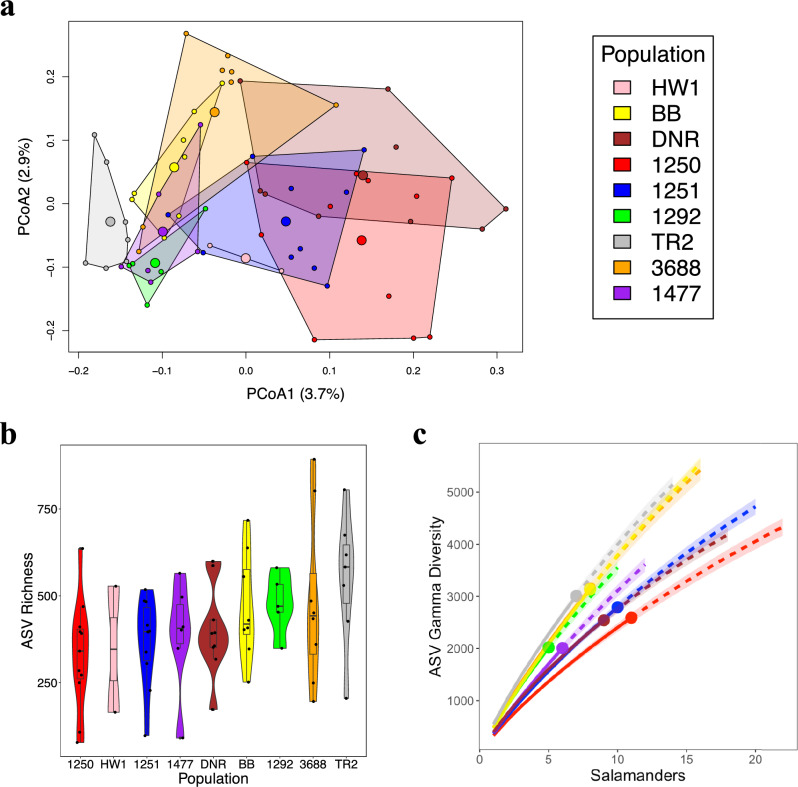
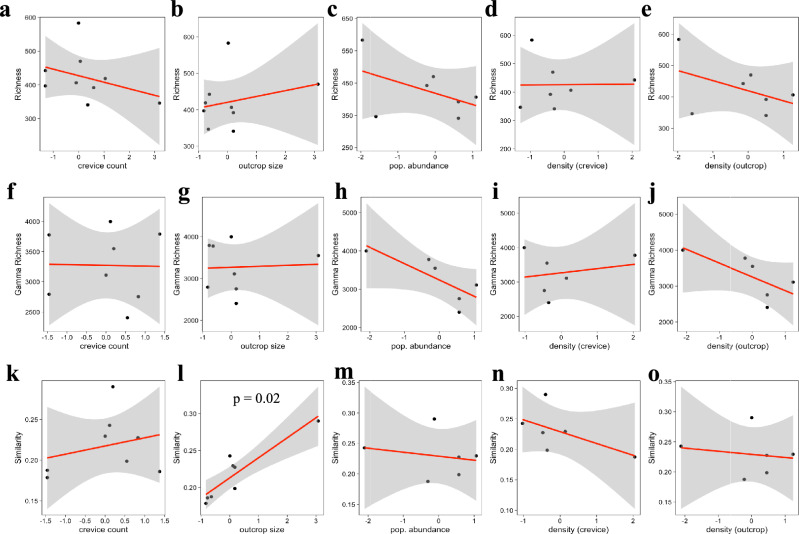
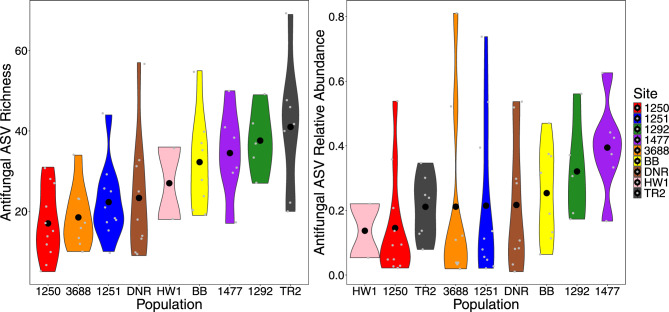
As compared to free-living microbes, host-associated (HA) microbes are unique in that they experience dispersal at both the microbial and host scales. This is particularly clear in systems where hosts experience strong barriers to dispersal, for example hosts that live in patchy habitats or metapopulations. In these systems, there are both limits to dispersal of HA microbes from host to host (microbial scale dispersal) and limits to dispersal of hosts from habitat patch to habitat patch (host scale dispersal). Few studies have considered how host and microbial scale dispersal limitation impacts spatial patterns in HA microbiota. We address this question using green salamander skin microbiota. This species exhibits population structure wherein animals primarily inhabit disjunct rock outcrops with occasional dispersal between outcrop populations. We find strong evidence for the importance of host scale dispersal based on differences in distance-decay of similarity between salamander and environmental microbiota. We find weaker evidence/mixed support for the importance of microbial scale dispersal based on low similarity of the host exclusive skin microbiota but a lack of dependence of skin microbiota similarity and diversity on host density. We discuss implications of our findings, both with reference to other processes governing HA microbiota assembly and with reference to amphibian conservation. For the latter, we consider variation in chytrid-inhibitory community profiles across populations and potential ramifications in terms of variation in susceptibility to chytridiomycosis.


Conflict of interest statement

Declarations. Competing interests: The authors declare no competing interests.

Figures

Fig. 1
Fig. 1
Nine green salamander populations exhibiting metapopulation structure characterized by Novak distributed across upstate South Carolina.
Fig. 2
Fig. 2
Bar graphs showing the composition of each individual salamander skin sample, along with associated crevice swabs. Salamander skin swabs are grouped by local population from West to East. Bars show the relative abundance of the most abundant ASVs, classified to genus and colored by phylum for the most abundant (across all samples) phyla. Specifically, we use Proteobacteria (green), Actinobacteriota (orange), Acidobacteriota (blue), Planctomycetota (purple), and Bacteroidota (teal). All other phyla are collectively shown in grey.
Fig. 3
Fig. 3
Bar graphs showing the partitioning of salamander microbiota between taxa that are exclusive to salamanders (green) and taxa that are shared with the environment (grey) for both total microbial abundance (a) and total microbial ASVs. (c) Salamander occupancy for each microbial taxon (i.e., fraction of salamanders colonized) as a function of mean taxon relative abundance in crevice microbiota. The solid line shows predicted salamander occupancy based on a neutral model fitted using crevice occupancy and abundance, while the dotted and dashed lines show 95% and 99% confidence intervals respectively. Taxa are colored according to whether they are more (red), less (blue) or not different (black) from neutral model predictions based on the 99% confidence interval. (d) ANCOM-BC2 analysis of bacterial ASVs (labeled based on the genus that they map to); (d) indicator species analysis of bacterial ASVs (labeled based on the genus that they map to).
Fig. 4
Fig. 4
Differences in richness and composition between crevice and salamander microbiota. (a) PCoA based on ASVs (Jaccard distance) comparing 20 crevice (grey) and 66 salamander (green) microbiota; (b) ASV richness compared between 20 crevice (grey) and 66 salamander (green) microbiota.
Fig. 5
Fig. 5
(a) PCoA based on ASV Jaccard distances comparing composition across the nine local populations. (b) ASV richness per salamander (alpha diversity) compared across the nine local populations; (b) ASV accumulation curves (population gamma diversity) compared across the eight local populations with (n > 2 salamanders). In all panels we use the following color scheme: HW1 (pink), BB (yellow), DNR (brown), 1250 (red), 1251 (blue), 1292 (green), TR2 (grey), 3688 (orange), and 1477 (purple).
Fig. 6
Fig. 6
Plots of Jaccard similarity for salamander skin microbiota as a function of geographic distance (a), (n = 66), salamander skin microbiota as a function of genetic distance (b), (n = 46) and crevice microbiota as a function of geographic distance (c), (n = 20). Corresponding Mantel correlograms for salamander skin microbiota (d,e) and crevice microbiota (f) as a function of geographic distance (d,f) and genetic distance (e). Points on the correlogram filled in with solid color indicate a significant correlation between geographic/genetic distance and microbiota similarity at that distance class. Across all panels, microbiota components are colored as follows: full salamander skin microbiota (bright green), the salamander exclusive component of skin microbiota (yellow-green), the component of the salamander skin microbiota shared with crevice microbiota (olive green), the full crevice microbiota (grey-brown), the crevice exclusive component of the crevice microbiota (grey) and the component of the crevice microbiota shared with salamander skin (forest green).
Fig. 7
Fig. 7
Linear regressions for richness against crevice count (a), outcrop size (b), population abundance (c), hosts/crevice (d) and hosts/m2 of outcrop (e) and for within-population Jaccard dissimilarity against crevice count (f), outcrop size (g), population abundance (h), hosts/crevice (i), and hosts/m2 of outcrop (j).
Fig. 8
Fig. 8
Chytrid-inhibitory ASV richness (a), and the proportion of reads in each sample which mapped to the Chytrid-inhibitory database (b) across nine green salamander populations.

References

    1. McCoy, K. D., Ronchi, F. & Geuking, M. B. Host-microbiota interactions and adaptive immunity. Immunol. Rev.279, 63–69 (2017). - PubMed
    1. Collado, M. C., Cernada, M., Baüerl, C., Vento, M. & Pérez-Martínez, G. Microbial ecology and host-microbiota interactions during early life stages. Gut Microbes3, 352–365 (2012). - PMC - PubMed
    1. Ezenwa, V. O., Gerardo, N. M., Inouye, D. W., Medina, M. & Xavier, J. B. Animal behavior and the microbiome. Science338, 198–199. 10.1126/science.1227412 (2012). - PubMed
    1. Lewis, Z. & Lizé, A. Insect behaviour and the microbiome. Curr. Opin. Insect Sci.9, 86–90. 10.1016/j.cois.2015.03.003 (2015). - PubMed
    1. Dunbar, H. E., Wilson, A. C. C., Ferguson, N. R. & Moran, N. A. Aphid thermal tolerance is governed by a point mutation in bacterial symbionts. PLoS Biol5, 1006–1015 (2007). - PMC - PubMed

LinkOut - more resources