. 2025 Jul 9;16(1):6331.
doi: 10.1038/s41467-025-61571-x.

Prediction and characterisation of the human B cell response to a heterologous two-dose Ebola vaccine

Affiliations

Prediction and characterisation of the human B cell response to a heterologous two-dose Ebola vaccine

Daniel O'Connor et al. Nat Commun. .

Abstract

Ebola virus disease (EVD) outbreaks are increasing, posing significant threats to affected communities. Effective outbreak management depends on protecting frontline health workers, a key focus of EVD vaccination strategies. IgG specific to the viral glycoprotein serves as the correlate of protection for recent vaccine licensures. Using advanced cellular and transcriptomic analyses, we examined B cell responses to the Ad26.ZEBOV, MVA-BN-Filo EVD vaccine. Our findings reveal robust plasma cell and lasting B cell memory responses post-vaccination. Machine-learning models trained on blood gene expression predicted antibody response magnitude. Notably, we identified a unique B cell receptor CDRH3 sequence post-vaccination resembling known Orthoebolavirus zairense (EBOV) glycoprotein-binding antibodies. Single-cell analyses further detailed changes in plasma cell frequency, subclass usage, and CDRH3 properties. These results highlight the predictive power of early immune responses, captured through systems immunology, in shaping vaccine-induced B cell immunity.


Conflict of interest statement

Competing interests: A.J.P. is chair of the UK Department of Health and Social Care’s Joint Committee on Vaccination and Immunisation. A.J.P., S.B., E.A.C., K.A.S., R.M. and D.O.C. are contributors to intellectual property licensed by Oxford University Innovation to AstraZeneca. The remaining authors declare no competing interests.

Figures

Fig. 1
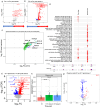
Fig. 1. The EBOV-GP specific IgG-BMEM response induced by Ad26.ZEBOV (dose 1) and boosted by MVA-BN-Filo (dose 2) given at d29 (Group 1, purple), d57 (Group 2, olive) or d85 (Group 3, coral).
a IgG-BMEM ELISpot response: Arrows indicate the time of prime (black) and boost coloured by group. Participants recruited as part of the EBL2001 (UK study) responses were measured at d1, d29, d50, d237 (Gr 1 (purple, solid line); d1, d57, d78, d237 (Grp2, olive, solid line) and d1, d85, d106, d265 (Grp 3, coral, solid line). Similarly, participants followed up four years later as part of the UK PRISM study (at V1 and V2) are also displayed. Also included in this figure are the responses of participants recruited as part of EBL2002 (Group 1 (purple, dotted lines, d1, d29, d50, d185, d365) and Group 2 (golive, dotted lines, d1, d57, d78, d185, d365). Data are expressed as the median (+/− IQR) of IgG-BMEM/million PBMCs. ANOVA, two-sided Freidmans test, with Dunn’s multiple comparison test, p-values *<0.05, **<0.01, ***, 0.001, ****<0.0001 shown for EBL2001 and PRISM only. b Fold Change in IgG-BMEM at d29/d57/d85 post dose 1. c Fold Change in IgG-BMEM at day 21 post MVA-BN-Filo (dose 2). d Fold Change at d180 post dose 2. Median bar is shown and error bars are minimum and maximum values for (bd). e Ex vivo ELISpot Frequency of Total IgG-ASC, (top) and EBOV-GP specific IgG-ASC, (bottom), following dose 1 (d1, d9, d11, d13, d15) and dose 2 (administered at d29, purple line); d57, olive line; or d85, coral line), with frequency quantified on d0, 3, 5, 7 and 9 post dose 2. Data are expressed as Median (+/− IQR). Two-sided one-way ANOVA, with Dunn’s multiple comparison test, p-values *<0.05, **<0.01, ***, 0.001, ****<0.0001. f Flow cytometric characterisation of plasma cells (CD19 + CD20loCD38 + CD27 + ) expressing CD86, CD62L or a4β1, (the gating strategy is shown in Supplementary Figs. 17, 18 and 19)., Date are presented as percentage of total viable CD19 + B cells, or %CD27 + CD38+CD20lo plasma cells in PBMCs obtained at d1, d9, d11, d13 and d15 post dose 1 and d0, d3, d5, d7 and d9 post dose 2 following MVA-BN-Filo at d29 (Group 1, purple) or d85 (Group 3, coral). Data are expressed as the median (+/− IQR). g Activated (ICOS+PD1+) cTfh response following Ad2.ZEBOV as dose 1 (d1, d9, d11, d13, d15) and MVA-BN-Filo administered at d57 post dose 1 (Group 2), with samples obtained on d0, d3, d5, d7 and d9 post dose 2. Gating strategies are shown in Supplementary Fig. 16c.
Fig. 2
Fig. 2. The blood gene expression response to Ad26.ZEBOV and MVA-BN-Filo vaccines.
a Volcano plot highlighting differentially expressed genes (DEGs, false discovery rate [FDR] <0.05; red upregulated and blue downregulated) on day 11 after first dose of Ad26.ZEBOV vaccine (all groups) compared with pre-vaccination (25 DEGs, n = 40). b Volcano plot highlighting differentially expressed genes (DEGs, false discovery rate [FDR] <0.05; red upregulated and blue downregulated) 7 days after second dose vaccine (MVA-BN-Filo) compared with pre-vaccination (442 DEGs, n = 39). c Agreement plot of changes in gene expression (differentially expressed gene only) after the first and second dose of vaccine. In purple are DEGs after first vaccine, green represent DEGs after the second dose only and cyan are genes differentially expressed at both time points. d Modular signatures induced during different study time points, enriched modules (FDR < 1 × 10–3) are displayed order by q-value. Segments of the pie charts represent the proportion of upregulated (red) and downregulated (blue) genes (absolute fold change > 1.25). Module expression was assessed using the “tmodCERNOtest” function, this is a one-sided test for enriching that applies FDR correction for multiple testing. e Volcano plot highlighting differentially expressed genes (DEGs, false discovery rate [FDR] <0.05; red upregulated and blue downregulated) on day 11 after first dose of Ad26.ZEBOV vaccine (all groups) compared with 7 days after second dose vaccine (MVA-BN-Filo) (1987 DEGs, n = 39). f Plotted are the CIBERSORTx plasma cell fractions from whole blood RNA-sequencing data, with median and interquartile range. P-values were determined from a two-sample Wilcoxon rank-sum test (D1 n = 40 individuals, D11 n = 40 individuals and D7 n = 39 individuals). g Volcano plot derived from imputed plasma cell gene expression using CIBERSORTx on the 1000 most differentially expressed genes at day 11, highlighting differentially expressed genes based on two-sided moderated t-tests (DEGs, false discovery rate [FDR] <0.05; red upregulated and blue downregulated) day 11 after first dose of Ad26.ZEBOV vaccine (all groups) compared with pre-vaccination (228 DEGs, n = 40 individuals).
Fig. 3
Fig. 3. The features of the B cell receptor sequence at the study time points.
a Plot shows the distribution of B cell receptor CDRH3 lengths at the study time points. b CDRH3 mean insert size at the study time points. c CDRH3 mean VJ junction (NDN) size at the study time points. d CDRH3 convergence at the study time points. e Identification of a CDRH3 sequence (and sequences within 1 hamming distance of this sequence) exclusively seen post-vaccination. Data points below the horizontal dashed line are 0. f The motif of the CDRH3 sequence (+ 1 hamming distance) of interest. A two-sided Wilcoxon rank-sum test was performed in (bd): *: p <= 0.05, **: p <= 0.01, ***: p <= 0.001 and ****: p <= 0.0001.
Fig. 4
Fig. 4. Support vector regression (SVR) performance of model to predict post-vaccination EBOV glycoprotein binding antibody concentrations.
a training dataset built on the 200 most differentially expressed genes post-first dose of vaccine (n = 28), b performance of model in the test dataset post-first dose of vaccine (n = 10), c the top 25 genes ranked by importance from the SVR model predicting post-first dose EBOV glycoprotein binding antibodies. d training dataset built on the differentially expressed genes (FDR < 0.05) post-second dose of vaccine (n = 28), e performance of model in the test dataset post-second dose of vaccine (n = 8), f the top 25 genes ranked by importance from the SVR model predicting post-second dose EBOV glycoprotein binding antibodies. Two-sided Pearson correlation tests are used in (a, b, d and e) with the shaded area in shaded area representing the 95% confidence band for the predicted values from the linear model.
Fig. 5
Fig. 5. The B cell characteristics by flow cytometry and single cell RNAseq.
a APS-1 (automatic population separator) of the flow cytometric data based on the expression of surface markers listed in the methods, Table ii, (a) and Supplementary Fig. 19). The square symbols indicate each individual, coloured by population, and the contour lines indicate 1 × Standard Deviation for each population. The dotted arrow indicates the direction of differentiatin and the solid arrow the direction of plasma cell differentiation. b B cell clusters identified using 10× single cell RNA-sequencing (cells from all time points with immunoglobulin gene removed). c Top (n = 2) genes defining each B cell cluster (cells from all time points). d Plasma cell proportion of total B cells at study time points (each coloured line is an individual). e The proliferating B cell proportion of B cells at study time points (each coloured line is an individual). f CDRH3 length in IgM plasma cells at study time points (day 1 n = 2 cells, day 11 n = 6 cells, day 64 n = 3 cells, day 92 n = 9 cells). The horizontal lines are the median and interquartile range (IQR) with whiskers to +/– 1.5 × IQR. g CDRH3 length in IgG plasma cells at study time points (day 1 n = 8 cells, day 11 n = 37 cells, day 64 n = 7 cells, day 92 n = 32 cells). The horizontal lines are the median and interquartile range (IQR) with whiskers to +/– 1.5 × IQR. h Hamming distance of CDRH3 sequences from plasma cells to known Ebola glycoprotein binding antibody sequences. The two plasma cell CDRH3 sequences closest to known GP binding monoclonal antibodies (within 3 amino acid changes) are highlighted with a blue arrow. A two-sided Wilcoxon rank-sum test was performed in (f and g).
Fig. 6
Fig. 6. Pseudobulk analysis of the B cell single cell RNA-sequencing data.
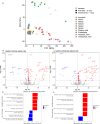
a First and second principal component (PC) of pseudobulk log10 counts per million expression values. b Volcano plot highlighting DEGs (false discovery rate [FDR] <0.05, red upregulated and blue downregulated) in plasma cells 10 days following the first study vaccine. c Volcano plot highlighting DEGs (FDR < 0.05) in plasma cells 7 days following the second study vaccine. d Gene set enrichment analysis on differentially expressed gene list from pseudobulk plasma cells 10 days following the first study vaccine compared with baseline, the most diffentially regulated upregulated and downregulated pathways are displayed (FDR < 0.05). e Gene set enrichment analysis on differentially expressed gene list from pseudobulk plasma cells 7 days following the second study vaccine compared with baseline, the most diffentially regulated upregulated and downregulated pathways are displayed (FDR < 0.05).

References

    1. Henao-Restrepo, A. M. et al. Efficacy and effectiveness of an rVSV-vectored vaccine expressing Ebola surface glycoprotein: interim results from the Guinea ring vaccination cluster-randomised trial. Lancet386, 857–866 (2015). - PubMed
    1. Afolabi, M. O. et al. Safety and immunogenicity of the two-dose heterologous Ad26.ZEBOV and MVA-BN-Filo Ebola vaccine regimen in children in Sierra Leone: a randomised, double-blind, controlled trial. Lancet Infect. Dis.22, 110–122 (2022). - PMC - PubMed
    1. Bockstal, V. et al. Non-human primate to human immunobridging demonstrates a protective effect of Ad26.ZEBOV, MVA-BN-Filo vaccine against Ebola. NPJ Vaccines7, 156 (2022). - PMC - PubMed
    1. Anywaine, Z. et al. Safety and immunogenicity of 2-dose heterologous Ad26.ZEBOV, MVA-BN-Filo Ebola vaccination in children and adolescents in Africa: a randomised, placebo-controlled, multicentre Phase II clinical trial. PLoS Med.19, e1003865 (2022). - PMC - PubMed
    1. Shukarev, G., Callendret, B., Luhn, K., Douoguih, M. & EBOVAC1 Consortium. A two-dose heterologous prime-boost vaccine regimen eliciting sustained immune responses to Ebola Zaire could support a preventive strategy for future outbreaks. Hum. Vaccin Immunother.13, 266–270 (2017). - PMC - PubMed

MeSH terms

LinkOut - more resources