

Genetic analysis of a novel TSC1 splice mutation causing tuberous sclerosis without neurological phenotypes
- PMID: 40634399
- PMCID: PMC12241344
- DOI: 10.1038/s41598-025-07906-6
Genetic analysis of a novel TSC1 splice mutation causing tuberous sclerosis without neurological phenotypes
Abstract
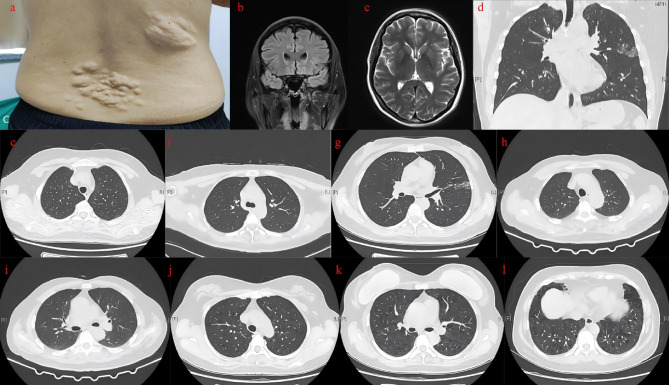
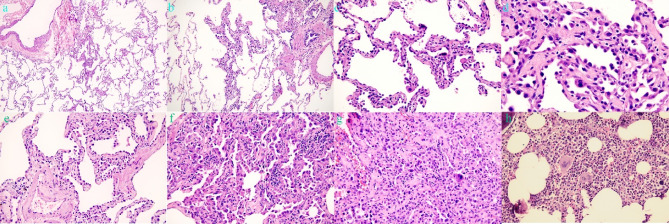
Tuberous sclerosis complex (TSC) is an autosomal dominant genetic disorder characterized by the development of benign tumors and lesions in multiple organ systems. The syndrome arises from heterozygous mutations in either TSC1 or TSC2. In this study, we identified a family with a TSC1 c.363 + 668G > C mutation exhibiting diverse clinical phenotypes. The proband and affected family members exhibited multifocal nodular pneumocyte hyperplasia (MMPH), renal hamartomas, bone marrow hyperplasia, and pulmonary lymphangioleiomyomatosis (LAM), with genetic co-segregation analysis confirming the association between the mutation and the clinical phenotype. Genetic co-segregation analysis demonstrated that the TSC1 c.363 + 668G > C mutation was consistently associated with the observed clinical features in this family. Using first-generation Sanger sequencing, we identified a heterozygous splicing variation located in intron 5 of TSC1 (NM_000368.5). In vitro cell and family Minigene results show that TSC1 c.363 + 668G > C mutation can lead to abnormal retention of 92 bp intron sequence in different positions, which may be related to the alternative splicing phenomenon that the same gene produces different splicing variants in different tissues or development stages. The 3D protein structure analysis using Chimera revealed that the mutation site was located at the 363rd base, within the intron between the 121st and 122nd amino acids. This mutation resulted in the insertion of a 92-base sequence, causing a frameshift that led to premature termination of the TSC1 protein after the translation of 26 amino acids. Additionally, the 121st amino acid was altered from lysine to asparagine, significantly shortening the mutated TSC1 protein. These findings provide critical experimental evidence supporting the potential pathogenic mechanism of the TSC1 c.363 + 668G > C mutation. Future research should focus on validating this splicing abnormality in patient-derived cells or tissues and investigating its impact on protein expression and functional activity to better understand its role in disease progression.Clinical trial number: K2024-09-144.
© 2025. The Author(s).
Conflict of interest statement
Declarations. Ethics approval and consent to participate: This study was reviewed and approved by the Ethics Committee of Fujian Provincial Hospital, Fuzhou, China, with the approval number: K2024-09-144. All participants and legal guardians have written informed consent in the study. Competing interests: The authors declare no competing interests.
Figures


References
-
- Crino, P. B., Nathanson, K. L. & Henske, E. P. The tuberous sclerosis complex. N Engl. J. Med.355 (13), 1345–1356 (2006). - PubMed
-
- Henske, E. P., Jozwiak, S., Kingswood, J. C., Sampson, J. R. & Thiele, E. A. Tuberous sclerosis complex. Nat. Rev. Dis. Primers. 2, 16035 (2016). - PubMed
-
- Curatolo, P., Bombardieri, R. & Jozwiak, S. Tuberous sclerosis. Lancet372 (9639), 657–668 (2008). - PubMed
-
- Morrison, P. J., Shepherd, C. H., Stewart, F. J. & Nevin, N. C. Prevalence of tuberous sclerosis in UK. Lancet352 (9124), 318–319 (1998). - PubMed
-
- Mayer, K., Ballhausen, W. & Rott, H. D. Mutation screening of the entire coding regions of the TSC1 and the TSC2 gene with the protein Truncation test (PTT) identifies frequent splicing defects. Hum. Mutat.14 (5), 401–411 (1999). - PubMed
MeSH terms
Substances
Grants and funding
- No. 2023002/the National Key Clinical Specialty
- No. 2023002/the National Key Clinical Specialty
- No. 2023002/the National Key Clinical Specialty
- No. 2023002/the National Key Clinical Specialty
- No. 2023002/the National Key Clinical Specialty
- No. 2023002/the National Key Clinical Specialty
- 2022J01417, 2022J01409, 2023J011159, 2022J01996, 2024Y0033/the Fujian Province Natural Science Fund Project
- 2022J01417, 2022J01409, 2023J011159, 2022J01996, 2024Y0033/the Fujian Province Natural Science Fund Project
- 2022J01417, 2022J01409, 2023J011159, 2022J01996, 2024Y0033/the Fujian Province Natural Science Fund Project
- 2022J01417, 2022J01409, 2023J011159, 2022J01996, 2024Y0033/the Fujian Province Natural Science Fund Project
- 2023Y9284/Joint Funds for the innovation of science and Technology in Fujian province
- 2023Y9284/Joint Funds for the innovation of science and Technology in Fujian province
- 2023Y9284/Joint Funds for the innovation of science and Technology in Fujian province
- 2022CXA001/the Fujian Province Medical Innovation Foundation
- 2022CXA001/the Fujian Province Medical Innovation Foundation
- 2022QH2042, 2023QH2038/Startup Fund for scientific research, Fujian Medical University
LinkOut - more resources
Full Text Sources
Medical
