. 2025 Aug;644(8077):769-779.
doi: 10.1038/s41586-025-09233-2. Epub 2025 Jul 9.

Selective remodelling of the adipose niche in obesity and weight loss

Affiliations

Selective remodelling of the adipose niche in obesity and weight loss

Antonio M A Miranda et al. Nature. 2025 Aug.

Abstract

Weight loss significantly improves metabolic and cardiovascular health in people with obesity1-3. The remodelling of adipose tissue (AT) is central to these varied and important clinical effects4. However, surprisingly little is known about the underlying mechanisms, presenting a barrier to treatment advances. Here we report a spatially resolved single-nucleus atlas (comprising 171,247 cells from 70 people) investigating the cell types, molecular events and regulatory factors that reshape human AT, and thus metabolic health, in obesity and therapeutic weight loss. We discover selective vulnerability to senescence in metabolic, precursor and vascular cells and reveal that senescence is potently reversed by weight loss. We define gene regulatory mechanisms and tissue signals that may drive a degenerative cycle of senescence, tissue injury and metabolic dysfunction. We find that weight loss reduces adipocyte hypertrophy and biomechanical constraint pathways, activating global metabolic flux and bioenergetic substrate cycles that may mediate systemic improvements in metabolic health. In the immune compartment, we demonstrate that weight loss represses obesity-induced macrophage infiltration but does not completely reverse activation, leaving these cells primed to trigger potential weight regain and worsen metabolic dysfunction. Throughout, we map cells to tissue niches to understand the collective determinants of tissue injury and recovery. Overall, our complementary single-nucleus and spatial datasets offer unprecedented insights into the basis of obese AT dysfunction and its reversal by weight loss and are a key resource for mechanistic and therapeutic exploration.


Conflict of interest statement

Competing interests: R.L.B. participated in committees or advisory boards for ViiV Healthcare, Gila Therapeutics, Novo Nordisk, Pfizer, Eil Lilly, the Royal College of Physicians, NHS England, the National Institute for Health and Care Excellence, the British Obesity and Metabolic Surgery Society, the National Bariatric Surgery Registry, the Association for the Study of Obesity, the Obesity Health Alliance, the International Federation for the Surgery for Obesity and Metabolic Diseases, Obesity Empowerment Network UK and the European Society for Endocrinology. R.L.B. has undertaken consultancy work for Novo Nordisk, ViiV Healthcare and Epitomee Medical, and is employed by Eli Lilly. The remaining authors declare no competing interests.

Figures

Fig. 1
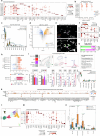
Fig. 1. A single-cell atlas of human AT in leanness, obesity and WL.
a, Graphical representation of the primary study cohort (left; single-nucleus analyses in n = 25 obese (OB) people before and after WL and n = 24 lean (LN) people, with spatial analyses in n = 4 people per group) and AT anatomical location (right). b, Clinical characteristics of the primary cohort (n = 24 LN and 25 paired OB–WL donors). Boxplot, median interquartile range minimum and maximum. BMI, body mass index (kg m–2); F insulin, fasting insulin (mIU L–1); HbA1c, haemoglobin A1c (%); HDL, high-density lipoprotein cholesterol (mM); DBP, diastolic blood pressure (mm Hg). c, Uniform manifold approximation and projection (UMAP) of 145,452 human AT cells (n = 74 samples of the primary cohort and n = 13 samples of the Emont published cohort, single nucleus). ASC, adipocyte stem cells; APC, adipocyte progenitor cells; Mono, monocytes; DCs, dendritic cells; ILCs, innate lymphoid cells. d, Cell-type proportions (for the cell types in c) in the combined cohort, mean per group, and for each sample (single nucleus). e, Correlations between cell types and clinical traits (Pearson, LN and OB samples only, single nucleus). Illustration in a created using BioRender (Scott, W., https://BioRender.com/rtmnzaj; 2025).
Fig. 2
Fig. 2. Immune cell infiltration, activation and reprogramming in obesity and WL.
a, UMAP embedding of myeloid (MYE) cell classes (top) and densities (bottom). cDC1 and cDC2, dendritic cells 1 and 2; cMono and ncMono, classical and non-classical monocytes; plasm., plasmacytoid. b, LAM subtype (ST) marker genes relative to the main macrophage classes. FCG, fraction of cells in the group. c, LAM subtype proportions in LN, OB and WL (left) and OB split into low and high fasting insulin (FI, right), relative to total macrophages/sample. Boxplot, median IQR minimum and maximum; n, number of donors. Wilcoxon paired (OB–WL) and unpaired (OB–LN, FI) two-tailed, FDR adjusted P-values. Intermed., intermediate; Prolif., proliferative. d, CellTypist predicted LAM subtypes in spatial datasets at CLS (top). Immunohistochemistry of TREM2 (pan-LAM marker) and TLR2 (ST2 marker) at CLS (middle, bottom). Scale bar, 50 μm. e, Transcriptomic flux-based analyses showing global (top) and pathway-specific (middle and bottom) metabolic activation in OB compared with LN and WL macrophages. Cohen’s D, coloured at FDR < 0.05 (Wilcoxon): red, obese high; blue, obese low; grey, non-significant. Pie charts show the proportions of significant reactions (n = 24 LN; n = 25 OB; n = 24 WL donors). Pent. ph, pentose phosphate pathway; OxPhos, oxidative phosphorylation; Glycol/glucoN, glycolysis/glucogenesis; FA syn., fatty acid synthesis; FA ox., fatty acid oxidation. f, Differentially expressed genes in macrophages in LN–OB and OB–WL comparisons, separated by datasets. Coloured by log2-transformed fold change (log2FC): red, obese high; blue, obese low; sized by adjusted –log10P-value; negative binomial mixed-effects model. Circled dots represent comparisons with absolute log2FC > 0.3 and adjusted P < 0.05. g, Transcriptomic flux-based analyses (top) showing global metabolic activation in LAMs compared with TRMs. Cohen’s D, coloured at FDR < 0.05 (Wilcoxon); red, LAM high; blue, LAM low; grey, non-significant (n = 86 MYE1, n  =  74 MYE2 and n  =  80 MYE3 samples). SCENITH (bottom) basal respiration (HPG incorporation) and glycolytic capacity (change in HPG incorporation) in LAMs and TRMs from OB donors (n = 7, mean ± s.e.m., paired Student’s t-test). MFI, mean fluorescence intensity. h, Differential gene regulatory networks in: left, macrophage subtypes (scaled log2FC > 0.3, subtype versus all other subtypes, Wilcoxon, FDR < 0.05); and right, all macrophages (Mɸ) in LN–OB and OB–WL comparisons (log2FC, Wilcoxon, red, OB high). Source data
Fig. 3
Fig. 3. Dynamic regulation of adipocyte cellular and molecular profiles in obesity and WL.
a, Marker-gene expression in mature adipocyte subpopulations. b, Beeswarm plots showing changes in neighbourhood abundance in LN–OB and OB–WL comparisons in adipocyte subpopulations. Log2FC, coloured by spatial FDR < 0.1: red, OB high; blue, OB low. The circles show the percentage of significant neighbourhoods. c, Transcriptomic flux-based analyses of global (top) and example (middle and bottom) metabolic pathways in OB compared with LN and WL adipocytes. Reaction level, Cohen’s D, coloured by FDR < 0.05 (Wilcoxon): red, OB high; blue, OB low; grey, non-significant; cat., catabolism; syn., synthesis; ox., oxidation. Pie charts show the proportion of significant reactions. d, Scores measuring overall activity in major metabolic pathways in individual adipocytes, averaged by participant (density, median IQR), then compared between conditions. DNL, de novo lipogenesis. Two-tailed Wilcoxon test unpaired (LN–OB and LN–WL) and paired (OB–WL) FDR-adjusted P-values are shown (n = 24 LN; n = 25 paired OB–WL donors). e, Differential expression of enzymatic genes in lipid and BCAA metabolism pathways in OB compared with LN and WL adipocytes, separated by datasets. Coloured by log2FC: red, OB high; blue, OB low; sized by adjusted −log10 P-value, negative binomial mixed-effects model. Circles represent comparisons with absolute log2FC > 0.3 and adjusted P < 0.05. f, Overall activity in metabolic pathways in adipocyte subpopulations (scaled mean scores). Therm., thermogenesis; Creat., creatine; Cal., calcium; Adap., adaptive. g, Mean expression of mechanosensitive, stress, fibrotic and homeostatic genes across conditions and adipocyte subpopulations, in single nucleus (left) and spatial (middle) datasets (limited to genes in both datasets, nucleus segmentation). Spearman correlation (right) of genes with adipocyte areas in each condition and across all conditions combined (spatial dataset, boundary segmentation). The # denotes rank (high-to-low) across 97 genes (P-value threshold less than 1 × 10−5 in more than one correlation). h, Representative spatial sections showing altered adipocyte sizes (WGA segmented) and JUN (stress marker) expression across conditions. Bottom bars, mean JUN expression and mean log10area in adipocytes across all spatial samples for each condition. Scale bar, 1 mm.
Fig. 4
Fig. 4. Stressed cells form a spatial niche and enrich for stress-associated signalling pathways.
a, Marker-gene expression profiles in basal and stressed subpopulations of mature adipocytes (AD), precursors (APC), endothelial cells (EC) and mural pericytes (Per.). b, Pairwise changes in stressed cell proportions in OB and subsequent WL in single nucleus (grey) and spatial (orange) datasets. c, Tissue-wide stress scores (calculated from the 24 common upregulated stress genes present in the spatial dataset, logged score) in representative LN, OB and WL spatial tissue sections, and the mean stress score for each condition in all samples. d, Spatial zonations. Top, mean cell state stress score in 50-µm bins. Middle, percentage of cells in stress quantiles, across all conditions, per cell state (Q1 low, Q4 high stress). Bottom, cell state composition of tissue niches, represented as scaled percentage per cell state. Stressed states are shown in bold. e, Spatial niches in representative tissue sections. f, Imputed CellChat communication between spatial niches for THBS1 (top) and ADGRE5 (bottom). Links represent the scaled mean probability (line thickness) and directions of connectivity. Line colour reflects signal source. All conditions were combined to identify the main niches underlying the pathway effects. g, CellChat communication between cell states for THBS1 (left) and ADGRE5 (right) in the single-nucleus dataset, across all conditions. Links represent the scaled mean probability (line thickness) and directions of connectivity. Line colour reflects signal source. Lower probability interactions for ADGRE5 were removed for clarity. h, Ligand–receptor pathways with significant differential interactions in OB–LN and OB–WL comparisons (tissue-wide, single-nucleus dataset). Separated into reciprocal (significant in both comparisons, top) and other (significant in one comparison, bottom). Coloured by relative flow: red, OB high; blue, OB low; *FDR < 0.05. Infinity (Inf) represents pathways that were present in only one of the conditions. Dashes indicate null ligand–receptor interactions. Scale bars, 1 mm.
Fig. 5
Fig. 5. WL potently reverses senescence and its mediators.
a, Differences in the expression of cell cycle and senescence marker genes in WL among vulnerable cell types. Prog., progression. b, Mean proportions of p21 (0–1)-positive cells in each sample across conditions in single-nucleus datasets. Separated into vulnerable cell types. Two-tailed Wilcoxon (unpaired LN–OB, LN–WL and paired OB–WL) test, FDR-adjusted P-values; n = 24 LN; n = 25 paired OB–WL donors). c, Immunohistochemistry showing the fraction of p21-positive cells (0–1) in tissue sections (n = 5 LN, n = 4 OB, n = 4 WL, paired Student’s t-test, left). Representative images of a pair of OB and WL tissue sections stained for p21 (scale bar, 100 µm; arrows depict p21-positive nuclei). d, Differential gene regulatory networks (left) in each cell state (scaled log2FC > 0.5 in one or more state versus all other states in that cell type; Wilcoxon two-tailed, FDR < 0.05) and in LN–OB (middle, dark red OB high) and OB–WL (right, red OB high) comparisons in each cell type (log2FC, Wilcoxon two-tailed, red OB high). Clustered on cell state networks. Non-significant networks at P > 0.05 Bonferroni corrected are coloured grey. e, A network of TFs conserved across stressed cell states (scaled log2FC > 0.4 in three or more stressed cell states; Wilcoxon, FDR < 0.05), coloured by TF family, sized by number of forward interactions with other TFs, encircled if interaction with self (41 of 41 TFs) and linked by the shared number of target genes (width and colour, Jaccard index). AP1, activator protein 1-family TF; KLF, Krüppel-like TF; SDT, signal-dependent TF; ONR, orphan nuclear receptor; Ciliogen., ciliogenesis TF; EGR, early growth response TF; NFAT, nuclear factor of activated T cells TF. f, Tissue-wide (50-µm bins) expression of SASP components, AREG and CXCL2, in representative spatial tissue sections for each condition. Left, number of transcripts. Right, averaged across respective sections. Scale bar, 1 mm. Source data
Extended Data Fig. 1
Extended Data Fig. 1. Single nucleus and spatially resolved variations in cell types and states in lean, obese and WL adipose tissues.
a, UMAP embedding of AT cell types across conditions and datasets demonstrating successful integration and cell type conservation. b, Cell type marker genes in the single nucleus (Nuc, left) and spatial datasets (right). ASC, adipose stem cells. APC, other adipose progenitor cells. Endothelial, vascular endothelial cells. ILC, innate lymphoid cells. Lymphatic, lymphatic endothelial cells. Mono/DC, monocytes and dendritic cells. c, Cell state marker genes in the Nuc (left) and spatial datasets (right). b,c, Scaled mean expression and proportion (%) of cells expressing marker. d, Proportion of cell neighbourhoods exhibiting significant differences in cell abundance between conditions (Spatial FDR < 0.1) for each cell type. Orange obese-high, blue obese-low, grey non-significant (NS). e, Proportional changes in adipocytes and macrophages between conditions in single Nuc and spatial datasets. Restricted to these cell types due to limited spatial cohort numbers (N = 4/group) and intra-sample/group heterogeneity in vascular and precursor cell numbers. Boxplot, median IQR min/max. Wilcoxon Paired (OB-WL) and Unpaired (OB-LN), FDR adjusted P value. f, Alterations in pathway-wide metabolic flux between conditions in major AT cell types. Cohen’s D, coloured at FDR < 0.05, red obese-high, blue obese-low.
Extended Data Fig. 2
Extended Data Fig. 2. Adipose tissue immune system variations in human weight gain and WL.
a, Myeloid cell marker genes, scaled mean expression, proportion (%) of cells expressing marker. b, Beeswarm plots showing significant changes (Spatial FDR < 0.1) in neighbourhood abundance in myeloid cell classes. Lean-obese, obese-WL comparisons, Log2FC between conditions, red obese-high, blue obese-low. Fasting insulin adjusted for body mass index (FI adj BMI), Log2FC per unit change, red FI-high, blue FI-low. c, Proportional changes in myeloid cell abundance in single nucleus dataset. Boxplot, median IQR min/max. Lean-Obese unpaired, WL-Obese paired Two-tailed Wilcoxon test. FDR adjusted P values. d, Volcano plot of differentially expressed genes in LAM subtypes (ST) 1 (adaptive) and 2 (maladaptive/inflammatory). Two-tailed Wilcoxon unpaired test, FDR < 0.05. Red, LAM ST2-high, Blue LAM ST2-low. e, Representative spatial images of a CLS. Top, individual transcripts detected by Xenium for Adipocyte markers (ADIPOQ Orange, PLIN4 Cyan), a LAM marker (PLA2G7 Magenta), and a nuclei counterstain (DAPI Gray), showing LAMs surround a transcriptionally devoid/dead adipocyte. Bottom, CellTypist “best match” prediction of LAM ST at the CLS. f, Shared LAM subtype marker genes, scaled mean expression, proportion (%) of cells expressing marker, in the single nucleus (sNuc, top) and spatial (bottom) datasets. sNuc was used as the training dataset to predict a “best match” in the spatial dataset (CellTypist). g, Proportion of LAM ST1 and ST2 in CLS (defined as ≥3 LAMs) or isolated (defined as ≤2 LAMs in Neighbourhood). Two-tailed Chi2 test. h, Alterations in pathway-wide metabolic flux. Top, between conditions in mature (MYE2) and immature (MYE3) LAM and TRM (MYE1). Red obese-high, blue obese-low. Bottom, between TRM and LAM. Wine-red LAM-high, Yale-blue LAM-low. Cohen’s D, coloured at FDR < 0.05. i, SCENITH strategy (top) for LAM and TRM metabolic activity from Obese donors (N = 7). Cells were gated as single cells (FSC-A-SSC-A, FSC-A-FSC-H, not shown), Zombie-neg (Live/Dead dye) and CD45-pos (pan-immune marker), followed by FOLR2 (TRM marker) and CD9 (LAM marker). HPG-AZ555 Click chemistry was used to measure metabolic activity. Cells were treated with combinations of drugs (Control, 2DG, Oligo, 2DG+Oligo) to assess metabolic profiles, calculated using formulas (right panel). Bottom, Click intensity (MFI) for each drug treatment (left) and calculated metabolic profiles (right). Mean SEM. Paired Student’s two-tailed t-test P value. j, Proportional changes in myeloid cell abundance in spatial dataset. k, Differentially expressed inflammatory cyto/chemokine genes between conditions in single nucleus (Nuc) and spatial datasets. Red obese-high, blue obese-low. Size adjusted -log10 P value, negative binomial mixed effects model. Circled dots represent comparisons with absolute log2FC > 0.3 and adjusted P value < 0.05. l, UMAP embedding of lymphoid cell classes, all conditions in single nucleus dataset. m, Lymphoid cell marker genes, scaled mean expression, proportion (%) of cells expressing marker. n, Global proportional changes (%) in cell abundance in broad lymphoid cell classes across conditions. Boxplot, median IQR min/max. Two-tailed Wilcoxon paired (OB-WL) and unpaired (OB-LN) test. FDR adjusted P values. Source data
Extended Data Fig. 3
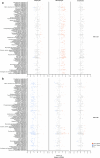
Extended Data Fig. 3. The full spectrum of metabolic pathway flux changes in mature adipocytes and macrophages (83 pathways, 1895 reactions).
All metabolic pathway changes in flux-based analyses in a, lean-obese and b, obese-WL comparisons. Presented for adipocytes and macrophages in which global metabolic shifts were observed and endothelial cells as a representative other cell type to demonstrate absence of global activation. Cohen’s D, coloured at FDR < 0.05, red obese-high, blue obese-low.
Extended Data Fig. 4
Extended Data Fig. 4. Mature adipocyte molecular heterogeneity and regulation in obesity and WL.
a, UMAP embedding of mature adipocytes, all conditions grouped. b, Adipocyte cell state proportions (0 to 1) in the combined cohort, mean (Av.) per group, and for each sample. c, Proportional changes in adipocyte cell abundance in spatial datasets. d, Scores measuring overall activity in major metabolic pathways in each adipocyte, averaged for each participant (density, median IQR) then compared between conditions. Two-tailed Wilcoxon unpaired (LN-OB, LN-WL) and paired (OB-WL) FDR adjusted P values (N = 24 LN; 25 paired OB/WL donors). e, Schematic of the triglyceride (TG) to glycerol cycle, broken down into reaction steps, and annotated by reaction enzyme families. ATP consuming steps are highlighted. Adapted from Sharma et al. f, Extended differentially expressed genes between conditions in single nucleus (Nuc) and spatial datasets in adipocytes. Encompassing enzymes in metabolic substrate pathways, including the TG cycle, and upstream regulators. Red obese-high, blue obese-low. Size adjusted -log10 P value, negative binomial mixed effects model. Circled dots represent comparisons with absolute log2FC > 0.3 and adjusted P value < 0.05. g, Differential gene regulatory networks between obesity and WL in mature adipocytes, restricted to metabolic pathway genes. TF networks with >50 metabolic genes/network and network P < 0.05 Bonferroni adjusted are shown. Coloured by proportion of all pathway genes in the network. Barplots show sum of genes in pathway (top) and network (right). Left, heatmaps show network (two-tailed Wilcoxon test) log2FC and human GWAS intersection. h, Pathways underlying reciprocally differentially expressed genes in lean-obese (LN-OB, log2FC > 0.5, FDR < 0.01) and obese-WL (OB-WL, log2FC > 0.5, P < 0.05, Bonferroni adjusted) comparisons. ORA, hypergeometric distribution, coloured by FDR adjusted -log10 P values, sized by count, enrichment factor is gene ratio/background ratio. i, Variations in mature adipocyte sizes (top, log10 Area; bottom, Area) between groups in spatial analyses, and two-tailed Wilcoxon test P value (N = 4850 LN; 3315 OB; 3909 WL; number of segmented adipocytes across 4 donors in each group).
Extended Data Fig. 5
Extended Data Fig. 5. Precursor and vascular cell phenotypes and adaptations in obesity and WL.
a, Adipocyte precursor (APC) subpopulation marker genes presented as scaled mean expression and proportion (%) of cells expressing marker. UMAP embedding of APCs, all conditions grouped, according to b, subtypes and c, subtype marker gene expression. d, Vascular endothelial cell (EC) subpopulation marker genes presented as scaled mean expression and proportion (%) of cells expressing marker. e, UMAP embedding of vascular EC, all conditions grouped. f, Mural cell subpopulation marker genes presented as scaled mean expression and proportion (%) of cells expressing marker. g, UMAP embedding, all conditions grouped. a,b,dg, Cell states highlighted in bold represent stressed populations.
Extended Data Fig. 6
Extended Data Fig. 6. Stressed signatures are conserved across susceptible cell types.
a, Proportions (%) of differentially abundant neighbourhoods (Spatial FDR < 0.1) in lean-obese and obese-WL comparisons among basal and stressed cell states. Orange obese-high, blue obese-low, grey non-significant (n.s.). Mature adipocytes (AD), precursors (APC), endothelial cells (EC) and mural pericytes (Per.). b, Pairwise changes in basal and stressed cell proportions in obesity and subsequent WL for each donor in single nucleus (grey) and spatial (orange) datasets (N = 25 single nucleus; 4 spatial). c, Differential expression between conditions of common stress genes in all vulnerable cell types (left) and homeostatic and maladaptive genes in metabolic and precursor (right, top) and vascular (right, bottom) cell types. Red obese-high, blue obese-low. Size adjusted -log10 P value, negative binomial mixed effects model. Circled dots represent comparisons with absolute log2FC > 0.3 and adjusted P value < 0.05. d, Overlap of differentially expressed genes in stressed states compared to the respective basal state, among vulnerable cell types (Wilcoxon test, FDR < 0.05). Red represents a common set of 188 differentially upregulated and 15 downregulated genes in all represented stressed cell states (Single Nuc. dataset). e, UMAP embedding of example stress genes across susceptible cell types. f, Stress score based on 188 conserved upregulated genes in stress cell states (AD3, EC2, APC3, Mu4), by cell type and condition, represented as a scaled z-score. g, Changes in neighbourhood abundance in lean tissues in association with age (top) and fasting insulin (bottom) adjusted for age (FI age adj., Log2FC per unit change in trait). For AD3 and APC3, two-tailed Binomial sign test P values comparing the observed directions of effect in each cell neighbourhood with the expected null of 0.5.
Extended Data Fig. 7
Extended Data Fig. 7. Regulation of cellular stress in adipose tissue.
a, Violin plots of stress enriched-genes for example pathways, averaged per sample in stressed (dark grey) and basal (light grey) cell states. Violins outlined in black have Log2FC > 0.1 and FDR < 0.05 (Wilcoxon, Supplementary Table 12). b, Selected examples of enriched pathways underlying conserved stress genes (differentially expressed in ≥3 stressed-basal state comparisons). ORA, hypergeometric distribution, coloured by FDR adjusted -log10 P values, sized by count, enrichment factor is gene ratio/background ratio. c, In vitro effects of stress induction on: i. human adipocyte differentiation (left, % Oil Red-O (ORO) positive mature adipocytes) in undifferentiated (Negative Control, N = 8), 14-day differentiated (Positive Control, N = 6), and 14-day differentiated 5-day Etoposide treated (5 µM and 10 µM, N = 6) cells; ii. expression of stress marker proteins (middle/right, % JUN and STAT3 positive nuclei, immunohistochemistry) in undifferentiated control and Etoposide treated cells (N = 8 per group). Bar plot, mean SEM. Boxplot, median IQR min/max. d, Representative images of ORO accumulation and e, JUN and STAT3 protein expression in each experimental group. Source data
Extended Data Fig. 8
Extended Data Fig. 8. Tissue niche and tissue-wide communication patterns.
a, Representative images of the spatial datasets showing tissue architecture (top, WGA staining), stress scores in 50-µm bins (middle) and tissue niches (bottom). b, Proportion of cell states in stress quantiles for each condition (Q1 low stress; Q4 high stress). c, Proportions (0 to 1) of cell states in each tissue niche. d, average distance within 300 µm between spatial cell states. e, Clustermap of imputed scaled average ligand communication probabilities (CellChat) per tissue niche, limited to significant communications. f, Imputed CellChat communication between spatial niches for selected ligands. Links represent the scaled mean probability (line thickness) and directions of connectivity. Line colour reflects signal source. All conditions were combined to identify the main niches underlying pathway effects. g, CellChat communication between single nucleus cell states for NAMPT (Visfatin, top) and TGFB1 (bottom). Links represent the scaled mean probability (line thickness) and directions of connectivity. Line colour reflects signal source. All conditions were combined to identify the main cell states underlying pathway effects. Lower probability interactions for NAMPT were removed to improve visualisation. h, Sankey plots showing differential signalling pathways between source and target cells in lean-obese (left) and obese-WL comparisons (right). Source and target cells and pathways sized by overall number of interactions. Connection size represents number of cell type interactions for each pathway and colour relative flow (red obese-high, blue obese-low).
Extended Data Fig. 9
Extended Data Fig. 9. Systematic differential gene expression and pathway analyses in human obesity and WL across the full spectrum of adipose tissue cell types.
a, Number of differentially expressed genes in major AT cell types in lean-obese (FDR < 0.01) and obese-WL (P < 0.05 Bonferroni adjusted) comparisons. b, Heatmaps showing proportion of significant genes (0–1, green) in the primary comparison that had i. concordant directions of effect (concordant), ii. concordant and significant at P < 0.05 (concordant + pval nominal) or iii. concordant and robustly significant (at FDR < 0.01 lean-obese or P < 0.05 Bonferroni adjusted obese-WL, concordant + pval stringent) in the alternative comparison, as well as the associated binomial test -log10 P value (orange). Barplots depict total number of robustly significant reciprocal genes. c, Volcano plots of differentially expressed genes associated with WL across AT cell types. Log2FC positive obese-high and association -log10 P value. Horizontal line, Bonferroni adjusted significance threshold. Selected representative genes annotated. d, Pathway analysis of genes downregulated by WL (FC > 0.5, P < 0.05 Bonferroni adjusted) in cell type intrinsic analyses. Sized by FDR adjusted -log10 P values (ORA, hypergeometric distribution) and coloured by enrichment factor (gene ratio/background ratio). Shown 44 representative of 660 total pathways at FDR < 0.01. e, Pathway analysis of conserved genes, downregulated by weight-loss in ≥3 distinct cell types (FC > 0.5, P < 0.05 Bonferroni adjusted), clustered by gene (N = 213) and pathway (N = 304, ORA, hypergeometric distribution, FDR < 0.01). All differential expression analyses applied two-tailed neg. binom. mixed effect models.
Extended Data Fig. 10
Extended Data Fig. 10. Senescence vulnerability and regulatory pathways in human adipose tissue cell types and the mitigating effects of WL.
a, Differences in expression of cell cycle and senescence marker genes in WL, separated into vulnerable and other cell types. Coloured by log2FC, sized by -log10 P value, neg. binom. mixed effect models. b, Immuno-fluorescence of NAMPT protein expression (N = 4 samples/group), scaled to connective tissue marker Lectin, paired student’s two-tailed t-test (left). Representative images of an obese and WL pair, scale bar 50 µm resolution, Grn NAMPT, Rd Lectin, blue DAPI nuclei. c, Left (All), tissue-wide senescence score (Oncogene induced), averaged across every cell for each participant (density, median IQR), then compared between conditions. Two-tailed Wilcoxon unpaired (LN-OB, LN-WL) and paired (OB-WL) P values. Right, density heatmaps of cell-level senescence scores (Oncogene induced) encompassing all cell types for each individual sample separated into Lean, Obese, WL groups, single nucleus datasets (N = 24 LN; 25 paired OB/WL donors). d, Other unbiased senescence score heatmaps across groups and vulnerable cell types. e, Proportion of p21 negative (−) and p21 positive (+) cells with high senescence scores (defined by score higher than median in ≥3 of 4 distinct senescence scores). Proportion presented for each sample (N = 87). Two-tailed Wilcoxon unpaired test. f, Proportion of p21 positive cells (range 0–1) in each cell state grouped by cell type. Stressed cell states coloured yellow, other cell states coloured dark grey. g, Mean proportions of p21 (range 0–1) positive cells in each sample across conditions in spatial datasets (N = 4/group). Boxplot, median IQR min/max. Two-tailed Wilcoxon unpaired (LN-OB) and paired (OB-WL) FDR adjusted P values. Separated into vulnerable cell types. h, Heatmap showing pairwise correlation (Pearson, R) between delta (Δ) changes in pathway scores before and after WL in paired samples. Pathway scores were calculated from the mean pathways score in mature adipocytes within each paired sample. i, Gene regulatory networks upregulated in stressed, senescent cells (scaled log2FC > 0.4 compared to all other cell states in cell type, and in ≥3 stressed cell states) and coloured by number of shared genes in the network (Jaccard index, top). Interactions between TFs within the network (bottom), sized by number of interactions with other TFs, connected by forward interactions, # annotates self-interaction, coloured by Walktrap community. j, Expression of secretory proteins from the Human Protein Atlas (HPA) in stressed compared to basal cell states among vulnerable cell types. Wilcoxon test, Log2FC (positive, stress-high) coloured by cell type, grey if non-secretory or non-significant (P > 0.05 Bonferroni adjusted). AREG which is not in the HPA was included as a well-established secreted protein. k, Scatter plot of 11 predicted SASP proteins present in both single nucleus and spatial datasets according to dataset log2FC in lean-obese and obese-WL comparisons (obese-high). Border coloured by comparison, fill coloured by SASP gene, shape by cell type. l, Senescence and SASP gene expression (imputed) in tissue niches, represented as a scaled z-score. Source data

References

    1. Lean, M. E. et al. Primary care-led weight management for remission of type 2 diabetes (DiRECT): an open-label, cluster-randomised trial. Lancet391, 541–551 (2018). - PubMed
    1. Look AHEAD Research Group et al.Association of the magnitude of weight loss and changes in physical fitness with long-term cardiovascular disease outcomes in overweight or obese people with type 2 diabetes: a post-hoc analysis of the Look AHEAD randomised clinical trial. Lancet Diabetes Endocrinol.4, 913–921 (2016). - PMC - PubMed
    1. Blüher, M. et al. New insights into the treatment of obesity. Diabetes, Obes. Metab.25, 2058–2072 (2023). - PubMed
    1. Klein, S., Gastaldelli, A., Yki-Järvinen, H. & Scherer, P. E. Why does obesity cause diabetes? Cell Metab.34, 11–20 (2022). - PMC - PubMed
    1. Phelps, N. H. et al. Worldwide trends in underweight and obesity from 1990 to 2022: a pooled analysis of 3663 population-representative studies with 222 million children, adolescents, and adults. Lancet403, 1027–1050 (2024). - PMC - PubMed

MeSH terms