. 2025 Jul;643(8073):943-949.
doi: 10.1038/s41586-025-09258-7. Epub 2025 Jul 9.

Single nuclear spin detection and control in a van der Waals material

Affiliations

Single nuclear spin detection and control in a van der Waals material

Xingyu Gao et al. Nature. 2025 Jul.

Abstract

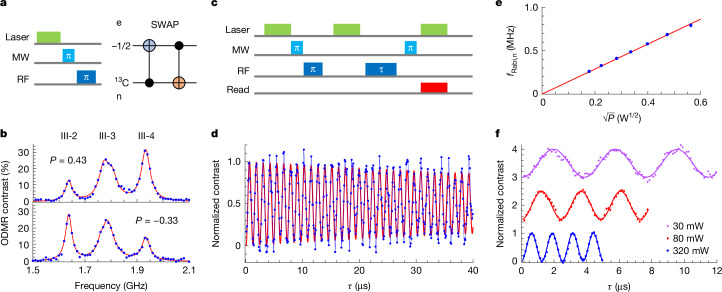
Optically active spin defects in solids1,2 are leading candidates for quantum sensing3,4 and quantum networking5,6. Recently, single spin defects were discovered in hexagonal boron nitride (hBN)7-11, a layered van der Waals (vdW) material. Owing to its two-dimensional structure, hBN allows spin defects to be positioned closer to target samples than in three-dimensional crystals, making it ideal for atomic-scale quantum sensing12, including nuclear magnetic resonance (NMR) of single molecules. However, the chemical structures of these defects7-11 remain unknown and detecting a single nuclear spin with a hBN spin defect has been elusive. Here we report the creation of single spin defects in hBN using 13C ion implantation and the identification of three distinct defect types based on hyperfine interactions. We observed both S = 1/2 and S = 1 spin states within a single hBN spin defect. We demonstrated atomic-scale NMR and coherent control of individual nuclear spins in a vdW material, with a π-gate fidelity up to 99.75% at room temperature. By comparing experimental results with density functional theory (DFT) calculations, we propose chemical structures for these spin defects. Our work advances the understanding of single spin defects in hBN and provides a pathway to enhance quantum sensing using hBN spin defects with nuclear spins as quantum memories.


Conflict of interest statement

Competing interests: The authors declare no competing interests.

Figures

Fig. 1
Fig. 1. Observation of three types of single spin defect in hBN.
a, Illustration of a carbon-related spin defect complex, consisting of an electron spin strongly coupled to a 13C nuclear spin and a nearby, weakly coupled electron spin without strong hyperfine interaction. b, PL confocal map showing isolated bright emitters in hBN. Scale bar, 2 μm. c, Energy-level diagram of an electron spin S = 1/2, coupled to a 13C nuclear spin (I = 1/2). Azz is the hyperfine interaction strength. ν1,e and ν2,e are the two electron spin transitions. df, Optical spectra of defects 1–3, belonging to groups I–III, respectively. gi, ODMR spectra of defects 1–3 under an out-of-plane external magnetic field of 62.5 mT. The number of peaks in the central region (shaded area) differs among groups I–III defects. Within this shaded area, the peaks correspond to the |−1/2⟩ ↔ |+1/2⟩ transitions, with hyperfine structures observed in groups II and III. Outside the shaded region, the transitions correspond to the |0⟩ ↔ |±1⟩ transitions. Furthermore, the defect in h exhibits a |−1⟩ ↔ |+1⟩ double-quantum transition (II-5). j, Illustration of the spin-pair model for explaining the coexistence of S = 1 and S = 1/2 transitions. k,l, Magnetic-field-dependent ODMR spectra of defect 2 in group II (k) and defect 3 in group III (l). a.u., arbitrary units. Source Data
Fig. 2
Fig. 2. Optical detection of 13C nuclear spins in hBN.
ac, ODMR contrast map of 13C-implanted hBN by driving a microwave at: 2.01 GHz, resonance I-2 of group I defects (a); 1.95 GHz, resonance II-2 of group II defects (b); and 1.86 GHz, resonance III-2 of group III defects (c). df, ODMR contrast map of 12C-implanted hBN by driving the microwave at: I-2 (d), II-2 (e) and III-2 (f). The contrast fluctuation outside the hBN is caused by the low photon counts collected from the background. Scale bars, 5 μm. A 71.5-mT magnetic field is applied out of plane (perpendicular to the hBN nanosheet). g, Illustration of the ODNMR sequence. h, An ODNMR spectrum of defect 2 by driving the microwave at II-2. i, An ODNMR spectrum of defect 3 by driving the microwave at III-4. Source Data
Fig. 3
Fig. 3. Initialization and coherent control of a 13C nuclear spin.
a, Illustration of the pulse sequence (left) for nuclear spin initialization. We use a SWAP gate (right) to transfer the electron spin polarization to the 13C nuclear spin. b, ODMR signal after nuclear spin initialization. One of the two peaks (III-2 and III-4) dominates, yielding a nuclear spin polarization of 0.43 (top) and −0.33 (bottom), depending on the direction of initialization. c, Pulse sequence for nuclear spin coherent control. d, An example of nuclear spin Rabi oscillation, persisting for 40 μs without significant decay. The blue curve is the experimental data and the red curve is fitting. e, Nuclear spin Rabi frequency as a function of the square root of the RF power. f, Nuclear spin Rabi oscillations taken at different RF powers. Source Data
Fig. 4
Fig. 4. Spin coherence of a 13C nuclear spin.
a, The pulse sequence of nuclear spin Ramsey interferometry. b, The nuclear spin Ramsey fringe. The measurements are performed when the RF frequency is in resonance with the nuclear spin transition (red squares) or slightly detuned from the resonance (blue dots). The fitting of the oscillation shows an inhomogeneous dephasing time of T2,n*=16.6 μs. c, The pulse sequence of nuclear spin Hahn echo. d, The nuclear spin Hahn echo measurement shows a slow decay with T2,n = 162 μs. Source Data
Fig. 5
Fig. 5. Candidates for the defect members in spin pairs.
a, Chemical structure, spin density and energy-level diagram of the positively charged CB+CN0-DAP-2 defect. b, Simulated ODMR spectrum of the positively charged CB+CN0-DAP-2 defect based on the calculated hyperfine coupling parameters. The simulation result (red curve) is compared with the experimental result (blue curve). c, Chemical structure, electronic wavefunction and energy-level diagram of the positively charged CBON defect. d, Simulated ODMR spectrum of the positively charged CBON defect based on the calculated hyperfine coupling parameters. The simulation result (red curve) is compared with the experimental result (blue curve). Source Data
Extended Data Fig. 1
Extended Data Fig. 1. Spin-pair model.
a, Two possible electron configurations of a spin defect complex in different internal charge states. b, The energy levels of internal charge states according to the DFT prediction. When two electrons occupy the same defect site (left), it forms a singlet GS and ES, as well as a triplet metastable state. When two electrons locate at different defect sites (right), each form a S = 1/2 state and they are weakly coupled through dipolar interaction, forming a spin S = 1/2 pair. c, A proposed energy-level diagram for explaining the coexistence of the S = 1/2 and S = 1 ODMR transitions.

References

    1. Atatüre, M., Englund, D., Vamivakas, N., Lee, Sang-Yun & Wrachtrup, J. Material platforms for spin-based photonic quantum technologies. Nat. Rev. Mater.3, 38–51 (2018).
    1. Wolfowicz, G. et al. Quantum guidelines for solid-state spin defects. Nat. Rev. Mater.6, 906–925 (2021).
    1. Degen, C. L., Reinhard, F. & Cappellaro, P. Quantum sensing. Rev. Mod. Phys.89, 035002 (2017).
    1. Du, J., Shi, F., Kong, X., Jelezko, F. & Wrachtrup, J. Single-molecule scale magnetic resonance spectroscopy using quantum diamond sensors. Rev. Mod. Phys.96, 025001 (2024).
    1. Pompili, M. et al. Realization of a multinode quantum network of remote solid-state qubits. Science372, 259–264 (2021). - PubMed

LinkOut - more resources