. 2025 Sep;645(8080):429-438.
doi: 10.1038/s41586-025-09270-x. Epub 2025 Jul 9.

A haplotype-resolved pangenome of the barley wild relative Hordeum bulbosum

Affiliations

A haplotype-resolved pangenome of the barley wild relative Hordeum bulbosum

Jia-Wu Feng et al. Nature. 2025 Sep.

Abstract

Wild plants can contribute valuable genes to their domesticated relatives1. Fertility barriers and a lack of genomic resources have hindered the effective use of crop-wild introgressions. Decades of research into barley's closest wild relative, Hordeum bulbosum, a grass native to the Mediterranean basin and Western Asia, have yet to manifest themselves in the release of a cultivar bearing alien genes2. Here we construct a pangenome of bulbous barley comprising 10 phased genome sequence assemblies amounting to 32 distinct haplotypes. Autotetraploid cytotypes, among which the donors of resistance-conferring introgressions are found, arose at least twice, and are connected among each other and to diploid forms through gene flow. The differential amplification of transposable elements after barley and H. bulbosum diverged from each other is responsible for genome size differences between them. We illustrate the translational value of our resource by mapping non-host resistance to a viral pathogen to a structurally diverse multigene cluster that has been implicated in diverse immune responses in wheat and barley.


Conflict of interest statement

Competing interests: The authors declare no competing interests.

Figures
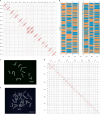
Fig. 1
Fig. 1. Haplotype-resolved assembly of diploid and tetraploid H.bulbosum genomes.
a, Diploid Hi-C contact matrix of the FB19-011-3 genome assembly. b, Graphical genotypes constructed from single-nucleus sequence data of FB19-011-3 pollen. Blue colour, haplotype 1; orange colour, haplotype 2. c, Haplotype-specific oligonucleotide-based FISH in mitotic chromosomes of FB19-011-3. The red and green probes target haplotypes 1 and 2, respectively, of chromosome 5H. At least two independent experiments were carried out to confirm the reproducibility of the labelling patterns. Scale bar, 10 μm. d, Hi-C contact matrix of the sequence assembly of the tetraploid clone FB19-028-3. e, Haplotype-specific oligonucleotide-based FISH in mitotic chromosomes of FB19-028-3. The red, green, blue and yellow probes target haplotypes 1, 2, 3 and 4, respectively, of chromosome 5H. At least two independent experiments were carried out to confirm the reproducibility of the labelling patterns. Scale bar, 10 μm.
Fig. 2
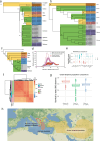
Fig. 2. A pangenome of 32 haplotypes from diploid and tetraploid H.bulbosum clones.
a, GENESPACE synteny plot between 32 H.bulbosum haplotypes. Grey bars represent chromosomes and are scaled according to the number of genes with syntenic alignments to other genomes. H1–H4 denote haplotypes 1–4. b, Pangenome complexity estimated by single-copy k-mers. The curves trace the growth of non-redundant single-copy sequences as sample size increases. Error bars were derived from 100 ordered permutations each. The central line represents the median; the box spans the interquartile range, from the first quartile to the third quartile and whiskers extend to the most extreme values within 1.5× the interquartile range from the quartiles. c, Composition of core, shell and cloud single-copy sequences in accession-level pangenomes. d, Summary of haplotype-specific single-copy core sequences for each accession. These core sequences were assigned to chromosomal locations, but not present in all haplotypes within each accession.
Fig. 3
Fig. 3. Evolution of TEs and genome size in H.bulbosum and H.vulgare.
a, Absolute content of Copia and Gypsy elements along the genomes of both species. Each sequence assembly was divided into 100 bins of equal size. The grey shading indicates the 95% confidence interval. b, Local rates of genome size change between H.vulgare and H.bulbosum. c, Schema showing the partitioning into regions where either the H.bulbosum or the H.vulgare genome is locally expanded. d, Repeat content in these partitions. e, Distribution of insertion times of full-length Copia and Gypsy elements.
Fig. 4
Fig. 4. Multiple origins of tetraploid cytotypes.
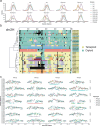
a, The upper panel shows the neighbour-joining tree of the 270 H.bulbosum genotypes. The background color of the tree indicates geographic origin. The colors of the middle bar plot indicate ploidy. Group 1 comprises samples from Armenia, Bulgaria, Tajikistan, Turkey, Ukraine and Uzbekistan and those of unknown provenance. The lower panel is the model-based ancestry estimation with ADMIXTURE. The bar plot shows the ancestry coefficent with K = 4 populations. bd, Population size trajectories as inferred by pairwise sequentially Markovian coalescent analysis of heterozygous genomes (four diploid genomes (b); the Greek diploid FB19-011-3, the Greek tetraploid FB19-001-1 and synthetic diploids between them (c); and FB19-011-3, the tetraploid GRA2256-1 from Tajikistan and synthetic diploids (d)). Generation time = 2 years; mutation rate = 0.7 × 10⁻⁸ per site per generation. e, Map depicting the collection sites of Greek tetraploids. Pie charts show the ADMIXTURE ancestry coefficients. The base map was created using tiles provided by Stadia Maps, styled by Stamen Design, and incorporating geographic data from OpenStreetMap contributors via OpenMapTiles. Map data © OpenStreetMap contributors, licensed under the Open Database License; visual design © Stamen Design, licensed under CC BY 3.0; map tiles © Stadia Maps, licensed under CC BY 4.0. f, AHGs as inferred by IntroBlocker. The bar plots show the proportion of each H.bulbosum genome that is assigned to one of four AHGs.
Fig. 5
Fig. 5. The H.bulbosum pangenome supports introgression breeding in barley.
a, Introgressed regions of the H.bulbosum genome in barley, shown by the number of lines carrying each 1-Mb segment. b, Heat map showing similarity of introgressed segments to four A17 haplotypes from the H.bulbosum pangenome. IBS, identity-by-state. c, Number of NLR genes annotated in barley and H.bulbosum haplotypes. d, Schematic of the recombined haplotype in IL JKI-5215 (barley cv. Igri background). e, PCA of A17 haplotypes 3 and 4 on chromosome 3H, using Hi-C link matrices to distinguish contigs near introgressed regions. R3 corresponds to contigs that are in the region of A17 haplotype 3, co-linear to the JKI-5215 introgressed region. R4 corresponds to contigs that are in the region of A17 haplotype 4, co-linear to the JKI-5215 introgressed region. PC1, principal component 1. f, Hi-C contact matrix of the A17 region co-linear to the JKI-5215 introgressed segment. g, Microsynteny comparison of the Sr35 and Ryd4Hb resistance loci. The upper panel shows long-range synteny among Igri, A17, Triticum monococcum TA10622 and JKI-5215; the lower panel compares local gene order and content between H.vulgare cv. Igri and A17 haplotype 4. Genes are colour-coded: yellow, S-formylglutathione hydrolase-like; purple, ankyrin-repeat proteins; green, complete NLRs; white/green outline, partial NLRs. Sr35 is marked in red. Syntenic links (≥ 80% nucleotide identity) are colour-coded by gene family.
Extended Data Fig. 1
Extended Data Fig. 1. Pipeline for haplotype-resolved genome assembly.
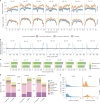
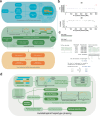
(a) Flowchart of the diploid phasing pipeline. (b) Example of haplotype separation by PCA in diploid samples. An identity-by-descent region has double coverage in the unphased contig-level assembly. (c) Schematic overview of the pipeline for estimating phasing error rates from single pollen nuclei sequencing data. (d) Flowchart of the tetraploid phasing pipeline.
Extended Data Fig. 2
Extended Data Fig. 2. Extra-terminal crossovers occur in H. bulbosum more often than in H. vulgare.
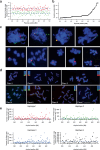
(a) Representative examples of ring bivalents with interstitial (i), subterminal (s), terminal (t) and extra-terminal (et) chiasmata as calculated in (b). (b) Proportion of each type of chiasma based on the classification shown in (a). Number of cells scored from three independent plants: Barke: 110; Morex: 140; FB19_011_3: 120; FB20_005_1: 112; FB20_029_7: 104. (c) Representative examples of meiotic cells at metaphase I stage of H. vulgare cultivars “Barke” and “Morex” and H. bulbosum genotype FB19-011-3 showing different bivalent configurations and chiasma positions as calculated in b. (d) FISH with 5S and 45S rDNA (green) and HvT01 (subtelomeric; red) on metaphase I cells. 26 cells analyzed from two independent plants. One chromosome pair (arrowhead) showed extra-terminal chiasmata in 19 out of 26 cells analysed. Asterisks: extra-terminal chiasmata. Size bar = 10 μm.
Extended Data Fig. 3
Extended Data Fig. 3. Design of oligo-FISH probes.
(a) Haplotype-specific single-copy sequence in 1 Mb bins at the distal end of the long arm of chromosome 5H in FB19-011-3. (b) Relationship between the genetic and physical maps of the long arm of chromosome 5H. (c) Meiotic dynamics of chromosome 5H homologs. From left to right, top: leptotene, zygotene, and pachytene, diplotene. Haplotype 1 (green) and haplotype 2 (red) initially unpaired come in close apposition until becoming physically connected in synapsed chromosomes; bottom: metaphase I, early anaphase I, and three examples of late anaphase I showing the presence or absence of recombination between haplotypes 1 and 2. At least two independent experiments were carried out to confirm the reproducibility of the labeling patterns. Size bar = 10 μm. (d) Meiotic crossovers revealed by chromosome painting. Mitotic chromosomes of seven selfed offspring of the diploid H. bulbosum genotype FB19-011-3 after FISH with haplotype-specific probes. Explanatory graphical genotypes are shown in the top-right corners of each subpanel. At least two independent experiments were carried out to confirm the reproducibility of the labeling patterns. Size bar = 10 μm. (e) Haplotype-specific single-copy sequence in 1 Mb bins at the distal end of the long arm of chromosome 5H in FB19-028-3.
Extended Data Fig. 4
Extended Data Fig. 4. A pangenome selection in global H. bulbosum clones.
(a, b, c) Principal component analysis (PCA) of 270 H. bulbosum genotypes. (a) Positions of the ten selected pangenome accessions in the PCA diversity space. The samples are colored according to country of origin (b) or ploidy (c). (d) Geographic map showing the origins of 260 individuals subjected to genotyping-by-sequencing. Information was aggregated at the country level. (e) Map showing the geographic origins of seven H. bulbosum clones that are part of the pangenome. The collection sites of another three accessions are unknown. Colors indicate ploidy. For d,e, the base map was created using tiles provided by Stadia Maps, styled by Stamen Design, and incorporating geographic data from OpenStreetMap contributors via OpenMapTiles. Map data © OpenStreetMap contributors, licensed under the Open Database License; visual design © Stamen Design, licensed under CC BY 3.0; map tiles © Stadia Maps, licensed under CC BY 4.0.
Extended Data Fig. 5
Extended Data Fig. 5. Haplotype phasing of autotetraploid H. bulbosum genomes.
(a) Distribution of sequence coverage of contigs in the unphased assembly. Contigs that are shared between two haplotypes have double coverage (right-hand peak). (b) PCA clustering of the matrix of Hi-C links connecting the ends of contigs, i.e. those mapped to within 2 Mb of either contig end. Chromosome 1H of the tetraploid clone FB19-028-3 is shown. Colors correspond to coverage brackets. The contigs with double coverage (shown in blue) correspond to IBD regions shared between two haplotypes. (c) PCA separation and contig-level coverage on chromosome 1H of FB19-028-3 after pseudomolecule construction and manual curation. Pairwise differences between the four haplotypes are shown.
Extended Data Fig. 6
Extended Data Fig. 6. Structural variation in H. bulbosum.
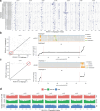
(a) Genome-wide map of polymorphic inversions longer than 2 Mb. (b, c) Genetic validation of inversions between the haplotypes FB19-011-3 on chromosomes 1H (b) and 4H (c). The left-hand panels show chromosome-level alignments between both haplotypes. Red circles mark the inversions in question. The inversions were identified by SYRI in wfmash whole-genome alignments (top-right subpanels). The bottom-right subpanels show the correspondence between the physical and genetic maps. (d) Distribution of indels, SNPs and small (≥40 bp and ≤20 kb) SVs along the H. bulbosum genome.
Extended Data Fig. 7
Extended Data Fig. 7. Pangenome analysis of H. bulbosum.
(a) Heatmap showing the similarity of k-mer hashes of H. vulgare and H. bulbosum genome sequences. (b) The cumulative size of single-copy regions in genome assemblies of 10 H. bulbosum genomes. The curves trace the growth of non-redundant single-copy sequences as sample size increases. Error bars derived from 100 ordered permutations each. The central line represents the median; the box spans the interquartile range (IQR), from the first quartile to the third quartile. Whiskers extend to the most extreme values within 1.5 × IQR from the quartiles. (c) Composition of core, shell, and cloud single-copy sequences in the haplotype-level pangenomes. (d) Summary of the H. bulbosum graph pangenome constructed by the Minigraph-Cactus pangenome pipeline. (e) Composition of core, shell, and cloud sequences in the haplotype-level graph-based pangenome. (f) Bar chart illustrating the proportion of genes contained in core, shell and cloud OGs (see Methods for details) by genotype. (g) Bar chart illustrating the number of H. bulbosum genotypes represented in the individual OGs. The x-axis gives the number of genotypes included in an OG. The pie chart provides ratios of conserved and variable genes for all 10 genotypes.
Extended Data Fig. 8
Extended Data Fig. 8. Evolution of TEs in H. bulbosum and H. vulgare.
(a) Size and composition of the repetitive portion of the H. bulbosum and H. vulgare genomes. Haplotype 1 of each H. bulbosum genome is shown. (b) Heatmap constructed from a matrix tabulating the abundance of 989 TEs representatives from the TREP database. (c) Subsets of abundance matrix for the 13 most variable TE representatives. Numbers in the boxes and the color code refer to the cumulative lengths of TE sequences assigned to each representative per haplotype. (d) Approximately maximum-likelihood phylogenetic trees for all full-length BARE-1 elements in H. vulgare and H. bulbosum. (e) Distribution of the insertion times of all full-length BARE-1 elements in H. vulgare and H. bulbosum. (f) Distribution of the insertion times of all full-length Sabrina elements in H. vulgare and H. bulbosum. (g) Two-dimensional density plot showing the relationship between insertion time and genomic position of Gypsy elements. (h) Two-dimensional density plot showing the relationship between insertion time and genomic position of Copia elements.
Extended Data Fig. 9
Extended Data Fig. 9. Relationships within H. bulbosum.
(a) Neighbor-joining tree constructed from a genome-wide SNP matrix (variant calling by deepvariant long reads pipeline) of 32 H. bulbosum haplotypes and one H. vulgare genome. Geographic origins and ploidy are color-coded. (b) Neighbor-joining tree constructed from graph pangenome similarity from ODGI (c) Maximum likelihood (ML) tree constructed from the whole chloroplast genomes of 32 H. bulbosum individuals and one H. vulgare individual. The wheat chloroplast genome was included as an outgroup. (d) Population trajectory as inferred by PSMC of the Libyan diploid PI365428, diploids from other countries, autotetraploids, and synthetic heterozygotes between the Libyan diploid and other diploid and tetraploid haplotypes. (e) Genetic distance of PI365428 to other populations. (f) Heatmap showing the identity-by-state (IBS) distance matrix between 270 H. bulbosum and 3 H. vulgare genotypes. (g) Genetic distance of the Greek tetraploid populations. The central line represents the median; the lower and upper edges of the box correspond to the first (Q1) and third quartiles (Q3), respectively. The interquartile range (IQR) is defined as Q3 − Q1. Whiskers extend to the most extreme data points within 1.5 × IQR from the quartiles. Data points beyond this range are plotted individually as outliers. (h) The diagram of the hypothesis of at least two origins. The base map was created using tiles provided by Stadia Maps, styled by Stamen Design, and incorporating geographic data from OpenStreetMap contributors via OpenMapTiles. Map data © OpenStreetMap contributors, licensed under the Open Database License; visual design © Stamen Design, licensed under CC BY 3.0; map tiles © Stadia Maps, licensed under CC BY 4.0.
Extended Data Fig. 10
Extended Data Fig. 10. Haplotype definition with IntroBlocker.
(a) Distribution of pairwise genetic distances in 5 Mb bins. Each subpanel shows the pairwise comparison of the haplotypes of one genome to the haplotypes of all other genomes. The distribution of pairwise distance revealed two major peaks (gray dashed line), one at 0.0095 variants per bp, and the other at 0.0145 variants per bp. A threshold of 0.011 was used to differentiate between these two peaks in IntroBlocker (red dashed line). (b) Graphical genotypes on chromosomes 2H and 4H. Regions of identical colors are assigned to the same haplotype at the chosen identity threshold (0.011). (c) Genetic distances between haplotypes of A40 and A42. Pairwise genetic distance between the haplotypes of A40 and A42 were plotted along the genome in 5 Mb windows.
Extended Data Fig. 11
Extended Data Fig. 11. Genomic characterization of H. vulgare-H. bulbosum introgression lines and their H. bulbosum parents.
(a) Identification and mapping of alien chromatin in the introgression line sample 270147. (b) Genome-wide distribution of resistance genes homolog of the NLR family in FB19-011-3. NLR numbers were tabulated in 1 Mb windows along the genome. (c) Identity-by-descent between the three donor genotypes A17, A40 and A42 and other populations point to a central Asian origin. (d) NLR numbers in the Ryd4 interval in H. bulbosum haplotypes and selected H. vulgare genomes. (e) Distribution of putative deleterious SNPs in H. bulbosum genomes. In d and e, the central line represents the median; the lower and upper edges of the box correspond to the first (Q1) and third quartiles (Q3), respectively. The interquartile range (IQR) is defined as Q3 − Q1. Whiskers extend to the most extreme data points within 1.5 × IQR from the quartiles. Data points beyond this range are plotted individually as outliers.

References

    1. Bohra, A. et al. Reap the crop wild relatives for breeding future crops. Trends Biotechnol.40, 412–431 (2022). - PubMed
    1. Haas, M. & Mascher, M. Use of the secondary gene pool of barley in breeding improved varieties. Burleigh Dodds Chapters Online10.19103/AS.2019.0051.02 (2019).
    1. Frankel, O. H. Genetic conservation: our evolutionary responsibility. Genetics78, 53–65 (1974). - PMC - PubMed
    1. Zhu, G. et al. Rewiring of the fruit metabolome in tomato breeding. Cell172, 249–261 (2018). - PubMed
    1. Hardigan, M. A. et al. Genome diversity of tuber-bearing Solanum uncovers complex evolutionary history and targets of domestication in the cultivated potato. Proc. Natl Acad. Sci. USA114, E9999–E10008 (2017). - PMC - PubMed

Substances

LinkOut - more resources