. 2025 Sep;645(8080):466-474.
doi: 10.1038/s41586-025-09246-x. Epub 2025 Jul 9.

Coenzyme Q headgroup intermediates can ameliorate a mitochondrial encephalopathy

Affiliations

Coenzyme Q headgroup intermediates can ameliorate a mitochondrial encephalopathy

Guangbin Shi et al. Nature. 2025 Sep.

Abstract

Decreased brain levels of coenzyme Q10 (CoQ10), an endogenously synthesized lipophilic antioxidant1,2, underpin encephalopathy in primary CoQ10 deficiencies3,4 and are associated with common neurodegenerative diseases and the ageing process5,6. CoQ10 supplementation does not increase CoQ10 pools in the brain or in other tissues. The recent discovery of the mammalian CoQ10 headgroup synthesis pathway, in which 4-hydroxyphenylpyruvate dioxygenase-like protein (HPDL) makes 4-hydroxymandelate (4-HMA) to synthesize the CoQ10 headgroup precursor 4-hydroxybenzoate (4-HB)7, offers an opportunity to pharmacologically restore CoQ10 synthesis and mechanistically treat CoQ10 deficiencies. To test whether 4-HMA or 4-HB supplementation promotes CoQ10 headgroup synthesis in vivo, here we administered 4-HMA and 4-HB to Hpdl-/- mice, which model an ultra-rare, lethal mitochondrial encephalopathy in humans. Both 4-HMA and 4-HB were incorporated into CoQ9 and CoQ10 in the brains of Hpdl-/- mice. Oral treatment of Hpdl-/- pups with 4-HMA or 4-HB enabled 90-100% of Hpdl-/- mice to live to adulthood. Furthermore, 4-HB treatment stabilized and improved the neurological symptoms of a patient with progressive spasticity due to biallelic HPDL variants. Our work shows that 4-HMA and 4-HB can modify the course of mitochondrial encephalopathy driven by HPDL variants and demonstrates that CoQ10 headgroup intermediates can restore CoQ10 synthesis in vivo.


Conflict of interest statement

Competing interests: G.S., Q.S., R.S.B. and M.E.P. are co-inventors on patents related to the use of 4-HMA, 4-HB and analogues in the diagnosis and treatment of neurodevelopmental and other diseases assigned to New York University. M.E.P. directly supervised the preclinical research. The treatment was conducted and supervised by C.M. and G.M.R. under an institutional conflict-of-interest management plan designed and implemented by NYU Langone Health in accordance with its policies. M.E.P. consulted on the clinical protocol and C.M. and G.M.R. directed the course of treatment in accordance with the institutional plan. Financial support for the clinical treatment was provided by the Pershing Square Foundation. The other authors declare no competing interests.

Figures
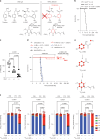
Fig. 1
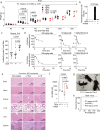
Fig. 1. CoQ headgroup intermediates improve Hpdl−/− mouse survival and are incorporated into brain CoQ.
a, The mammalian CoQ headgroup synthesis pathway. Left, tyrosine is deaminated to 4-hydroxyphenylpyruvate (4-HPPA). HPDL converts 4-HPPA to 4-HMA, which generates 4-HB. Right, supplementation of 4-HMA or 4-HB compensates for loss of HPDL activity. The carbon atoms from 4-HMA or 4-HB that enter the CoQ headgroup are highlighted in red. TAT, tyrosine aminotransferase. b, Hpdl−/− pups die by P15. Hpdl+/+ and Hpdl+/− pups survive for more than one year. c, Hpdl−/− pups (n = 6) have lower plasma 4-HMA than Hpdl+/+ (n = 6) or Hpdl+/− (n = 8) pups on P10. Data are mean ± s.d. d, Oral supplementation of 4-HMA and 4-HB (10 mg kg−1 per day) improves the overall survival of Hpdl−/− pups. CoQ9, CoQ10 and related compounds do not improve Hpdl−/− pup survival. Treatment with 4-HMA and 4-HB was carried out until P30. 4-HMA-treated pups began treatment on P3–P5 except for three that began on P6 and one that began on P7. 4-HB-treated pups began treatment on P3–P5. e, Schematic of 13C incorporation from 13C6-4-HMA and 13C6-4-HB into CoQ9 or CoQ10, increasing the mass of the product by 6 Da (m6). n = 9 or 10. f, Fractional labelling of brain CoQ9 and CoQ10 in mice fed 13C6-4-HMA and 13C6-4-HB (10 mg kg−1 once daily) from P3 to P20. Both 13C6-4-HMA and 13C6-4-HB are incorporated into 13C6-CoQ9 (m6) and 13C6-CoQ10 (m6) in Hpdl−/− mice. Data are mean ± s.d. 13C6-4-HMA: Hpdl+/+ n = 3, Hpdl+/− n = 6 and Hpdl−/− treated n = 5. 13C6-4-HB: Hpdl+/+ n = 3, Hpdl+/− n = 4 and Hpdl−/− treated n = 3. Hpdl−/− untreated n = 3. CoQ9 and CoQ10 data from Hpdl−/− untreated mice were obtained in the 4-HMA experiment and are presented in a faded shade of colour in the 4-HB experiment for ease of interpretation. Significance was tested by two-way analysis of variance (ANOVA) followed by Tukey’s post hoc test. P values < 0.05 are presented on each plot. Survival data were analysed with the log-rank test. Source data
Fig. 2
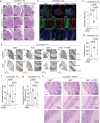
Fig. 2. 4-HMA supplementation improves cerebellar histology in Hpdl−/− mice.
a, Representative electron micrographs of the cerebella of P11 Hpdl+/+, Hpdl+/− and Hpdl−/− mouse pups reveal substantial changes in cerebellar mitochondrial morphology. The mitochondria (marked by arrowheads) in Hpdl+/+ and Hpdl+/− mouse pups are intact, whereas those in the cerebella of Hpdl−/− mouse pups are fragmented. Supplementing Hpdl−/− mice with 10 mg kg−1 4-HMA starting on P2–3 (Hpdl−/− + 4-HMA) restores cerebellar mitochondrial ultrastructure. Dashed boxes indicate area of interest highlighted in the second row. Scale bars, 1 μm. b, Quantification of mitochondrial perimeter in electron micrographs of the cerebella of P11 Hpdl+/+, Hpdl+/− and Hpdl−/− mouse pups as well as P11 Hpdl−/− mouse pups treated with 4-HMA. Mitochondria in the Hpdl−/− mouse pups are smaller than those of the Hpdl+/+ and Hpdl+/− pups. 4-HMA treatment increases the size of the mitochondria in the Hpdl−/− pups, although not to the same size of mitochondria in Hpdl+/+ pups. n = 117 (Hpdl+/+), 227 (Hpdl+/−), 677 (Hpdl−/−) and 258 (Hpdl−/− + 4-HMA). c, P11 Hpdl−/− pups have marked cerebellar atrophy with PCs (arrowheads) showing vacuolization and intracellular oedema, thinning of the inner granular layer (IGL) and molecular layer and compaction of the external granular layer (EGL). These abnormalities are improved to near-wild-type morphology by supplementation with 4-HMA starting on P2–3 (Hpdl−/− + 4-HMA). Dashed boxes indicate area of interest highlighted in the next row. Scale bars, 500 μm (top row); 125 μm (middle row); 62.5 μm (bottom row). Raw data and means are shown. P values are indicated on each plot. P values > 0.05 are not shown. For b, significance was tested by two-way ANOVA followed by Tukey’s post hoc test. Source data
Fig. 3
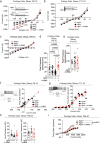
Fig. 3. 4-HMA improves PC function and behavioural phenotypes of Hpdl−/− mice.
a, Electron flow in cerebellar mitochondria from P9 Hpdl+/+, Hpdl+/− and Hpdl−/− pups as well as P9 4-HMA-treated Hpdl−/− pups. Electron flow through complexes I and II is impaired in Hpdl−/− mice and is restored by 4-HMA treatment. There was a non-statistically significant decrease in electron flow, rescued by 4-HMA, through complex IV. n = 5 animals for all groups. OCR, oxygen consumption rate. b, Patch-clamping of PCs in brain slices from P8–10 pups increases input resistance (Ri) and decreases membrane capacitance (Cm) in PCs from Hpdl−/− pups relative to PCs from Hpdl+/+ and Hpdl+/− pups. (Hpdl+/+, n = 20; Hpdl+/−,, n = 20; Hpdl−/−, n = 20; 4-HMA-treated Hpdl−/−, n = 18). c, 4-HMA supplementation restores input resistance and membrane capacitance of PCs from Hpdl−/− pups to levels comparable to those in Hpdl+/+ and Hpdl+/− pups on P17–19. (Hpdl+/+, n  = 13; Hpdl+/−, n = 10; 4-HMA-treated Hpdl−/−, n = 12). d, 4-HMA-treated 8–10-week-old Hpdl−/− mice have reduced gait regularity relative to Hpdl+/+ and Hpdl+/− mice. There were no differences in gait speed between the groups. e,f, 4-HMA-treated 8–10-week-old Hpdl−/− mice have similar performance to Hpdl+/+ and Hpdl+/− mice in the pole test (e) and the transverse beam test (f). g, Forelimb grip strength (left) is decreased in 8–10-week-old Hpdl+/− and 4-HMA-treated Hpdl−/− mice relative to Hpdl+/+ mice. All-limb grip strength (right) is similar in all groups. For behavioural tests, data from male mice (n: Hpdl+/+ = 4, Hpdl+/− = 5, 4-HMA-treated Hpdl−/− = 4) are plotted as triangles. Data from female mice (n: Hpdl+/+ = 4, Hpdl+/− = 2, 4-HMA-treated Hpdl−/− = 5) are plotted as circles. Behavioural data do not include untreated Hpdl−/− mice. Data are mean ± s.e.m. as well as raw data. For box-and-whisker plots, the centre is the median, the box bounds are the 25th to 75th percentiles and whiskers indicate minimum to maximum. Significance was tested by two-way ANOVA with Tukey’s post hoc test. Source data
Fig. 4
Fig. 4. Treatment of a single patient with HPDL encephalopathy with the CoQ10 headgroup intermediate 4-HB.
a, Pedigree of a patient with biallelic HPDL variants treated with 4-HB. The patient had two younger siblings who died in infancy; the second child shared the same genotype. b, Decrease in the Modified Ashworth Scale, a validated measure of spasticity, over the initial treatment course. Lack of spasticity = 0. Mitochondrial diseases generally show stability or increases in the Modified Ashworth Scale over time. c, Decrease in the Spastic Paraplegia Rating Scale (SPRS), a measure of spasticity and its effects on quality of life, over the treatment course to date. Mitochondrial diseases generally show stable or increased SPRS scores over time. Source data
Extended Data Fig. 1
Extended Data Fig. 1. Related to Fig. 1: mammalian CoQ headgroup intermediates improve the survival of Hpdl−/− mice and are incorporated into mouse brain CoQ9 and CoQ10 in vivo.
a, Hpdl−/− pups (n = 5) exhibit significant weight loss by post-natal day 10 (P10) relative to Hpdl+/+ (n = 8) and Hpdl+/− (n = 6) pups. Treatment of Hpdl−/− pups with 4-HMA (n = 4), the product of HPDL, and 4-HB (n = 5), the immediate precursor of the CoQ headgroup, results in weight gain similar to Hpdl+/− pups after P9. Error bars represent median ± interquartile range. b, Seizure frequencies in pups. All Hpdl−/− pups (n = 6) have observed seizures. No Hpdl+/+ (n = 6) or Hpdl+/− (n = 8) pups had observed seizures. Treatment with 4-HMA reduced the number of Hpdl−/− pups with seizures to 6 out of a total of 93 treated Hpdl−/− pups. c, Lactate/pyruvate ratio in plasma from Hpdl+/+ (n = 8), Hpdl+/− (n = 8), and Hpdl−/− (n = 5) pups. Hpdl−/− pups have a higher lactate/pyruvate ratio than Hpdl+/+ and Hpdl+/− pups. d, Pharmacokinetic data for 4-HMA and 4-HB at 500 mg kg−1 orally and 1 mg kg−1 intravenously. Error bars represent mean ± standard deviation for data from 3 mice. e, Long-term toxicity histology for 4-HMA and 4-HB administered orally for 3 months at 500 mg kg−1 per day. No inflammation or necrosis were observed in the brain, heart, kidneys, liver, lungs, or spleen from untreated, 4-HMA, or 4-HB-treated mice. Sections are representative of n = 4 mice in each group. f, Plasma concentrations of 4-HMA in P10 Hpdl−/− pups treated with 10 mg kg−1 per day, orally administered 4-HMA starting at P3. Plasma 4-HMA concentrations are higher in treated Hpdl−/− pups than in Hpdl+/+, Hpdl+/−, and untreated Hpdl−/− pups. Hpdl+/+, Hpdl+/−, and Hpdl−/− pup data were obtained for Fig. 1c and are presented in a faded shade for ease of interpretation. 4-HMA-treated Hpdl−/− pup n = 7. g, Hpdl−/− pups can stand 3 days after supplementation with 4-HMA (10 mg/kg/day, oral administration). h, Survival of Hpdl−/− pups treated on P7 or P10. Hpdl−/− pups treated by postnatal day 7 (n = 32) survive into adulthood. Treatment of Hpdl−/− pups at 10 days after birth (n = 4) does not improve their survival. Significance was tested by two-way analysis of variance (ANOVA) followed by Tukey’s post-hoc test. Source data
Extended Data Fig. 2
Extended Data Fig. 2. Related to Fig. 1: CoQ concentrations in the brains of pups and P90 mice following 4-HMA and 4-HB treatment.
a, CoQ9 and CoQ10 concentrations from mouse brains following treatment with 13C6-4-HMA or 13C6-4-HB starting at postnatal day 3. 13C6-4-HMA and 13C6-4-HB are incorporated into CoQ9 and CoQ10 in Hpdl−/− mice, and increase brain CoQ9 and CoQ10 pools relative to untreated Hpdl−/− mice. 13C6-4-HMA and 13C6-4-HB are minimally incorporated into CoQ9 and CoQ10 in Hpdl+/+ mice and are incorporated into CoQ9 and CoQ10 at low fractions in Hpdl+/− mice. 13C6-4-HMA: Hpdl+/+ n = 3, Hpdl+/− n = 6, and Hpdl−/− treated n = 5. 13C6-4-HB: Hpdl+/+ n = 3, Hpdl+/− n = 4, and Hpdl−/− treated n = 3. Hpdl−/− untreated n = 3. CoQ9 and CoQ10 data from Hpdl−/− untreated mice were obtained in the 4-HMA experiment and are presented in a faded shade of color in the 4-HB experiment for ease of interpretation. b, CoQ9 and CoQ10 concentrations from the cortex and cerebellum of mice treated with 13C6-4-HMA from P2-P30 and sacrificed at P90. The concentrations of CoQ9 and CoQ10 in the brains of treated Hpdl−/− mice are ~50% of the concentrations of these molecules in the brains of Hpdl+/+ mice. Only a minor fraction of CoQ9 and CoQ10 is labeled with 13C. Hpdl+/+ n = 3, Hpdl+/− n = 3, and Hpdl−/− treated n = 3. c, CoQ9 and CoQ10 concentrations from the brains of P90 wild-type mice that were not treated with 4-HMA, or treated with 4-HMA from P2-P30. 4-HMA does not increase the brain concentrations of CoQ9 and CoQ10 in wild-type mice. Significance was tested by two-way analysis of variance (ANOVA) followed by Tukey’s post-hoc test. Source data
Extended Data Fig. 3
Extended Data Fig. 3. Related to Fig. 2: 4-HMA supplementation improves the histologic appearances of the brains of Hpdl−/− mice.
a, Hematoxylin and eosin staining of cerebellar samples from P6 Hpdl+/+, Hpdl−/−, and Hpdl−/− mice treated with 4-HMA (Hpdl−/− + 4-HMA). Three Hpdl+/+ (A, D and G), Hpdl−/− (B, E and H) and Hpdl−/− + 4-HMA (C, F and I) samples were analyzed to determine the reproducibility of the phenotype. Hpdl−/− mouse cerebella have pronounced atrophy that is partially rescued after 4-HMA treatment. b, Immunostaining for PAX6 (green) and Calbindin (red) on mid-sagittal sections of P6 cerebella from Hpdl+/+, Hpdl−/−, and Hpdl−/− mice treated with 4-HMA from P2-3 (Hpdl−/− + 4-HMA) (Panels A-C). Nuclei were counterstained with Hoechst (blue). Panels D-I are higher-magnification views of the boxed area in each image above with single-channel PAX6 (green) and Calbindin (red) staining. PAX6 stanning of granule cells shows that the EGL and IGL are depleted in the Hpdl−/− cerebella (Panel F compared to D, H). Calbindin staining of Purkinje cells shows the cells form a multilayer in Hpdl−/− cerebella (panel G). Purkinje cells form a single layer following 4-HMA treatment, but dendrites are stunted (panel I). Panels J-L contain lobule 3 from mid-sagittal cerebellar sections immunostained for Hoechst (blue) and TUNEL (yellow), showing an increase in cell death in Hpdl−/− cerebella (panel K) compared to control cerebella (panel J). 4-HMA treatment decreases cell death (Panel L). The white dashed line delineates the external granular layer of lobule 3. c, Quantitation of cerebellar area in midline sections from P6 pups in Extended Data Fig. 3b. Hpdl−/− pups have smaller cerebella than Hpdl+/+ pups. Cerebellar size in Hpdl−/− pups is partially rescued by 4-HMA treatment. n = 4 for all groups. d, Quantitation of TUNEL staining, a measure of apoptosis, in the cerebella of P6 pups, from Extended Data Fig. 3b. Hpdl−/− pups have higher TUNEL staining in their cerebella than Hpdl+/+ pups. TUNEL staining in Hpdl−/− pups is partially decreased by 4-HMA treatment, consistent with decreased levels of apoptosis when CoQ headgroup synthesis is restored. n = 4 for all groups. e, P11 Hpdl−/− pups show reduced Purkinje cell dendrite height (panels G-J) and EGL thickness (panels T-V) as revealed by calbindin antibody and Ki-67 antibody staining, respectively. P11 Hpdl−/− pups also demonstrate reduced cerebellar size (panel G) and ectopic Purkinje cells (panel H), indicative of abnormal Purkinje cell development. These abnormalities appear restored by 4-HMA treatment from P2-3 (panels K-M, W-Y). f, Quantitation of dendrite height shown in the calbindin stains from Extended Data Fig. 2e, which confirms that P11 Hpdl−/− pups have significantly reduced dendrite height that was rescued in the 4-HMA treated group. n = 3 animals per group. g, Quantitation of External Granular Layer (EGL) thickness shown in the Ki-67 stains from Extended Data Fig. 2e, which confirms that P11 Hpdl−/− pups have significantly reduced EGL thickness that was rescued in the 4-HMA treated group. n = 3 animals per group. h, Hematoxylin and eosin staining of cerebellar samples from P56-57 Hpdl+/+, Hpdl+/−, and Hpdl−/− mice treated with 4-HMA. The cerebellar histology is grossly normal in all three groups of animals. For panels c, d, f, and g, significance was tested by two-way analysis of variance (ANOVA) followed by Tukey’s post-hoc test. Source data
Extended Data Fig. 4
Extended Data Fig. 4. Related to Fig. 2: additional histological characterization of untreated and 4-HMA-treated brains from Hpdl−/− mice.
a, Representative calbindin staining of cerebellar sections from P56-57 Hpdl+/+, Hpdl+/−, and 4-HMA-treated Hpdl−/− mice and quantitation of dendrite height. The dendrite height is similar in all three groups of animals. b, Representative electron micrographs of the cortex in P11 Hpdl+/+, Hpdl+/−, and Hpdl−/− pups, as well as Hpdl−/− pups treated with 4-HMA. We observed minimal changes in cortical mitochondrial ultrastructure in Hpdl−/− pups (panels C and G) compared to Hpdl+/+ pups (panels A and E) and Hpdl+/− pups (panels B and F). c, P11 Hpdl−/− pups exhibit subtle loss of normal cortical layers of the cerebral cortex (panels C, G, K), as well as edema, shrinking of the cortical neurons, and red neurons. These histological findings are partially restored by supplementation with 4-HMA (panels D, H, L). d, P11 Hpdl−/− pups do not exhibit major changes in hippocampal histology in comparison to Hpdl+/+ pups, Hpdl+/− pups, and Hpdl−/− pups treated with 4-HMA. n = 4 for all groups. For panel a, significance was tested by two-way analysis of variance (ANOVA) followed by Tukey’s post-hoc test. Source data
Extended Data Fig. 5
Extended Data Fig. 5. Related to Fig. 2: TUNEL staining in the brains of untreated and 4-HMA-treated Hpdl−/− mice.
a, Staining for Hoechst (blue) and TUNEL (yellow) showing the forebrain of Hpdl+/+, Hpdl−/− and Hpdl−/− + 4-HMA mice at P6 (panels A-C). The white dashed lines delineate the approximate areas of the cortex, striatum, thalamus and hippocampus that were quantified. Magnified view of the red-boxed areas are on the right (panels D-O). n = 3 slides per mouse and 3 mice/genotype. The graphs represent the density of TUNEL+ particles per mm squared in the cortex (panel P), striatum (panel Q), thalamus (panel R) and hippocampus (panel S) of the Hpdl+/+, Hpdl−/− and Hpdl−/− + 4-HMA mice at P6. For panels P-S, significance was tested by two-way analysis of variance (ANOVA) followed by Tukey’s post-hoc test. Source data
Extended Data Fig. 6
Extended Data Fig. 6. Related to Fig. 3: electron flow measurements in cerebellum and cortex from Hpdl+/+, Hpdl+/−, Hpdl−/− and 4-HMA-treated Hpdl−/− mice.
a, Electron transport chain substrates and inhibitors used for the electron flow assay. I, Complex I. II, Complex II. III, Complex III. IV, Complex IV. Q, CoQ. b, Electron flow measurements of mitochondria isolated from the cortex of P9 Hpdl+/+, Hpdl+/−, and Hpdl−/− pups, as well as Hpdl−/− pups treated with 4-HMA. Electron flow through complex I and complex II is reduced in Hpdl−/− pups, and is improved by treatment with 4-HMA. c, Electron flow measurements of mitochondria isolated from the cortex and cerebellum of P90 (3-month-old) Hpdl+/+ and Hpdl+/− pups, as well as Hpdl−/− pups treated with 4-HMA from P3-30. Electron flow through complexes I, II, and IV are similar in all groups. d, Electron flow measurements of mitochondria isolated from P12 Hpdl+/+ mice treated with 4-HMA starting on P3. 4-HMA treatment does not increase electron flow through complex I, II, or IV in wild-type pups. Mitochondria were isolated from n = 5 animals for all groups. Significance was tested by two-way analysis of variance (ANOVA) followed by Tukey’s post-hoc test. Source data
Extended Data Fig. 7
Extended Data Fig. 7. Related to Fig. 3: electrophysiologic characterization of Purkinje cells from Hpdl+/+, Hpdl+/−, Hpdl−/− and 4-HMA-treated Hpdl−/− mice.
a, The I/V curves of Purkinje cells from P8-10 Hpdl−/− pups and 4-HMA-treated Hpdl−/− pups are significantly different from each other and from the I/V curves of Hpdl+/+ and Hpdl+/− pups, which are similar. P-values indicating statistical significance are listed. The Hpdl−/− pups have a flatter I/V curve at hyperpolarized membrane potentials relative to the other curves due to a tighter grouping of currents at hyperpolarized membrane potentials (-100 to -60 mV) than the Hpdl+/+ and Hpdl+/− pups (see insert). The 4-HMA-treated Hpdl−/− pups have a steeper I/V curve similar to more mature Purkinje cells. b, The I/V curves of Purkinje cells from P17-19 Hpdl+/+, Hpdl+/−, and 4-HMA-treated Hpdl−/− pups are similar. The inset depicts an example Hpdl+/+ Purkinje cell current response to the voltage step commands, which is similar to the Hpdl+/− and 4-HMA-treated Hpdl−/− pup Purkinje cells responses. c, The I/V curves of Purkinje cells from P56-57 Hpdl+/+, Hpdl+/−, and 4-HMA-supplemented Hpdl−/− mice are comparable. d, Peak frequency of Purkinje cells from P8-10 Hpdl+/+, Hpdl+/−, Hpdl−/− and 4-HMA-treated Hpdl−/− pups. The 4-HMA treated Hpdl−/− group has higher peak frequency than any of the other groups. Differences in frequency were identified by two-way ANOVA followed by Dunnett’s multiple comparison test. e, Peak frequency of Purkinje cells from P17-19 Hpdl+/+, Hpdl+/−, and 4-HMA-treated Hpdl−/− pups. The peak frequencies in all three groups are comparable. f, F/I curves of Purkinje cells from P8-10 Hpdl+/+, Hpdl+/−, Hpdl−/− and 4-HMA-treated Hpdl−/− pups. There were no significant differences in the linear portions of each curve between each group. The insert shows the simple firing pattern of an immature Purkinje cell. g, F/I curves of Purkinje cells from P17-19 Hpdl+/+, Hpdl+/−, Hpdl−/− and 4-HMA-treated Hpdl−/− pups. There were no significant differences in the linear portions of each curve between each group. The insert shows the simple firing pattern of a more mature Purkinje cell. h, Input resistance and membrane capacitance in Purkinje cells from P56-57 (8-week-old; age comparable to behavioral assays) Hpdl+/+ and 4-HMA-supplemented Hpdl−/− mice are comparable, with a nonsignificant decrease in input resistance and a nonsignificant increase in membrane capacitance in Hpdl+/− mice. i, The F/I curve of Purkinje cells from P56-57 Hpdl+/+ mice exhibits a higher firing rate at higher input currents than Purkinje cells from Hpdl+/− and 4-HMA-treated Hpdl−/− mice. All electrophysiological data are presented as the averages of at least 10 Purkinje cells (Supplementary Table 4). Significance was tested by two-way ANOVA followed by Tukey’s post-hoc test. Source data
Extended Data Fig. 8
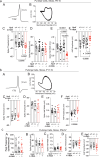
Extended Data Fig. 8. Related to Fig. 3: action potential characteristics of Purkinje cells from Hpdl+/+, Hpdl+/−, Hpdl−/− and 4-HMA-treated Hpdl−/− mice.
a, Action potential characteristics of Purkinje cells from P8-10 Hpdl+/+, Hpdl+/−, Hpdl−/− and 4-HMA-treated Hpdl−/− pups. An average action potential is shown in panel A and the phase plane diagram is shown in panel B. Significant action potential shape differences can be seen between Purkinje cells from Hpdl+/+ and 4-HMA-treated Hpdl−/− pups. Purkinje cells from 4-HMA-treated Hpdl−/− pups had a significantly lower spike threshold than the Hpdl+/+ (p = 0.0076) and Hpdl−/− pups (p = 0.0207; panel C). The spike threshold for Purkinje cells from the Hpdl+/− and 4-HMA-treated Hpdl−/− pups trended to difference but was not significant (p = 0.0506), consistent with 4-HMA treatment rescuing Hpdl−/− pup grip strength to the level of Hpdl+/− mice (Fig. 3g). The spike half-width of Purkinje cells from the 4-HMA-treated Hpdl−/− pups was significantly narrower than all three treatments (Hpdl+/+: p < 0.0001; Hpdl+/−: p = 0.0002; Hpdl−/−: p < 0.0001; panel E). Finally, Purkinje cells from 4-HMA-treated Hpdl−/− pups had a shallower action half-potential (AHP) amplitude compared to Hpdl+/+and Hpdl−/− pups (WT: p = 0.0008; KO: p = 0.0461; panel F). The 4-HMA-treated Hpdl−/− pup statistics resemble those of Hpdl+/+ pups in the P17-19 group (Extended Data Fig. 8b). b, Action potential characteristics of P17-19 Hpdl+/+, Hpdl+/−, and 4-HMA-treated Hpdl−/− pups. An average action potential is shown in panel A and the phase plane diagram is shown in panel B. The spike threshold, spike amplitude, and spike half-width are comparable in all three groups. The AHP for Purkinje cells from 4-HMA-treated Hpdl−/− pups was lower than for Hpdl+/+pups (p = 0.0268). c, Peak frequency and action potential characteristics of Purkinje cells from P56-57 Hpdl+/+, Hpdl+/−, and 4-HMA-treated Hpdl−/− mice. The peak frequency, spike amplitude, spike half-width, spike threshold, and AHP amplitude are comparable in all three groups. All electrophysiological data are presented as the averages of at least 10 Purkinje cells (Supplementary Table 4). Significance was tested by two-way ANOVA followed by Dunnett’s multiple comparison test. Source data
Extended Data Fig. 9
Extended Data Fig. 9. Related to Fig. 3: additional metabolic, behavioral, and neurological tests of Hpdl+/+, Hpdl+/−, Hpdl−/− and 4-HMA-treated Hpdl−/− mice.
a, Metabolic phenotypes such as food and water intake, activity, O2 consumption, CO2 production, and energy expenditure are similar in 4-6-week-old Hpdl+/+, Hpdl+/−, and 4-HMA-treated Hpdl−/− mice, as measured in metabolic cages. There were no significant changes in any of these parameters between Hpdl+/+, Hpdl+/−, and 4-HMA-treated Hpdl−/− mice. b, Respiratory exchange ratio (vO2/vCO2) in Hpdl+/+, Hpdl+/−, and 4-HMA-treated Hpdl−/− mice. c, 4-HMA treatment partially restores the weight of male Hpdl−/− mice and rescues the weight of Hpdl−/− female mice. Hpdl+/− mice have comparable weights to Hpdl+/+ mice. The combined data demonstrate that 4-HMA partially restores the weight of Hpdl−/− mice relative to Hpdl+/− mice. d, Respiratory exchange ratio summary in Hpdl+/+, Hpdl+/−, and 4-HMA-treated Hpdl−/− mice. Male Hpdl−/− mice treated with 4-HMA had a significantly increased respiratory exchange ratio (RER) compared to both Hpdl+/+ male mice and Hpdl+/− and 4-HMA-treated Hpdl−/− female mice. e, Rotarod performance is similar in Hpdl+/+, Hpdl+/−, and 4-HMA-treated Hpdl−/− male and female mice. f, Open field data from 6–8-week-old Hpdl+/+, Hpdl+/−, and 4-HMA-treated Hpdl−/− mice revealed no significant differences in distance moved or time that mice spent in the center of the open field. For behavioral tests, data from male mice (n: Hpdl+/+= 4, Hpdl+/−= 5, 4-HMA-treated Hpdl−/−=4) are plotted as triangles. Data from female mice (n: Hpdl+/+= 4, Hpdl+/−=2, 4-HMA-treated Hpdl−/−=5) are plotted as circles. Behavioral data do not contain comparisons to untreated Hpdl−/− mice, which do not survive to the age at which these behavioral assays are carried out. Data presented are mean ± standard error of the mean, as well as raw data. Behavioral data are presented as box and whisker plots, where the center is the median, the box bounds are the 25th to 75th percentiles, and whiskers indicate minimum to maximum. Significance was tested by two-way ANOVA followed by Tukey’s post-hoc test. Source data
Extended Data Fig. 10
Extended Data Fig. 10. Related to Figs. 3 and 4: gait characterization of Hpdl+/+, Hpdl+/−, Hpdl−/− and 4-HMA-treated Hpdl−/− mice, and brain MRI from a patient with biallelic HPDL variants receiving the CoQ10 headgroup intermediate 4-HB.
a, Additional catwalk data from 6–8-week-old Hpdl+/+, Hpdl+/−, and 4-HMA-treated Hpdl−/− mice reveal no significant differences in gait parameters between the groups of mice. A, stride length. B, swing phase duration. C, stance phase duration. D, cadence. E, base of support. F, maximum contact intensity. G, symmetry index for stride length. b, T1- and T2-weighted brain MRI images from a patient with biallelic HPDL variants before treatment with 4-HB (day 0; panels A and B) and 30 days after treatment with 4-HB (panels C and D). For behavioral tests, data from male mice (n: Hpdl+/+= 4, Hpdl+/−= 5, 4-HMA-treated Hpdl−/−=4) are plotted as triangles. Data from female mice (n: Hpdl+/+= 4, Hpdl+/−=2, 4-HMA-treated Hpdl−/−=5) are plotted as circles. Behavioral data do not contain comparisons to untreated Hpdl−/− mice, which do not survive to the age at which these behavioral assays are carried out. Data presented are mean ± standard error of the mean, as well as raw data. Behavioral data are presented as box and whisker plots, where the center is the median, the box bounds are the 25th to 75th percentiles, and whiskers indicate minimum to maximum. Significance was tested by two-way ANOVA followed by Tukey’s post-hoc test. Source data

References

    1. Emmanuele, V. et al. Heterogeneity of coenzyme Q10 deficiency: patient study and literature review. Arch. Neurol.69, 978–983 (2012). - PMC - PubMed
    1. Bersuker, K. et al. The CoQ oxidoreductase FSP1 acts parallel to GPX4 to inhibit ferroptosis. Nature575, 688–692 (2019). - PMC - PubMed
    1. Awad, A. M. et al. Coenzyme Q10 deficiencies: pathways in yeast and humans. Essays Biochem.62, 361–376 (2018). - PMC - PubMed
    1. Mantle, D., Millichap, L., Castro-Marrero, J. & Hargreaves, I. P. Primary coenzyme Q10 deficiency: an update. Antioxidants12, 1652 (2023). - PMC - PubMed
    1. Stefely, J. A. & Pagliarini, D. J. Biochemistry of mitochondrial coenzyme Q biosynthesis. Trends Biochem. Sci.42, 824–843 (2017). - PMC - PubMed

MeSH terms

Supplementary concepts

LinkOut - more resources