. 2025 Jul 9;15(1):24756.
doi: 10.1038/s41598-025-10447-7.

Monitoring of antibodies against SARS-CoV-2 over 2 years and characterization of immune responses following Omicron infection in a South Indian community cohort

Affiliations

Monitoring of antibodies against SARS-CoV-2 over 2 years and characterization of immune responses following Omicron infection in a South Indian community cohort

Ramya Madhavan et al. Sci Rep. .

Abstract

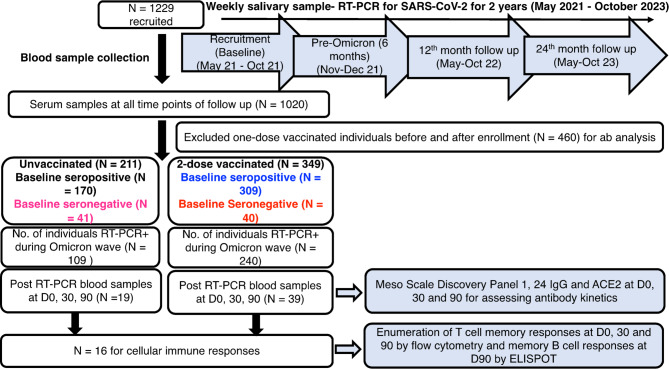
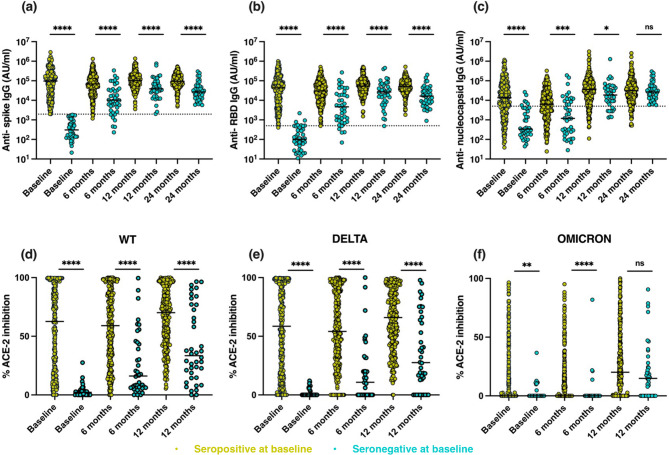
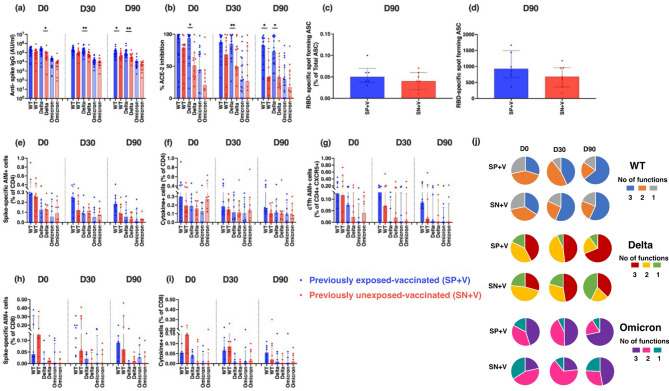
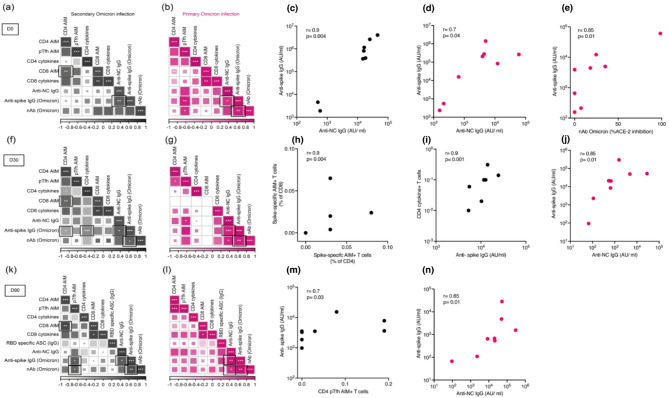
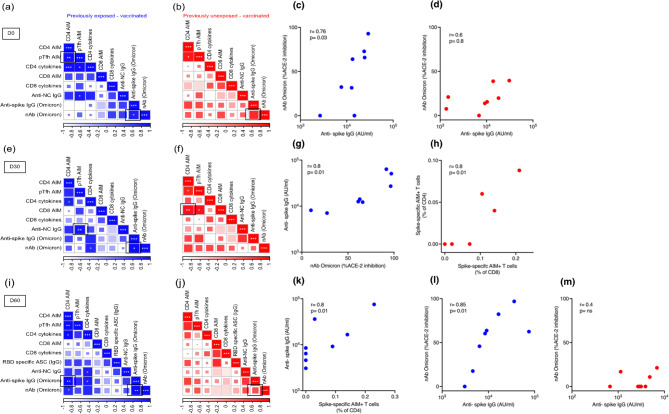
Multiple severe acute respiratory syndrome (SARS-CoV-2) exposures either due to infection or vaccination result in differential immune responses. Limited data exist on community-level SARS-CoV-2 variant exposures in India. We assessed antibody levels in 211 unvaccinated and 349 vaccinated individuals with and without prior exposure, followed for ~ 2 years (May 2021-October 2023) with baseline blood, weekly saliva for RT-PCR, and blood draws at ~ 6, 12, and 24 months. Humoral and cellular immune responses following primary (N = 8) and secondary (N = 11) Omicron infections in unvaccinated, previously exposed (N = 25), and unexposed vaccinated (N = 14) individuals were evaluated using Meso Scale Discovery and flow cytometry assays at Day 0, 30, and 90. Previously exposed individuals had higher anti-spike IgG levels at baseline (median 57,732 vs. 11,359, p < 0.001 in unvaccinated; 93,827 vs. 26,883, p < 0.001 in vaccinated) and 99% seropositivity at 2 years. Secondary Omicron infection elicited higher anti-spike IgG levels (17,320 vs. 3,930, p < 0.01) and stronger CD8 T cell responses (median CD8 AIM 0.026 vs. 0.001, p = 0.01 at Day90) than primary Omicron infection. Vaccinated individuals showed comparable CD4 and CD8 T cell responses irrespective of prior exposure, but previously exposed individuals had more durable antibodies at Day90 (p < 0.05 in previously exposed). Anti-spike IgG levels and %ACE-2 inhibition to Omicron were lower in both groups compared to other variants. High seropositivity was observed in both vaccinated and unvaccinated individuals after multiple exposures, though antibody levels were higher in individuals with prior exposure. These findings underscore preserved T cell responses to Omicron, although with lesser magnitude among unvaccinated.

Keywords: Antibody kinetics; Antigen imprinting; COVID-19 vaccination; Omicron variant.


Conflict of interest statement

Declarations. Competing interests: The authors declare no competing interests. Ethical approval: The study has been approved by the Institutional Review Board of Christian Medical College, Vellore (IRB min no: 13585). We certify that the study was performed in accordance with the ethical standards as laid down in the 1964 Declaration of Helsinki and its later amendments or comparable ethical standards. Consent to participate: Written informed consent was obtained from all participants.

Figures

Fig. 1
Fig. 1
Flowchart depicting the samples collected and analyzed for antibody and cellular immune responses in the COVID-19 re-infection and its predictors (CORES) cohort participants. “+” denotes “positive”, D0- Day 0, D30- Day 30 and D90- Day 90, ACE2- Angiotensin-converting enzyme2, RT-PCR- reverse transcriptase polymerase chain reaction, ELISPOT- Enzyme-Linked ImmunoSpot.
Fig. 2
Fig. 2
Antibody levels to severe acute respiratory syndrome coronavirus-2 (SARS-CoV-2) among the unvaccinated study participants over 24 months who were seropositive and seronegative at baseline. (a) Anti-spike IgG levels. (b) Anti-spike receptor-binding domain (RBD) IgG levels. (c) Anti-nucleocapsid IgG levels. Percentage angiotensin-converting enzyme-2 (ACE-2) inhibition levels to SARS-CoV-2 among the unvaccinated study participants over 24 months who were seropositive and seronegative at baseline. (d) Percentage ACE-2 inhibition levels to wild type (WT). (e) Percentage ACE-2 inhibition levels to Delta. (f) Percentage ACE-2 inhibition levels to the Omicron variant. The data are represented as individual values with median and interquartile range. Data were analyzed for statistical significance using with Mann–Whitney U test. P-values are indicated by asterisks as *p < 0.05, **p < 0.01, ***p < 0.001, ****p < 0.0001 and ns, no significant difference. AU/ml- arbitrary units/ml. N = 170 for Seropositive at baseline; N = 41 for Seronegative at baseline.
Fig. 3
Fig. 3
Humoral and cellular immune responses following Omicron infection among unvaccinated individuals with and without pre-Omicron exposure. Antibody levels (a) and percentage ACE-2 inhibition levels (b) to SARS-CoV-2 variants among secondary (SP + UNV) and primary Omicron-infected (SN + UNV) unvaccinated individuals at D0, 30, and 90 (N = 11 for Secondary Omicron infected; N = 8 for Primary Omicron infected). (c-j) Variant spike-specific B cell and T cell responses elicited by Omicron infection among previously exposed and unexposed unvaccinated individuals. (c) RBD-specific spot-forming antibody-secreting cells (ASCs) expressed as a percentage of total IgG-secreting cells; (d) RBD-specific spot-forming ASCs (e-g) CD4 T cell responses (h, i) CD8 T cell responses following Omicron infection at Day 0, 30, 90 in Secondary Omicron infected (black) and Primary Omicron infected (pink). Spike-specific (e) activation-induced marker-positive (AIM+) CD4 T cells (f). Any one of the three cytokines interferon-γ (IFN-γ)/tumor necrosis factor-α (TNF-α)/interleukin-2 (IL2) + CD4 T cells (g) AIM + CD4 circulating T follicular helper (cTfh) cells (h) AIM + CD8 T cells (i). Any one of the three cytokines IFN-γ/TNF-α/IL2 + CD8 T cells (j) Proportion of polyfunctional CD4 T cells in secondary and primary Omicron-infected, unvaccinated individuals assessed on D0, 30, 90 following Omicron infection. The data are represented as median with interquartile range. Data were analyzed for statistical significance using Mann–Whitney U test. Background subtracted data were analyzed in all cases. P-values are indicated by asterisks as *p < 0.05, **p < 0.01. N = 8 for Secondary Omicron infected (SP + UNV); N = 8 for Primary Omicron infected (SN + UNV) for T and B cell analysis. WT- wild type.
Fig. 4
Fig. 4
Antibody levels to severe acute respiratory syndrome coronavirus-2 (SARS-CoV-2) among the vaccinated study participants over 24 months who were seropositive and seronegative at baseline. (a) Anti-spike IgG levels. (b) Anti-spike receptor-binding domain (RBD) IgG levels. (c) Anti-nucleocapsid IgG levels. Percentage angiotensin-converting enzyme-2 (ACE-2) inhibition levels to SARS-CoV-2 among the vaccinated study participants over 24 months who were seropositive and seronegative at baseline. (d) Percentage ACE-2 inhibition levels to wild-type (WT). (e) Percentage ACE-2 inhibition levels to Delta variant. (f) Percentage ACE-2 inhibition levels to the Omicron variant. The data are represented as individual values with median and interquartile range. Data were analyzed for statistical significance using with Mann–Whitney U test. P-values are indicated by asterisks as *p < 0.05, **p < 0.01, ***p < 0.001, ****p < 0.0001 and ns, no significant difference. AU/ml- arbitrary units/ml. N = 309 for Seropositive at baseline; N = 40 for Seronegative at baseline.
Fig. 5
Fig. 5
Humoral and cellular immune responses following Omicron infection among vaccinated individuals with and without pre-Omicron exposure. Antibody levels (a) and percentage ACE-2 inhibition levels (b) to SARS-CoV-2 variants among previously exposed (SP + V) and unexposed (SN + V) vaccinated individuals at D0, 30, and 90 (N = 25 Previously exposed-vaccinated; N = 14 for previously unexposed-vaccinated). (c-j) Variant spike-specific B cell and T cell responses elicited by Omicron infection among previously exposed and unexposed vaccinated individuals. (c) RBD-specific spot-forming ASCs expressed as a percentage of total IgG-secreting cells, (d) RBD-specific spot-forming ASCs, (e-g) CD4 T cell responses, (h, i) CD8 T cell responses following Omicron infection at D0, 30, 90 in previously exposed (blue) and previously unexposed vaccinated (red). Spike-specific (e) AIM + CD4 T cells. (f) Any one of the three cytokines IFN-γ/TNF-α/IL2 + CD4 T cells, (g) AIM + cTfh CD4 T cells, (h) AIM + CD8 T cells. (i) Any one of the three cytokines IFN-γ/TNF-α/IL2 + CD8 T cells. (j) Proportion of polyfunctional CD4 T cells in previously exposed and unexposed vaccinated individuals assessed on D0, 30, 90 following Omicron infection. The data are represented as median with interquartile range. Data were analyzed for statistical significance using Mann–Whitney U test. Background subtracted data were analyzed in all cases. P-values are indicated by asterisks as *p < 0.05, **p < 0.01. N = 8 for Previously exposed-vaccinated (SP + V); N = 8 for Previously unexposed-vaccinated (SN + V) for both T and B cell analysis.
Fig. 6
Fig. 6
Correlation analysis of Omicron-specific cellular and humoral immune parameters in secondary and primary Omicron-infected groups. (a), (f), (k) Correlation matrix of D0, D30, and D90 samples of secondary Omicron-infected individuals. (b), (g), (l) Correlation matrix of D0, D30, and D90 samples of primary Omicron-infected individuals. The black square in each matrix indicates a significant association between immune parameters. Spearman rank-order correlation values (r) are shown from white (–1.0) to black/pink for secondary Omicron-infected and primary Omicron-infected, respectively (1.0); r values are indicated by color and square size. p-values are indicated by asterisks as *p < 0.05, **p < 0.01, ***p < 0.001. nAb is a neutralizing antibody. (c–e), (h–j), (m–n) The association of indicated parameters is represented by a scatterplot. Black indicates secondary Omicron infection; pink indicates primary Omicron infection. The Spearman rank-order correlation values (r) and p-values are shown. N = 8 for Secondary Omicron infected (SP + UNV); N = 8 for Primary Omicron infected (SN + UNV) for correlation analysis.
Fig. 7
Fig. 7
Correlation analysis of Omicron-specific cellular and humoral immune parameters in previously exposed and unexposed vaccinated groups following Omicron infection. (a), (e), (i) Correlation matrix of D0, D30, and D90 samples of previously exposed-vaccinated individuals. (b), (f), (j) Correlation matrix of D0, D30, and D90 samples of unexposed-vaccinated individuals. The black square in each matrix indicates significant association between the immune parameters. Spearman rank-order correlation values (r) are shown from white (−1.0) to blue/red for previously exposed/unexposed vaccinated individuals, respectively (1.0); r values are indicated by color and square size. p-values are indicated by asterisks as *p < 0.05, **p < 0.01, ***p < 0.001. (c-d), (g-h), (k-m) The association of indicated parameters is represented by scatterplot. Blue indicates previously exposed-vaccinated; red indicates previously unexposed-vaccinated. Spearman rank-order correlation values (r) and p-values are shown. N = 8 for Previously exposed-vaccinated (SP + V); N = 8 for Previously unexposed-vaccinated (SN + V) for correlation analysis.
Fig. 8
Fig. 8
Principal Component Analysis (PCA) following Omicron infection in all four groups based on all immune parameters obtained at Day 0 (a) and Day 30 (b). Arrows indicate the prominent immunological parameters. Ellipses represent the clustering of each group. Blue indicates previously exposed-vaccinated (SP + V), red indicates unexposed-vaccinated (SN + V), black indicates Secondary Omicron infection (SP + UNV), and pink indicates Primary Omicron infection (SN + UNV). W- WT, D- Delta, Om- Omicron.

References

    1. Karim, S. S. A. & Karim, Q. A. Omicron SARS-CoV-2 variant: a new chapter in the COVID-19 pandemic. Lancet398, 2126–2128. 10.1016/S0140-6736(21)02758-6 (2021). - PMC - PubMed
    1. Hu, J. et al. Increased immune escape of the new SARS-CoV-2 variant of concern Omicron. Cell. Mol. Immunol.19, 293–295. 10.1038/s41423-021-00836-z (2022). - PMC - PubMed
    1. Abdullah, F. et al. Decreased severity of disease during the first global Omicron variant Covid-19 outbreak in a large hospital in tshwane, South Africa. Int. J. Infect. Dis.116, 38–42. 10.1016/j.ijid.2021.12.357 (2022). - PMC - PubMed
    1. Nyberg, T. et al. Comparative analysis of the risks of hospitalisation and death associated with SARS-CoV-2 Omicron (B.1.1.529) and delta (B.1.617.2) variants in england: a cohort study. Lancet399, 1303–1312. 10.1016/S0140-6736(22)00462-7 (2022). - PMC - PubMed
    1. Thiruvengadam, R. et al. Clinical and experimental evidence suggest Omicron variant of SARS-CoV-2 is inherently less pathogenic than delta variant independent of previous immunity. Eur. J. Med. Res.28, 421. 10.1186/s40001-023-01373-3 (2023). - PMC - PubMed

MeSH terms

Supplementary concepts