. 2025 Jul;57(7):1766-1776.
doi: 10.1038/s41588-025-02248-5. Epub 2025 Jul 9.

Enhancer adoption by an LTR retrotransposon generates viral-like particles, causing developmental limb phenotypes

Affiliations

Enhancer adoption by an LTR retrotransposon generates viral-like particles, causing developmental limb phenotypes

Juliane Glaser et al. Nat Genet. 2025 Jul.

Abstract

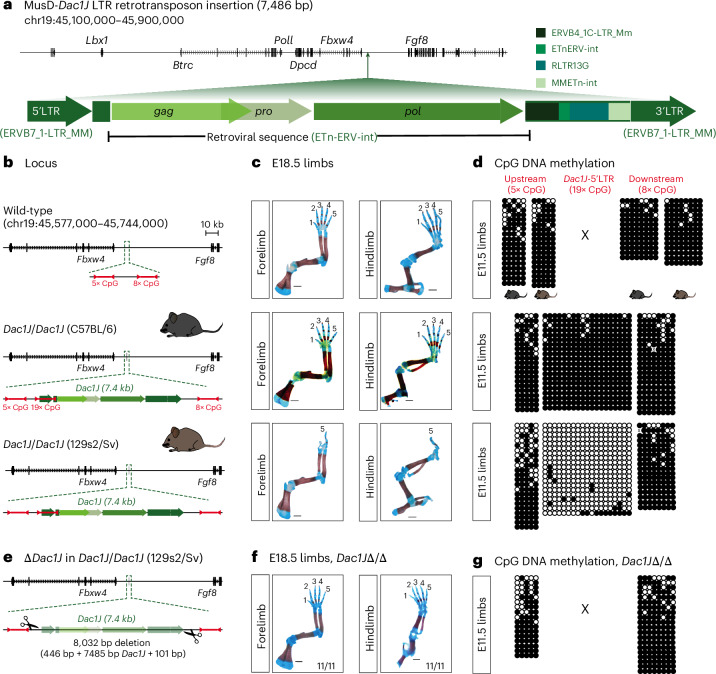
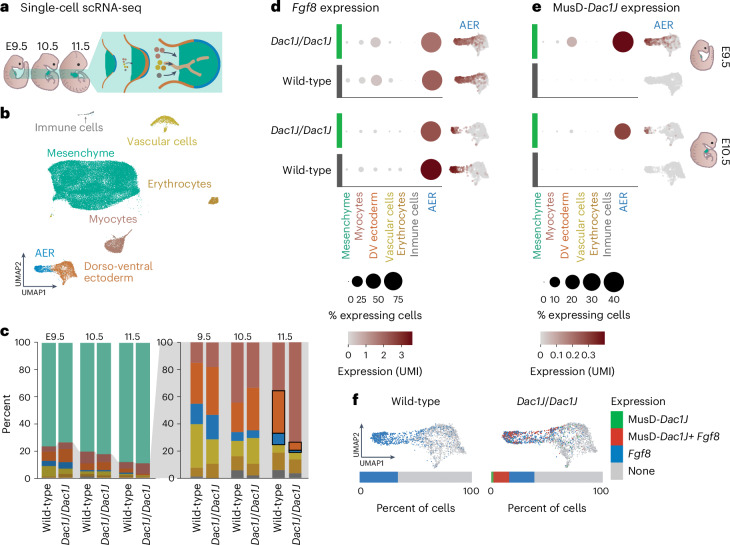
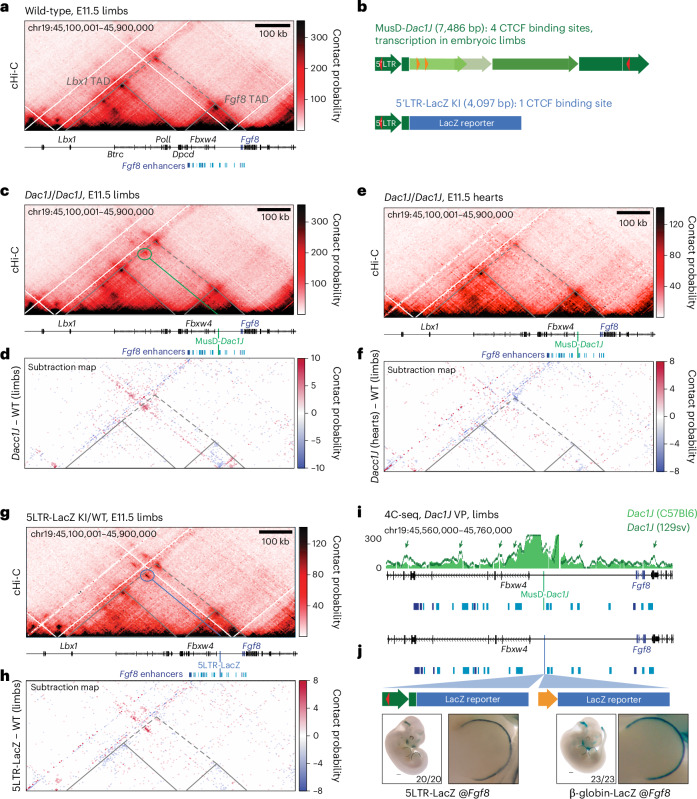
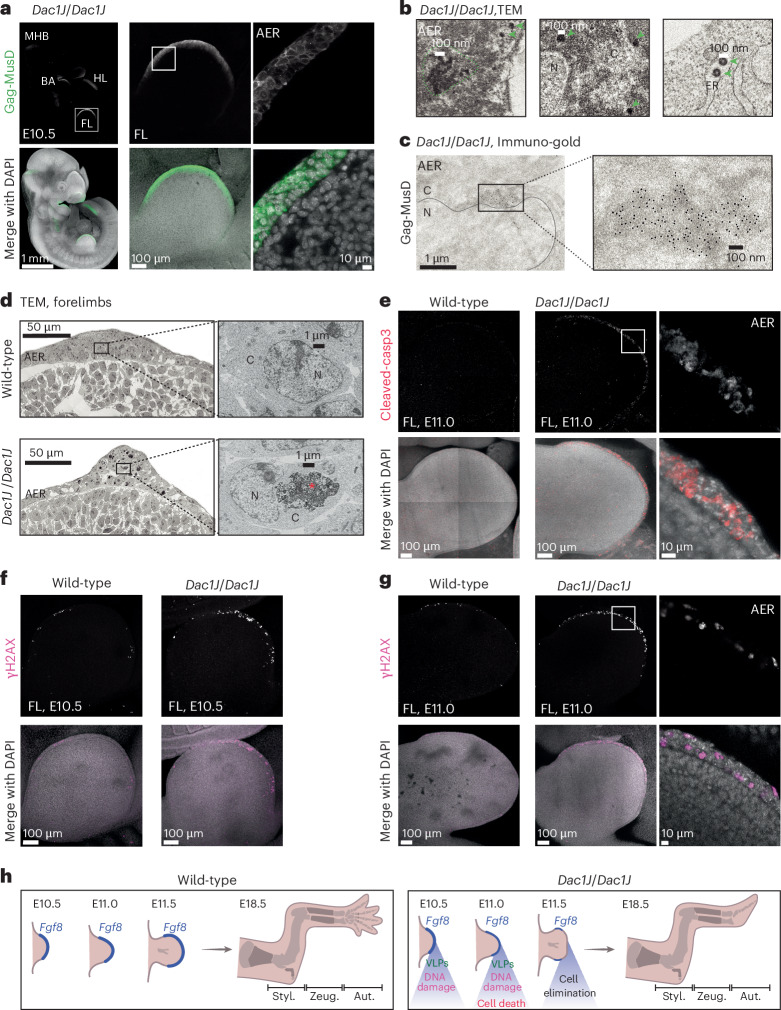
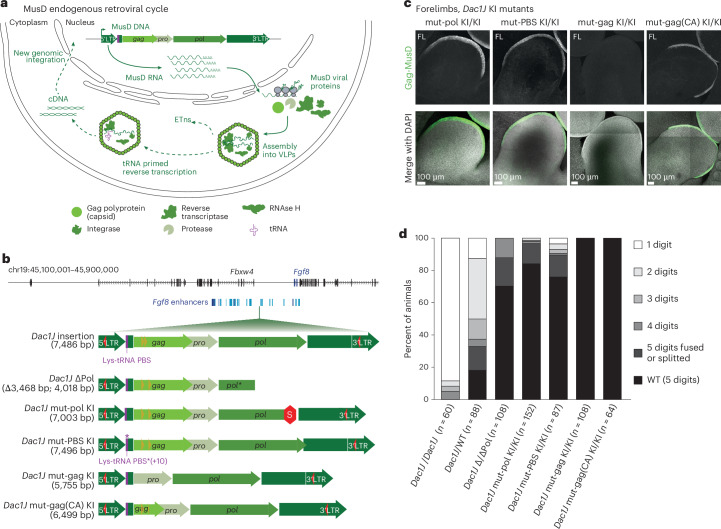
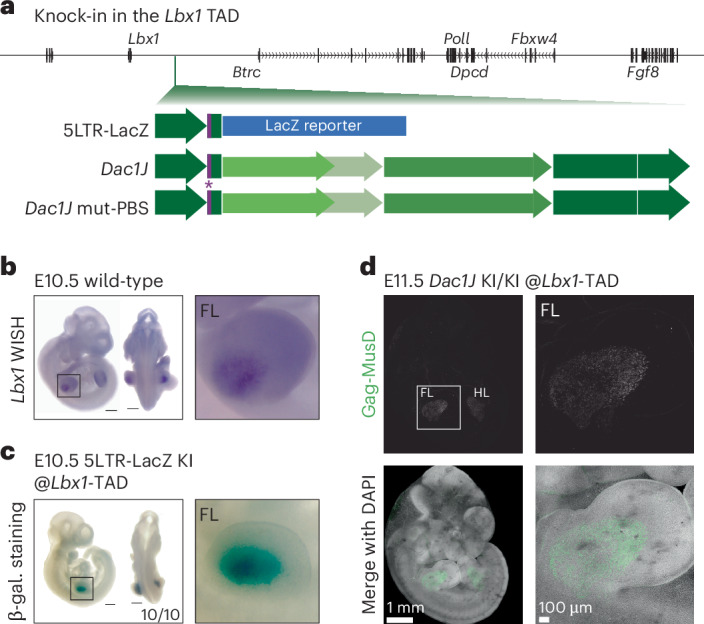
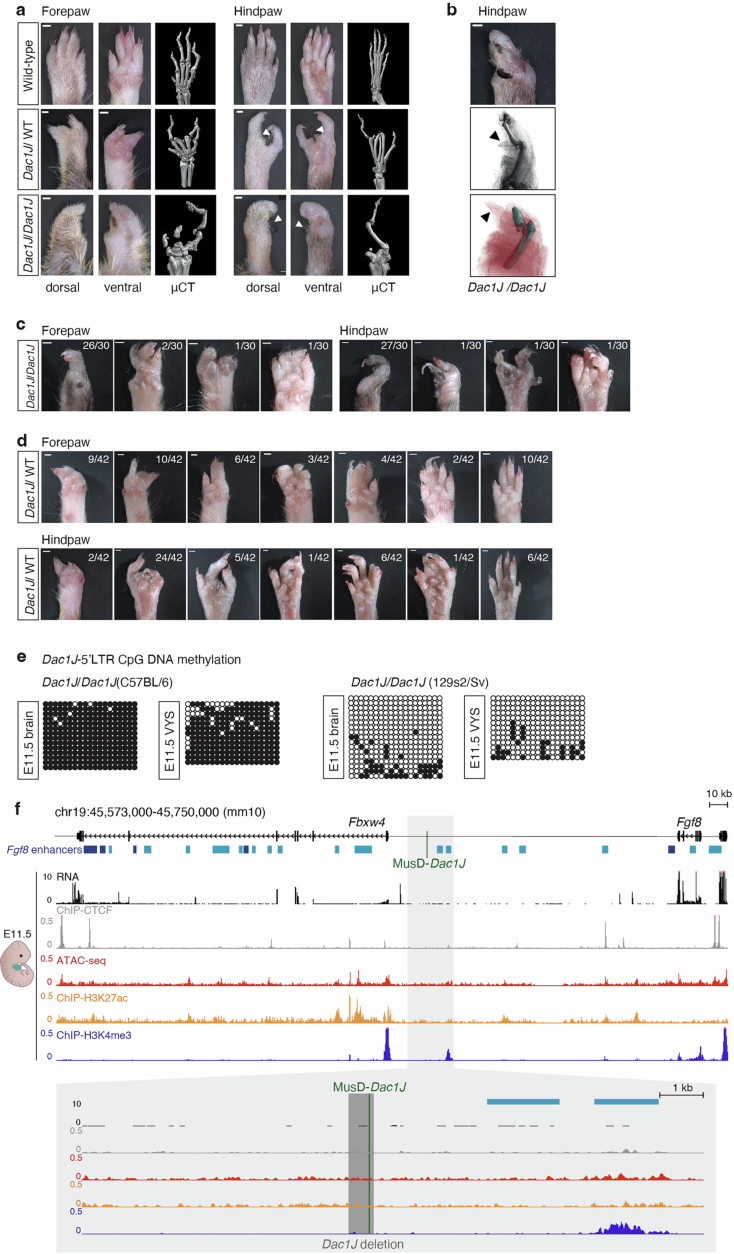
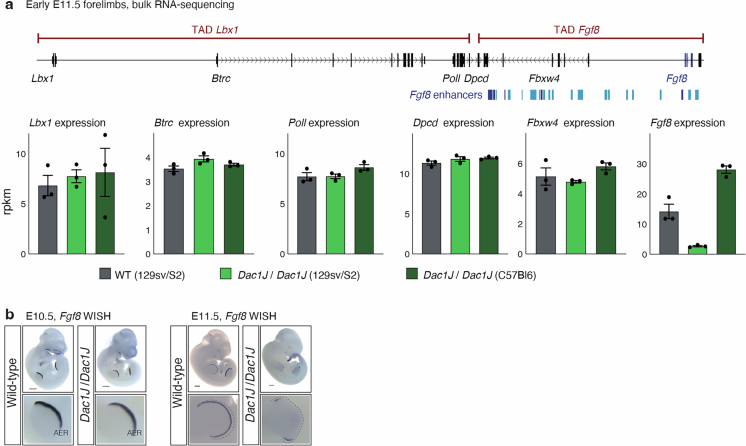
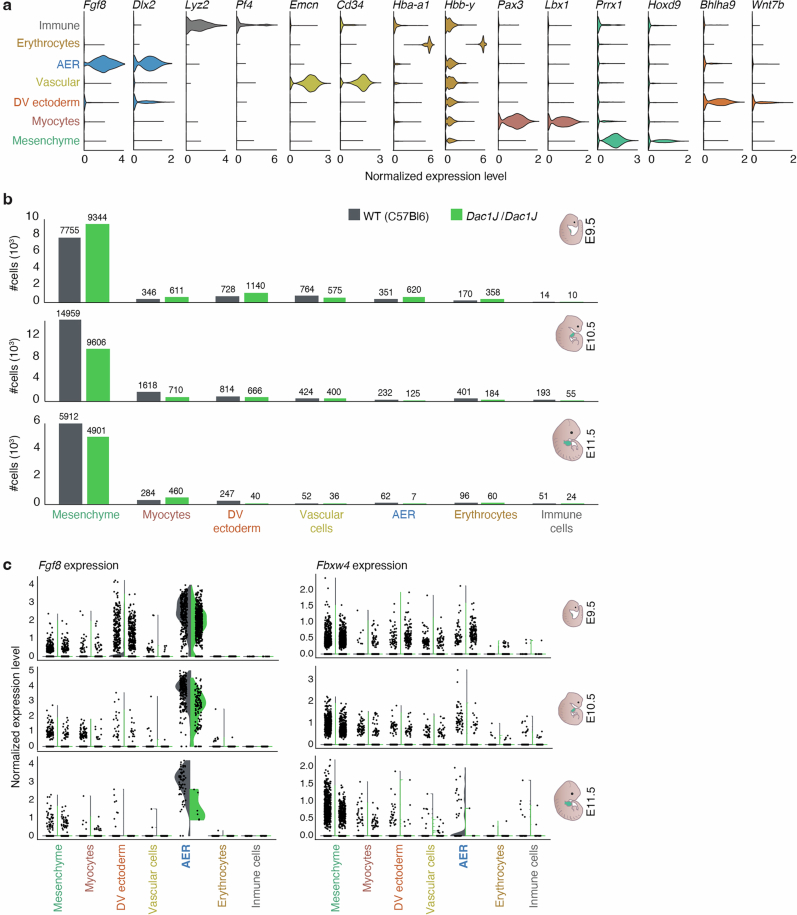
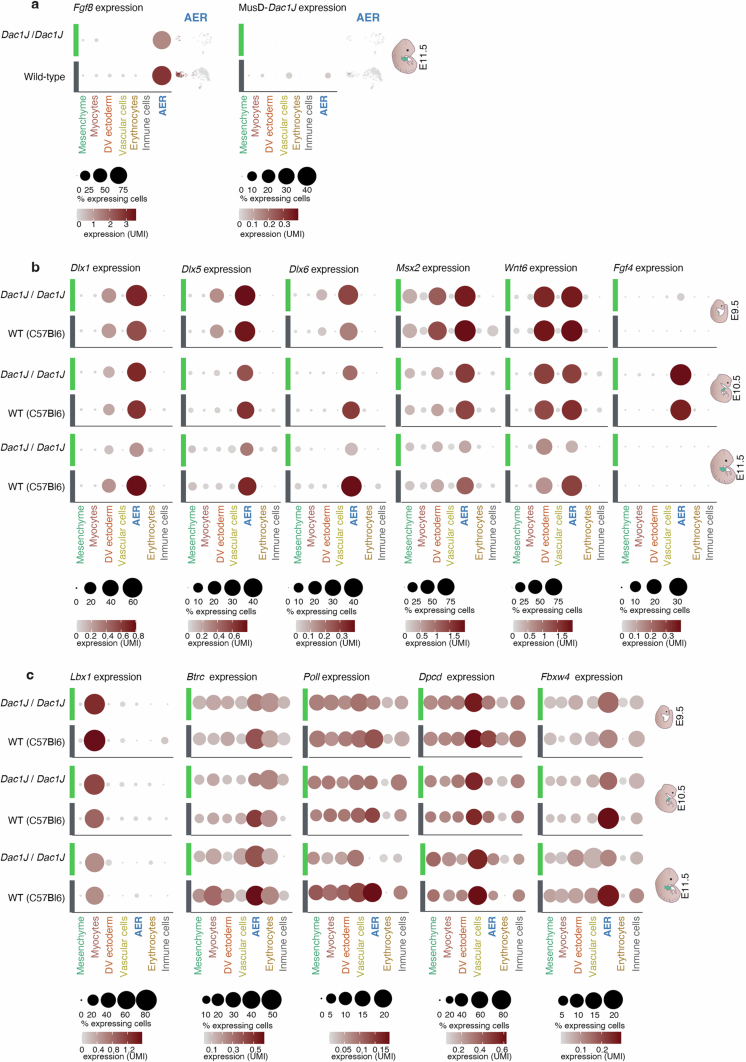
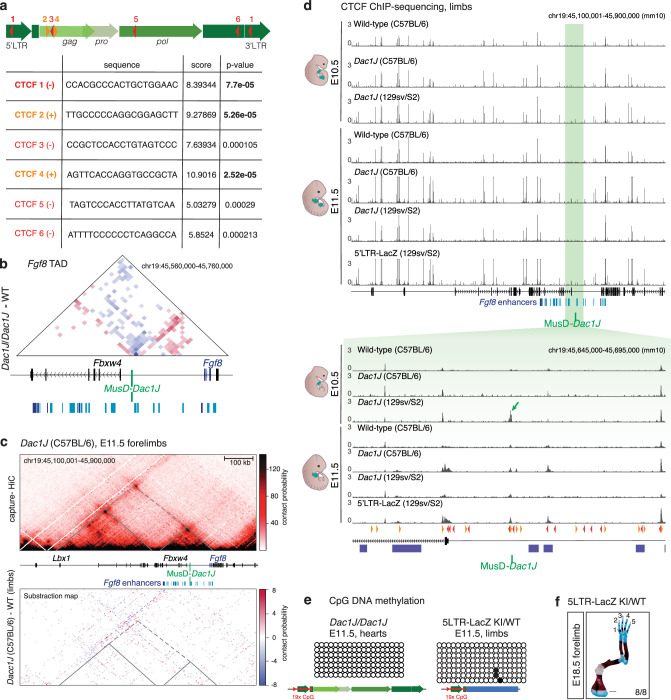
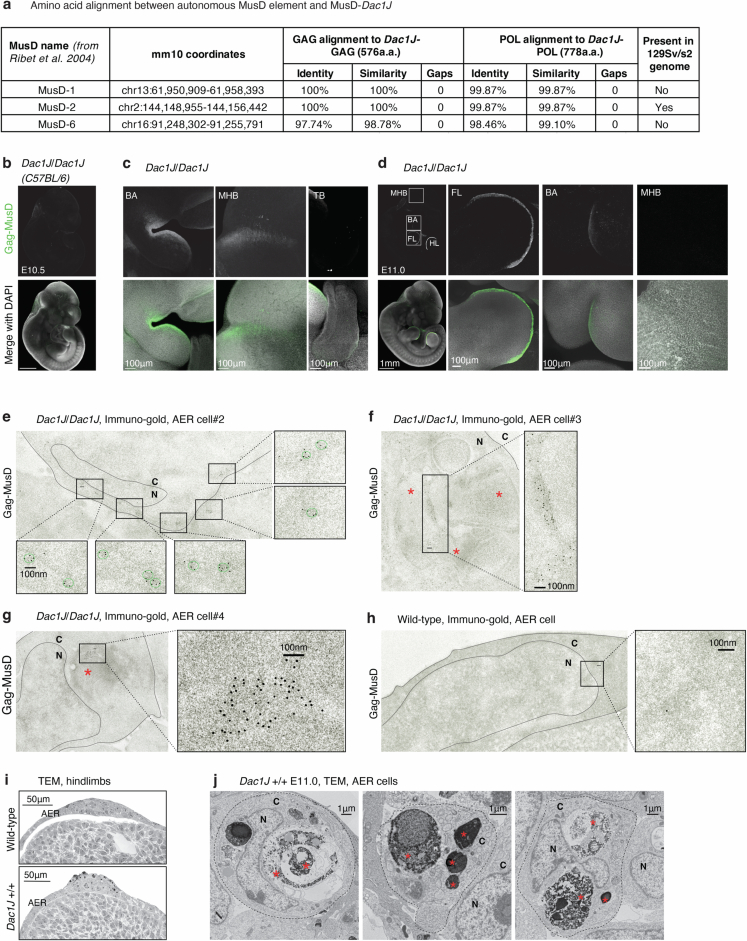
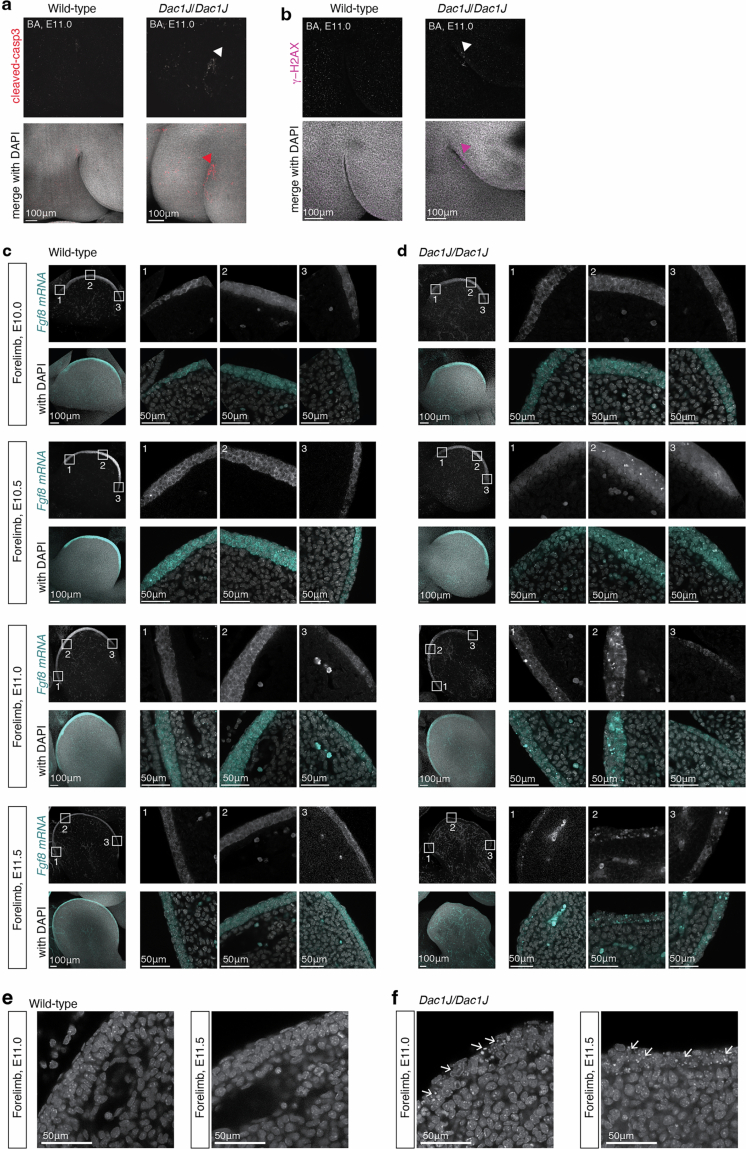
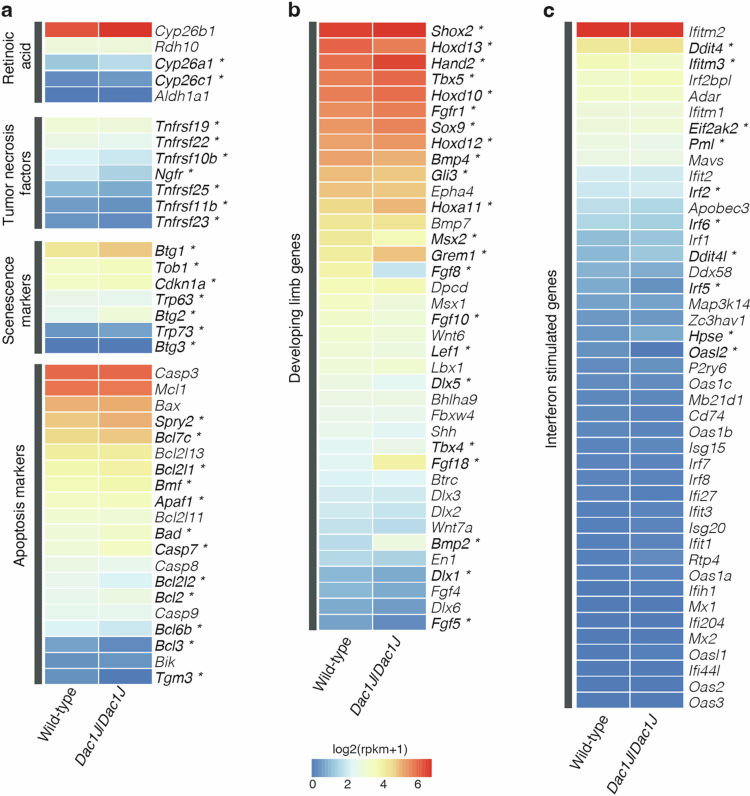
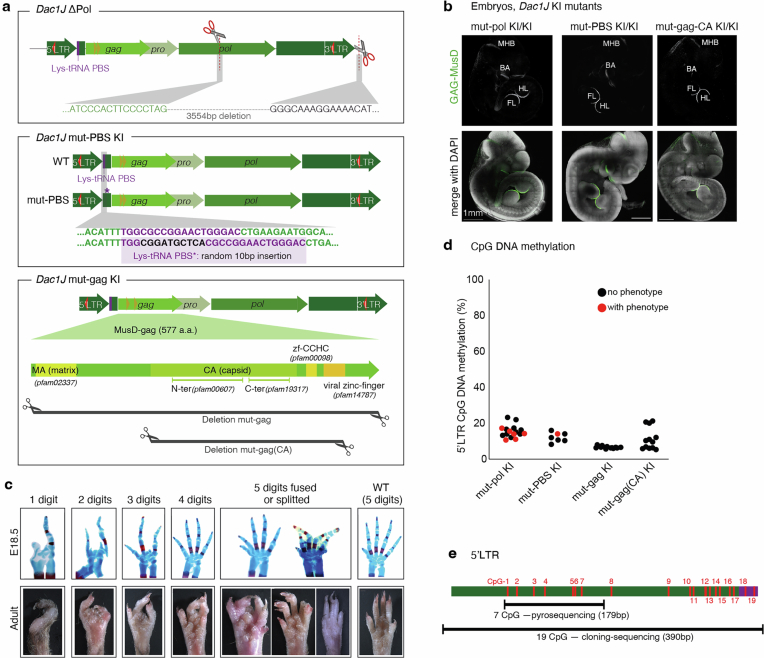
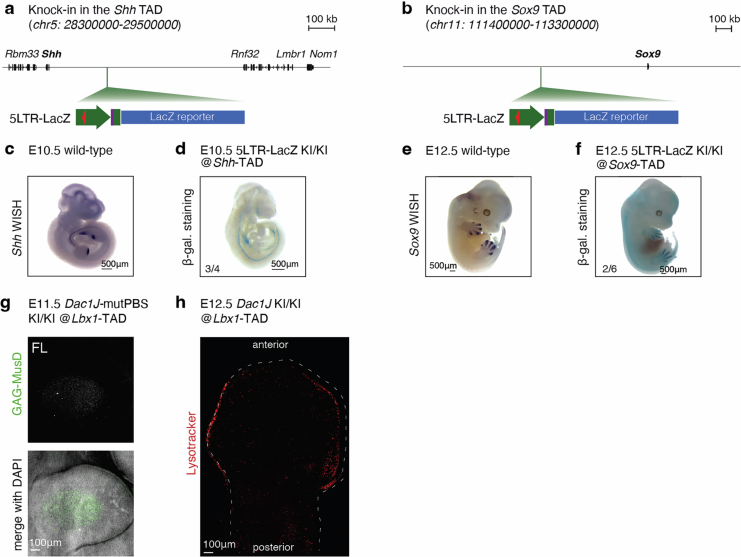
Transposable elements (TEs) are scattered across mammalian genomes. Silencing of TEs prevents harmful effects caused by either global activation leading to genome instability or insertional mutations disturbing gene transcription. However, whether the activation of a TE can cause disease without directly affecting gene expression is largely unknown. Here we show that a TE insertion can adopt nearby regulatory activity, resulting in the production of cell-type-specific viral-like particles (VLPs) that affect embryo formation. Failure to silence an LTR retrotransposon inserted upstream of the Fgf8 gene results in their co-expression during mouse development. VLP assembly in the Fgf8-expressing cells of the developing limb triggers apoptotic cell death, resulting in a limb malformation resembling human ectrodactyly. The phenotype can be rescued by mutating the retrotransposon coding sequence, thus preventing its full endogenous retroviral cycle. Our findings illustrate that TE insertions can be incorporated into the local genomic regulatory landscape and that VLP production in post-implantation embryos can cause developmental defects.


Conflict of interest statement

Competing interests: The authors declare no competing interests.

Figures

Fig. 1
Fig. 1. Dactylaplasia limb malformation is caused by an unmethylated MusD insertion at the Fgf8 locus.
a, Scheme of the 7,486 bp MusD-Dac1J inserted at the Fgf8 locus (mm10, chr19:45,100,000–45,900,000). The full-length element contains retroviral (gag, pro, pol) and non-retroviral sequences flanked by 5′LTR and 3′LTR. RepeatMasker names are indicated in green. b, The mouse Fbxw4–Fgf8 locus is shown in wild-type mice (top) or with the intergenic MusD-Dac1J insertion in Dac1J/Dac1J C57BL/6 (middle) or Dac1J/Dac1J 129s2/Sv (bottom). The number and localization of the CpG measured in d are indicated in red. c, Skeletal analysis of the forelimbs and hindlimbs of E18.5 wild-type (top), Dac1J/Dac1J C57BL/6 (middle) or 129s2/Sv (bottom) mice, stained with alcian blue (cartilage) and alizarin red (bone). Scale bars, 1 mm. d, DNA methylation status of five CpGs upstream of the insertion, 19 CpGs in the 5′LTR (promoter) of Dac1J and eight CpGs downstream of the insertion in wild-type (C57BL/6 and 129s2/Sv, top), Dac1J/Dac1J C57BL/6 (middle) or 129s2/Sv (bottom) mice measured by bisulfite cloning and sequencing from E11.5 limbs. White circles, unmethylated CpGs; black circles, methylated CpGs. e, Schematic representation of the CRISPR–Cas9 Dac1J deletion in the Dac1J/Dac1J (129s2/Sv) line. f, Skeletal analysis of E18.5 Dac1J Δ/Δ (129s2/Sv) forelimbs and hindlimbs showing complete rescue. Scale bars, 1 mm. n = 11 out of 11 E18.5 showed a similar phenotype. g, CpG DNA methylation status in Dac1J Δ/Δ (129s2/Sv) E11.5 limbs as in d.
Fig. 2
Fig. 2. MusD-Dac1J is expressed in Fgf8-expressing cells before their disappearance.
a, Schematic representation of the embryos used for limb bud scRNA-seq. b, Uniform manifold approximation and projection (UMAP) showing seven cell clusters identified through scRNA-seq of E9.5, E10.5 and E11.5 stage mouse forelimbs from wild-type and Dac1J/Dac1J embryos. c, Proportion of cell types within the forelimb population in E9.5, E10.5 and E11.5 wild-type and Dac1J/Dac1J embryos. The seven colors correspond to the seven cell types as represented in b. Gray shading represents a zoomed-in view without mesenchyme cells. It shows a strong decrease of AER and dorso-ventral cells in Dac1J/Dac1J at E11.5 compared to wild-type, as represented with black outlines. Zoomed-in view without mesenchyme cells shows a strong decrease of AER and dorso-ventral (DV) cells in Dac1J/Dac1J embryos at E11.5 compared to wild-type. d,e, Dot plots showing expression and percentage of expressing cells for Fgf8 (d) and MusD-Dac1J (e) in the seven forelimb cell cluster at E9.5 and E10.5 in wild-type (dark gray) and Dac1J/Dac1J (green). Unique molecular identifier (UMI) expression in the AER and dorso-ventral ectoderm cell type is also represented as a feature plot next to the respective dot plot for each genotype and stage. f, Wild-type (left) and Dac1J/Dac1J (right) AER and dorso-ventral cells colored depending on their status of expressing Fgf8 and Dac1J. Percent of cells expressing either MusD-Dac1J, MusD-Dac1J+Fgf8, Fgf8 or none of them is indicated.
Fig. 3
Fig. 3. MusD-Dac1J insertion leads to an ectopic chromatin loop.
a, cHi-C of the Lbx1/Fgf8 locus (mm10, chr19:45,100,000–45,900,000) from wild-type E11.5 mouse limb buds. Data are shown as merged signals of n = 3 biological replicates and n = 1 technical replicate. The dashed lines indicate the Lbx1 and Fgf8 TADs. Published Fgf8 enhancers are indicated in light blue and dark blue (AER enhancers). Color bar shows the KR-normalized contact probability (white: low; black: high). b, Schematic representation of the MusD-DacJ and the 5′LTR-LacZ with the number of CTCF sites with P < 10−4 (calculated using FIMO, based on a dynamic programming algorithm to convert log-odds scores into P values) indicated as orange (sense) and red (antisense) triangles. KI, knock-in. ch, cHi-C of the Lbx1/Fgf8 locus (mm10, chr19:45,100,000–45,900,000) from Dac1J/Dac1J E11.5 mouse limb buds (c,d), Dac1J/Dac1J E11.5 mouse embryonic hearts (e,f) and Dac1J-5LTR-LacZ E11.5 limb buds (g,h). Data show the cHi-C as merged signals of n = 2 biological replicates and n = 2 technical replicates (c,d), n = 2 biological replicates (e,f) and n = 3 biological replicates (g,h). Subtraction maps between mutants and wild-type (d, f, h) show gain (red) and loss (blue) of interaction in the mutant compared to the wild-type. The position of the MusD-Dac1J insertion is indicated in green. Scale bars in a, c, e and g show the KR-normalized contact probability (white: low; black: high). Scales bars in d, f and h show the z-scaled differential contact probability (red: gain; blue: loss). i, 4C-seq with a viewpoint (VP) on Dac1J showing Dac1J/Dac1J (129s2/Sv) and Dac1J/Dac1J (C57BL/6). Green arrows indicate a difference in 4C enrichments. In vivo-confirmed Fgf8 enhancers are indicated in light blue and dark blue (specific AER enhancers), and the MusD-Dac1J insertion point is indicated in green. j, Representation of the Dac1J-5LTR-LacZ and β-globin-LacZ knock-ins at the Fgf8 locus and their β-galactosidase staining on E11.5 embryos and forelimbs, zoomed in. Scale bars, 500 µm; n = 20 out of 20 and 23 out of 23 embryos showed similar staining.
Fig. 4
Fig. 4. Presence of MusD retroviral-like particles is associated with AER cell death.
a, Anti-Gag-MusD whole-mount immunofluorescence on E10.5 Dac1J/Dac1J embryos showing embryo (left), forelimb (middle) and AER (right). n = 5 out of 5 biological replicates were confirmed. FL, forelimb; HL, hindlimb; BA, branchial arches; MHB, midbrain–hindbrain boundary. b, TEM analysis on E11.0 Dac1J/Dac1J AER cells. Three different cells are shown. Green arrowheads and dotted lines indicate single and aggregated VLPs, respectively. n = 5 biological and n = 2 technical replicates. C, cytoplasm; N, nucleus; ER, endoplasmic reticulum. c, TEM analysis after immuno-gold labeling with anti-Gag-MusD on E11.0 Dac1J/Dac1J AER cell shows cytoplasmic aggregates of GAG. n = 2 biological replicates and n = 6 technical replicates were confirmed. d, TEM analysis on E11.0 wild-type and Dac1J/Dac1J forelimbs. Zoomed-in view (right) shows the structure of an AER cell. Red asterisk indicates an apoptotic body. e, Anti-cleaved-Caspase-3 whole-mount immunofluorescence on E11.0 wild-type and Dac1J/Dac1J forelimb and AER. n = 4 out of 4 (wild-type) and n = 6 out of 6 (Dac1J/Dac1J) biological replicates were confirmed. f,g, Anti-γH2AX whole-mount immunofluorescence on wild-type and Dac1J/Dac1J E10.5 forelimbs (f) and E11.0 forelimbs and AER (g). n = 3 out of 3 biological replicates were confirmed. h, Schematic representation of wild-type and Dac1J/Dac1J limbs at E10.5, E11.0, E11.5 and E18.5. Although the AER of the limb bud is not morphologically affected in the Dac1J/Dac1J at E10.5, VLPs are expressed, and we detected increased DNA damage. Half a developmental day later, more DNA damage and apoptosis occur. By E11.5, most of the AER cells have been eliminated by cell death. Consequently, at E18.5, the autopod of the Dac1J/Dac1J embryos is severely affected by a lack of metacarpal structures, but the stylopod and zeugopod have developed similarly to the wild-type embryos. Styl., Stylopod; Zeug., Zeugopod; Aut., Autopod.
Fig. 5
Fig. 5. Knock-ins of MusD-Dac1J carrying mutation rescue dactylaplasia phenotypes.
a, Schematic representation of the MusD endogenous retroviral cycle in a cell. MusD DNA insertion is transcribed into mRNA in the nucleus. MusD RNA is then translated into the Gag (producing the capsid and matrix), Pro (the protease) and Pol (producing the reverse transcriptase, RNase H and integrase) in the cytoplasm and assembled into VLPs. The assembled VLPs contain reverse transcriptase, integrase and RNase H and are formed by the Gag capsid, which was cleaved by the protease. The VLP can replicate the non-autonomous ETn retrotransposons but also undergo tRNA-primed reverse transcription to reintegrate in the genome through a cDNA intermediate (as indicated with the dashed arrows). b, Representation of the Dac1J insertion along with the five mutated versions. Red and orange triangles represent CTCF sites. Purple band shows the location of the Lys-tRNA primer binding site, as wild-type and mutated (*). Red hexagon represents a Stop codon. c, Anti-GAG-MusD whole-mount immunofluorescence on E10.5 knock-in mutants: mut-pol KI/KI, mut-PBS KI/KI, mut-gag KI/KI and mut-gag(CA) KI/KI forelimb. At least n = 3 biological replicates were confirmed. d, Histogram of the percentage of animals showing the six possible digit phenotype situations in the different mutants. n represents the number of limbs (forelimbs and hindlimbs) analyzed.
Fig. 6
Fig. 6. MusD-Dac1J adopts the muscle progenitor expression when inserted in Lbx1 TAD.
a, Representation of the three knock-in lines engineered in the Lbx1 TAD. Purple band shows the location of the Lys-tRNA primer binding site, as wild-type and mutated (*). b, In situ hybridization for Lbx1 in E10.5 wild-type showing whole embryos and forelimb. Scale bars, 500 µm. At least n = 3 biological replicates were confirmed. c, β-galactosidase staining on E10.5 Dac1J-5LTR-LacZ (Lbx1 knock-in) showing whole embryos and forelimb. Scale bars, 500 µm. n = 10 out of 10 embryos show similar staining. d, Anti-Gag-MusD whole-mount immunofluorescence on E11.5 Dac1J KI/KI (Lbx1 knock-in) showing whole embryo (left) and forelimb (right). At least n = 3 biological replicates were confirmed.
Extended Data Fig. 1
Extended Data Fig. 1. Dactylaplasia phenotype and epigenetic polymorphism.
a, Dorsal, ventral and micro-computed tomography (μCT) views of wild-type, Dac1J/WT (129s2/Sv) and Dac1J/Dac1J (129s2/Sv) fore- and hind-paws from 7-month-old adults illustrating the phenotype in heterozygotes and homozygotes respectively. n = 2 biological replicates were analysed. White arrows indicate observed nail-like structures. b, ventral high-magnification view (top) and micro-computed tomography (μCT) (middle and bottom) of Dac1J/Dac1J (129s2/Sv) hind-paw illustrating a typical nail-like-structure (black arrow) which does not contain any bone. c, d, Ventral views of the various phenotypes observed in Dac1J/Dac1J (129s2/Sv) (c) and Dac1J/WT (129s2/Sv) (d) fore- and hindpaws. n = x/x paws with a similar phenotype. For a-d, scale bars 1 mm. e, DNA methylation status of 19 CpGs from the 5’LTR (promoter) of the MusD-Dac1J insertion at the Fgf8 locus in a C57BL/6 background (left) or 129s2/Sv background (right) measured by bisulfite cloning and sequencing from E11.5 brain, and visceral yolk sac. Constitutive low and high levels of DNA methylation of the MusD-Dac1J 5’LTR are observed in the 129s2/Sv and a C57BL/6 background respectively. White circles, unmethylated CpGs; black circles, methylated CpGs. f, Bulk RNA sequencing and epigenetic profiling (ATAC-seq, CTCF, H3K27ac and H3K4me ChIP-seq) from E11.5 wild-type forelimbs show that neither the MusD-Dac1J insertion nor its deletion seem to affect regulatory elements.
Extended Data Fig. 2
Extended Data Fig. 2. Local gene expression changes in Dac1J/Dac1J limb buds.
a, Rpkm expression of the 6 genes ate the Lbx1-Fgf8 locus from bulk RNA-sequencing from early E11.5 forelimbs wild type (grey), Dac1J/Dac1J (129s2/Sv) (light green), and Dac1J/Dac1J (C57BL/6) (dark green). Data are shown as mean ± s.e.m. of n = 3 biological replicates. b, In situ hybridization for Fgf8 at E10.5 (left) and in E11.5 (right) wild-type and Dac1J/Dac1J showing whole embryos and forelimbs. Dotted lines draw the shape of the forelimb. AER, apical ectoderm ridge. Scale bars 500um, at least n = 3 embryos were analysed per genotype.
Extended Data Fig. 3
Extended Data Fig. 3. Gene expression changes in Dac1J/Dac1J AER.
a, Violin plot from E9.5-E11.5 single-cell data showing expression of two marker genes per cluster. b, Histogram showing cell number in each cell cluster from wild-type and Dac1J/Dac1J at E9.5, E10.5, and E11.5. c, Violin plot depicting the expression of Fgf8 (left) and Fbxw4 (right) between wild-type (grey) and mutant (green) in each cluster, at the three tested embryonic stages. Each dot represents a cell.
Extended Data Fig. 4
Extended Data Fig. 4. Single-cell expression of AER genes and genes at the Lbx1-Fgf8 locus.
ac, Dot plots showing expression and percentage of expressing cells for Fgf8 and MusD-Dac1J at E11.5 (a), 6 AER genes (Dlx1, Dlx5, Dlx6, Msx2, Wnt6, and Fgf4) at E9.5, E10.5 and E11.5 (b), and the 5 genes at the Lbx1-Fgf8 locus at E9.5, E10.5 and E11.5 (c). Data are shown in the 7 forelimb cell cluster in wild-type (grey) and Dac1J/Dac1J (green).
Extended Data Fig. 5
Extended Data Fig. 5. 3D conformation changes at the Fgf8 locus.
a, Sequences of the 6 CTCFs binding sites detected in the MusD-Dac1J as identified with the FIMO (Find Individual Motif Occurrences) suite. The program uses a dynamic programming algorithm to convert log-odds scores into p-values, assuming a zero-order background model. p-value < 10−4 is considered as significant and marked in bold. FIMO score and p-value are indicated for each binding site. Orange and red triangles represent sense and antisense CTCF sites respectively. b, Zoom-in from the Capture-Hi-C subtraction map between wild-type and Dac1J/Dac1J (129s2/Sv) in Fig. 3d showing the Fgf8 TAD. c, Capture-Hi-C of the Lbx1/Fgf8 locus (mm10, chr19: 45,100,000-45,900,000) from Dac1J-Bl6 E11.5 mouse limbs buds. Data show the c-HiC as merged signals of n = 2 biological and 2 technical replicates. Subtraction maps between mutants and wild-type show gain (red) and loss (blue) of interaction in the mutant compared to the wild-type. d, CTCF ChIP-sequencing from forelimbs at E10.5 and E11.5 showing tracks at the Fgf8 locus. e, CpG DNA methylation status of 19 CpGs in the MusD-Dac1J 5’LTR from E11.5 Dac1J/Dac1J (129s2/Sv) hearts (left) and E11.5 5’LTR-LacZ KI/WT limbs (right). f, Skeletal analysis of E18.5 5LTR-LacZ KI +/- forelimbs stained with alcian blue (cartilage) and alizarin red (bone). Scale bars 1 mm, n = 8/8 show a similar phenotype.
Extended Data Fig. 6
Extended Data Fig. 6. Gag-MusD expression and VLPs in the Dac1J mutant embryos.
a, Table showing the percentage of amino-acid identity between MusD-Dac1J and the three MusD (MusD-1, 2, and 6) identified as autonomous for retro-transposition in Ribet et al. 2004. Identity, similarity, and gaps of amino-acids are indicated for both GAG and POL proteins. b, anti-GAG-MusD whole-mount immuno-fluorescence on E10.5 Dac1J/Dac1J (C57BL/6) embryos showing whole embryo with no staining. Scale bars 1 mm. n = 5/5 biological replicates were confirmed. c, d, anti-GAG-MusD whole-mount immuno-fluorescence on E10.5 (c) and E11.0 (d) Dac1J/Dac1J (129s2/Sv) embryos showing branchial arches (BA), midbrain-hindbrain boundary (MHB), tailbud (TB), whole embryo and limbs (FL, forelimbs; HL hindlimbs). Scale bar 100 nm. n = 5/5 (E10.5) and n = 4/4 (E11.0) biological replicates were confirmed. eg, TEM analysis after immuno-gold labeling with anti-GAG-MusD antibody on E11.0 Dac1J/Dac1J AER cells shows cytoplasmic aggregates of GAG. Scale bar 100 nm. n = 2 biological replicates and n = 6 technical replicates were confirmed. C, cytoplasm; N, nucleus. Green circle represents one VLP with Gag capsid. Red Asterix indicates an apoptotic body. h, TEM analysis after immuno-gold labeling with anti-GAG-MusD antibody on E11.0 wild-type control AER cell shows no staining. n = 2 biological replicates were confirmed. i, j, TEM analysis on E11.0 Dac1J/Dac1J hindlimbs (i) and zoom-in view on 4 forelimb AER cells showing apoptotic bodies and phagocytes (j). Scale bars 50um and 1um.
Extended Data Fig. 7
Extended Data Fig. 7. Apoptotic cell death in the Dac1J embryos.
a, b, anti-cleaved-Caspase3 (a) and anti-gamma-H2AX (b) whole-mount immuno-fluorescence on E11.0 wild-type and Dac1J/Dac1J showing branchial arches area. Scale bars 100um. At least n = 3 biological replicates were confirmed. cf, HCR in situ hybridization with an Fgf8 mRNA probe on showing embryonic forelimbs at E10.0 (30 somites), E10.5 (35 somites), E11.0 (40 somites) and E11.5 (46 somites) in wild-type (c) and Dac1J/Dac1J (d) embryos. Scale bars 100um and 50um. e, f, DAPI staining showing the AER area of forelimbs in wild-type (e) and Dac1J/Dac1J (f) embryos at E11.0 (40 somites) and E11.5 (46 somites). n = 2 biological replicates were confirmed for each genotype and stage. Scale bars 50um.
Extended Data Fig. 8
Extended Data Fig. 8. Gene expression changes in response to VLPs production in forelimbs.
ac, Heat-map showing log2 (rpkm+1) of selected apoptosis (a), developing limb (b), and interferon-stimulated (c) genes. Genes showing significant (p-value < 0.05) expression changes in Dac1J/Dac1J compared to wild-type are indicated with an asterisk. P-value was calculated using the DEseq2 package with a Wald test.
Extended Data Fig. 9
Extended Data Fig. 9. Knock-ins of MusD-Dac1J carrying mutations.
a, Detail of the 3554 bp deletion of the Pol gene and 3’ sequence (top), the 10 bp insertion of random DNA in the Dac1J-mutPBS knock-in (middle), and the two Gag mutations (bottom). In the Δ/ΔPol-Dac1J AER cells, Gag and Pro assemble into a VLP lacking reverse transcriptase. This incomplete VLP can neither replicate ETns, nor undergo tRNA primed reverse transcriptase of its RNA. In the Dac1J-mutPBS knock-in, the 10 bp insertion in the Lys tRNA primer binding site (PBS) leads to a scrambled PBS. In the Dac1J-mutPBS AER cells, Gag, Pro, and Pol assemble into VLP. The intact Pol allows possible replication of ETn elements, but the MusD VLPs are unable to undergo tRNA-primed reverse transcription. In the mut-gag knock-in, the entire gag gene is deleted, but a complete pro and pol protein can be assembled. In the mut-gag(CA) knock-in, the capsid and the zinc-finger domain are deleted so that the matrix (MA) protein of the gag polyprotein can be produced. b, anti-GAG-MusD whole-mount immuno-fluorescence on E11.5 mut-pol KI/KI (left), mut-PBS KI/KI (middle), and mut-gag(CA) KI/KI (right) whole embryos. Scale bars 1 mm. At least n = 3 biological replicates were confirmed. FL, forelimb; HL, hindlimb; BA, branchial arches; MHB, mid-hindbrain boundary. c, Representation of E18.5 skeletal analysis and adult limbs illustrating the six different observed phenotypes indicated in Fig. 5d. d, CpG DNA methylation at the 5’LTR promoter of the Dac1J insertion measured by pyrosequencing in Dac1J mut-pol KI, mut-PBS KI, mut-gag KI and mut-gag(CA) KI E18.5 embryos. Each dot represents the average CpG DNA methylation measured over 7 CpGs in one individual with a phenotype (red dot) or without a phenotype (black dot). Overall, no difference in 5’LTR DNA methylation is observed between the animals with or without a phenotype. e, Schematic representation of the 5’LTR CpGs content and the CpGs measured by pyrosequencing or bisulfite cloning sequencing.
Extended Data Fig. 10
Extended Data Fig. 10. MusD-Dac1J adopts the expression of genes surrounding its insertion.
a, b Schematic representation of the Dac1J -5LTR-LacZ knock-in at the Shh (a) and Sox9 (b) locus. c, whole mount in situ hybridization of Shh from E10.5 wild-type embryo. Scale bar 500um. n = 3 biological replicates were confirmed. d, beta-galactosidase staining on E10.0 Dac1J-5LTR-LacZ (Shh knock-in) showing whole embryos. Scale bars 500um, n = 3/4 embryos show similar staining. e, whole mount in situ hybridization of Sox9 from E12.5 wild-type embryo. Scale bar 500um. n = 3 biological replicates were confirmed. f, beta-galactosidase staining on E12.5 Dac1J-5LTR-LacZ (Sox9 knock-in) showing whole embryos. Scale bars 500um, n = 2/6 embryos show similar staining. g, anti-GAG-MusD whole-mount immuno-fluorescence on E11.5 Dac1J-mutPBS KI/KI (Lbx1 knock-in) showing forelimb staining. Scale bars 100um. At least n = 3 embryos were tested. h, Lysotracker staining of an E12.5 Dac1J KI/KI (Lbx1 knock-in) forelimb. Expected AER staining for that stage is observed but no muscle cell progenitor staining is detected. n = 3 embryos were analysed. Scale bars 100 um.

Similar articles

Cited by

References

    1. Wells, J. N. & Feschotte, C. A field guide to eukaryotic transposable elements. Annu. Rev. Genet.54, 539–561 (2020). - PMC - PubMed
    1. Payer, L. M. & Burns, K. H. Transposable elements in human genetic disease. Nat. Rev. Genet.20, 760–772 (2019). - PubMed
    1. Deniz, Ö., Frost, J. M. & Branco, M. R. Regulation of transposable elements by DNA modifications. Nat. Rev. Genet.20, 417–431 (2019). - PubMed
    1. Fadloun, A. et al. Chromatin signatures and retrotransposon profiling in mouse embryos reveal regulation of LINE-1 by RNA. Nat. Struct. Mol. Biol.20, 332–338 (2013). - PubMed
    1. Jachowicz, J. W. et al. LINE-1 activation after fertilization regulates global chromatin accessibility in the early mouse embryo. Nat. Genet.49, 1502–1510 (2017). - PubMed

LinkOut - more resources